Automotive Jobs with Work from Home Options

Automotive
UK > Work from Home

The table below looks at the prevalence of the term Automotive in remote or hybrid work. Included is a benchmarking guide to the salaries offered in vacancies that cited Automotive over the 6 months leading up to 26 July 2024, comparing them to the same period in the previous two years.

6 months to
26 Jul 2024
Same period 2023 Same period 2022
Rank 290 300 341
Rank change year-on-year +10 +41 +48
Permanent jobs citing Automotive 281 329 826
As % of all permanent jobs with a WFH option 1.01% 1.00% 1.05%
As % of the General category 1.65% 1.54% 1.59%
Number of salaries quoted 181 204 347
10th Percentile £40,000 £35,725 £35,000
25th Percentile £49,500 £44,606 £42,500
Median annual salary (50th Percentile) £57,500 £55,000 £55,000
Median % change year-on-year +4.55% - -
75th Percentile £68,750 £71,250 £67,500
90th Percentile £81,250 £77,500 £80,052
UK median annual salary £55,000 £57,500 £46,000
% change year-on-year -4.35% +25.00% -8.00%

All General Skills
Work from Home

Automotive falls under the General Skills category. For comparison with the information above, the following table provides summary statistics for all permanent job vacancies with remote or hybrid options requiring common skills.

Permanent vacancies with a requirement for common skills 17,022 21,367 51,870
As % of all permanent jobs with a WFH option 60.93% 65.11% 66.05%
Number of salaries quoted 11,520 15,606 26,987
10th Percentile £32,500 £36,250 £35,000
25th Percentile £42,500 £46,570 £45,000
Median annual salary (50th Percentile) £57,500 £62,500 £60,000
Median % change year-on-year -8.00% +4.17% +7.14%
75th Percentile £77,500 £82,500 £80,000
90th Percentile £100,000 £102,500 £96,250
UK median annual salary £54,000 £60,000 £60,000
% change year-on-year -10.00% - +6.19%

Automotive
Trend for Jobs with a WFH Option

Job vacancies with a work from home option citing Automotive as a proportion of all IT jobs advertised.
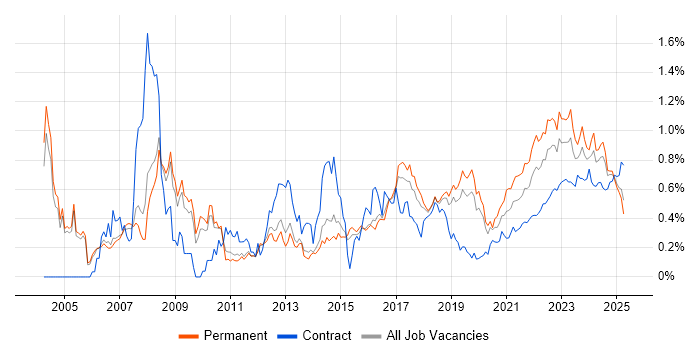
Automotive trend for jobs with a WFH option

Automotive
Salary Trend for Jobs with a WFH Option

3-month moving average salary quoted in job vacancies with a work from home option citing Automotive.

Automotive salary trend for jobs with a WFH option

Automotive
Salary Histogram for Jobs with a WFH Option

Salary distribution for jobs with a work from home option citing Automotive over the 6 months to 26 July 2024.

Automotive salary histogram for jobs with a WFH option

Automotive
Co-occurring Skills and Capabilities with WFH Options by Category

The follow tables expand on the table above by listing co-occurrences grouped by category. The same employment type, locality and period is covered with up to 20 co-occurrences shown in each of the following categories:

Application Platforms
1 3 (1.07%) SharePoint
2 2 (0.71%) CMS
2 2 (0.71%) Oracle Collaboration Suite
3 1 (0.36%) Apache
3 1 (0.36%) Apache Spark
3 1 (0.36%) nginx
Applications
1 24 (8.54%) Simulink
2 15 (5.34%) Microsoft Office
3 9 (3.20%) Microsoft Excel
4 8 (2.85%) Microsoft PowerPoint
5 5 (1.78%) Stateflow
6 3 (1.07%) AutoCAD
6 3 (1.07%) CATIA
7 2 (0.71%) Adobe Captivate
7 2 (0.71%) Adobe Premiere
7 2 (0.71%) CANalyzer
7 2 (0.71%) InDesign
7 2 (0.71%) Microsoft Project
8 1 (0.36%) Trello
8 1 (0.36%) Windchill
Business Applications
1 3 (1.07%) Dynamics CRM
2 2 (0.71%) Primavera
3 1 (0.36%) SAP S/4HANA
Cloud Services
1 45 (16.01%) SaaS
2 39 (13.88%) Azure
3 27 (9.61%) AWS
4 21 (7.47%) Azure Functions
4 21 (7.47%) Serverless
5 18 (6.41%) GitHub
6 17 (6.05%) Amazon SQS
6 17 (6.05%) Azure AKS
7 16 (5.69%) Akamai
7 16 (5.69%) Amazon ECS
7 16 (5.69%) Amazon EKS
7 16 (5.69%) Amazon S3
7 16 (5.69%) AWS CloudFormation
7 16 (5.69%) AWS Fargate
7 16 (5.69%) AWS Lambda
7 16 (5.69%) Cloudflare
7 16 (5.69%) CloudFront
8 8 (2.85%) Azure DevOps
8 8 (2.85%) Dynamics 365
9 7 (2.49%) Azure Stack
Communications & Networking
1 9 (3.20%) HTTP
2 7 (2.49%) J1939
3 6 (2.14%) Internet
3 6 (2.14%) TCP/IP
4 5 (1.78%) Bluetooth
5 3 (1.07%) Wireless
6 2 (0.71%) Ethernet
7 1 (0.36%) DNS
7 1 (0.36%) Firewall
7 1 (0.36%) FlexRay
7 1 (0.36%) SSL
Database & Business Intelligence
1 7 (2.49%) Elasticsearch
2 6 (2.14%) MySQL
2 6 (2.14%) Power BI
2 6 (2.14%) Redis
2 6 (2.14%) Relational Database
3 4 (1.42%) GIS
3 4 (1.42%) Tableau
4 2 (0.71%) Azure SQL Database
4 2 (0.71%) Data Warehouse
4 2 (0.71%) SQL Server
5 1 (0.36%) Apache Cassandra
5 1 (0.36%) Big Data
5 1 (0.36%) Data Vault
5 1 (0.36%) MongoDB
5 1 (0.36%) NoSQL
5 1 (0.36%) PostgreSQL
Development Applications
1 36 (12.81%) Git
2 14 (4.98%) JIRA
3 5 (1.78%) ClearCase
3 5 (1.78%) ClearQuest
3 5 (1.78%) Plastic SCM
4 4 (1.42%) Visual Studio
5 3 (1.07%) Cypress.io
5 3 (1.07%) Protractor
6 2 (0.71%) CANoe
6 2 (0.71%) Jenkins
6 2 (0.71%) JUnit
6 2 (0.71%) PowerBuilder
6 2 (0.71%) Selenium
6 2 (0.71%) TestNG
7 1 (0.36%) Appium
7 1 (0.36%) GitLab
7 1 (0.36%) UI Automator
General
1 62 (22.06%) Social Skills
2 58 (20.64%) Manufacturing
3 42 (14.95%) Electronics
4 40 (14.23%) Marketing
5 36 (12.81%) Analytical Skills
6 33 (11.74%) Aerospace
7 27 (9.61%) Finance
8 19 (6.76%) Retail
9 17 (6.05%) Legal
10 8 (2.85%) Public Sector
11 7 (2.49%) Inclusion and Diversity
11 7 (2.49%) Presentation Skills
12 4 (1.42%) Aviation
12 4 (1.42%) Banking
12 4 (1.42%) Publishing
13 3 (1.07%) Brand Awareness
14 2 (0.71%) Documentation Skills
15 1 (0.36%) Influencing Skills
15 1 (0.36%) Investment Banking
15 1 (0.36%) Telecoms
Job Titles
1 54 (19.22%) Lead
2 53 (18.86%) Software Engineer
3 45 (16.01%) Senior
4 36 (12.81%) Developer
5 28 (9.96%) Embedded Engineer
6 24 (8.54%) Embedded Software Engineer
7 15 (5.34%) Business Development Manager
7 15 (5.34%) Business Manager
7 15 (5.34%) Development Manager
8 13 (4.63%) Consultant
9 10 (3.56%) AWS DevOps
10 9 (3.20%) Lead DevOps
10 9 (3.20%) Software Developer
11 8 (2.85%) Architect
11 8 (2.85%) C++ Software Engineer
11 8 (2.85%) Data Centre Engineer
11 8 (2.85%) Testing Engineer
12 7 (2.49%) C# Software Engineer
12 7 (2.49%) Software Team Leader
12 7 (2.49%) Team Leader
Libraries, Frameworks & Software Standards
1 29 (10.32%) .NET
2 11 (3.91%) HTML
3 10 (3.56%) AngularJS
3 10 (3.56%) Node.js
3 10 (3.56%) React
4 9 (3.20%) Kafka
5 7 (2.49%) RESTful
5 7 (2.49%) XML
6 6 (2.14%) CSS
6 6 (2.14%) WinForms
6 6 (2.14%) WPF
7 5 (1.78%) HTML5 Canvas
8 4 (1.42%) NumPy
8 4 (1.42%) PyTorch
8 4 (1.42%) TensorFlow
9 3 (1.07%) .NET Core
9 3 (1.07%) Jest
9 3 (1.07%) Laravel
9 3 (1.07%) Vue
10 2 (0.71%) React Native
Miscellaneous
1 25 (8.90%) Mobile App
2 24 (8.54%) Embedded Systems
3 15 (5.34%) Client/Server
4 12 (4.27%) Algorithms
4 12 (4.27%) Product Ownership
5 11 (3.91%) Data Centre
6 8 (2.85%) Device Driver
6 8 (2.85%) IoT
7 7 (2.49%) Driving Licence
8 5 (1.78%) Low-Code
9 4 (1.42%) Blog
9 4 (1.42%) Greenfield Project
9 4 (1.42%) Raspberry Pi
10 3 (1.07%) FMCG
10 3 (1.07%) Infotainment
10 3 (1.07%) Legacy Applications
10 3 (1.07%) Self-Motivation
11 2 (0.71%) Data Structures
11 2 (0.71%) Management Information System
11 2 (0.71%) Virtual Team
Operating Systems
1 24 (8.54%) Windows
2 22 (7.83%) Linux
3 11 (3.91%) Windows Server
4 8 (2.85%) Apple iOS
5 6 (2.14%) Android
5 6 (2.14%) FreeRTOS
6 4 (1.42%) Windows 10
6 4 (1.42%) Windows 2000
6 4 (1.42%) Windows NT
6 4 (1.42%) Windows Server 2003
6 4 (1.42%) Windows Server 2008
6 4 (1.42%) Windows Server 2012
6 4 (1.42%) Windows Server 2016
6 4 (1.42%) Windows Server 2019
6 4 (1.42%) Windows XP
7 3 (1.07%) Windows Embedded Compact
8 1 (0.36%) Mac OS
8 1 (0.36%) Mac OS X
8 1 (0.36%) Red Hat Enterprise Linux
Processes & Methodologies
1 68 (24.20%) Software Engineering
2 56 (19.93%) Problem-Solving
3 51 (18.15%) Agile
4 33 (11.74%) Project Management
5 28 (9.96%) Decision-Making
6 27 (9.61%) DevOps
7 26 (9.25%) Business Development
7 26 (9.25%) Logistics
8 24 (8.54%) Computer Science
8 24 (8.54%) Mentoring
8 24 (8.54%) Microservices
9 23 (8.19%) Asset Management
10 20 (7.12%) Continuous Improvement
11 19 (6.76%) Project Delivery
11 19 (6.76%) Validation
12 18 (6.41%) Containerisation
12 18 (6.41%) Software Testing
12 18 (6.41%) Test Automation
12 18 (6.41%) User Experience
13 16 (5.69%) Digital Content Management
Programming Languages
1 53 (18.86%) Python
2 41 (14.59%) C
3 34 (12.10%) C++
4 29 (10.32%) C#
5 25 (8.90%) MATLAB
6 24 (8.54%) Java
7 22 (7.83%) JavaScript
8 15 (5.34%) TypeScript
9 10 (3.56%) SQL
10 6 (2.14%) Embedded C
10 6 (2.14%) Embedded C++
11 4 (1.42%) PHP
11 4 (1.42%) R
12 3 (1.07%) Ada
12 3 (1.07%) PL/SQL
13 2 (0.71%) Bicep
13 2 (0.71%) Rust
13 2 (0.71%) VB.NET
14 1 (0.36%) Kotlin
14 1 (0.36%) Swift
Qualifications
1 68 (24.20%) Degree
2 8 (2.85%) Security Cleared
3 7 (2.49%) Master's Degree
4 5 (1.78%) Computer Science Degree
4 5 (1.78%) PhD
5 4 (1.42%) Azure Certification
6 3 (1.07%) CISM
6 3 (1.07%) CISSP
6 3 (1.07%) HNC
6 3 (1.07%) HND
7 2 (0.71%) Chartered Engineer
7 2 (0.71%) PMI Certification
7 2 (0.71%) PMP
8 1 (0.36%) CompTIA Security+
8 1 (0.36%) ISO 27001 Lead Implementer
8 1 (0.36%) MBA
8 1 (0.36%) Microsoft Certification
8 1 (0.36%) SC Cleared
Quality Assurance & Compliance
1 12 (4.27%) ISO 26262
2 11 (3.91%) AUTOSAR
3 10 (3.56%) Automotive SPICE
3 10 (3.56%) QA
4 8 (2.85%) MISRA
5 6 (2.14%) ISO 9001
6 3 (1.07%) ISO/IEC 27001
6 3 (1.07%) NIST
7 2 (0.71%) Cyber Essentials
7 2 (0.71%) Cyber Essentials PLUS
7 2 (0.71%) MISRA C
7 2 (0.71%) PMO
8 1 (0.36%) COSHH
8 1 (0.36%) ISO 14001
8 1 (0.36%) ISO/IEC 17025
8 1 (0.36%) NCSC
8 1 (0.36%) RMADS
8 1 (0.36%) SLA
System Software
1 23 (8.19%) Docker
2 16 (5.69%) Virtual Machines
3 13 (4.63%) Firmware
4 11 (3.91%) Embedded Firmware
5 4 (1.42%) VMware Infrastructure
Systems Management
1 26 (9.25%) Kubernetes
2 4 (1.42%) SCCM
2 4 (1.42%) SCOM
2 4 (1.42%) WSUS
3 3 (1.07%) Terraform
4 1 (0.36%) Ansible
4 1 (0.36%) Puppet
4 1 (0.36%) Single Sign-On
Vendors
1 24 (8.54%) Microsoft
2 16 (5.69%) ForgeRock
2 16 (5.69%) Sitecore
3 5 (1.78%) IBM
3 5 (1.78%) Lauterbach
4 4 (1.42%) VMware
5 3 (1.07%) Databricks
5 3 (1.07%) Epicor
5 3 (1.07%) Oracle
5 3 (1.07%) Samsung
5 3 (1.07%) SAP
6 2 (0.71%) Adobe
6 2 (0.71%) IFS
6 2 (0.71%) NEC
6 2 (0.71%) QNX
7 1 (0.36%) Cisco
7 1 (0.36%) Fortinet
7 1 (0.36%) Google
7 1 (0.36%) MathWorks
7 1 (0.36%) Meraki