Architectural Design Jobs with Hybrid/Remote/WFH Options

Architectural Design
UK > Work from Home

The table below provides summary statistics for permanent remote or hybrid work requiring Architectural Design skills. It includes a benchmarking guide to the annual salaries offered in vacancies that cited Architectural Design over the 6 months leading up to 3 May 2025, comparing them to the same period in the previous two years.

6 months to
3 May 2025
Same period 2024 Same period 2023
Rank 266 339 324
Rank change year-on-year +73 -15 -43
Permanent jobs citing Architectural Design 157 265 409
As % of all permanent jobs with a WFH option 1.03% 0.78% 0.96%
As % of the Processes & Methodologies category 1.11% 0.86% 1.00%
Number of salaries quoted 119 211 225
10th Percentile £57,950 £42,500 £56,250
25th Percentile £60,000 £65,000 £65,000
Median annual salary (50th Percentile) £77,500 £79,932 £75,000
Median % change year-on-year -3.04% +6.58% +6.01%
75th Percentile £88,125 £93,750 £90,000
90th Percentile £109,000 £107,500 £102,000
UK median annual salary £75,000 £79,932 £75,000
% change year-on-year -6.17% +6.58% -

All Process and Methodology Skills
Work from Home

Architectural Design falls under the Processes and Methodologies category. For comparison with the information above, the following table provides summary statistics for all permanent job vacancies with remote or hybrid options requiring process or methodology skills.

Permanent vacancies with a requirement for process or methodology skills 14,134 30,993 40,912
As % of all permanent jobs with a WFH option 93.17% 91.62% 96.10%
Number of salaries quoted 9,780 23,560 28,419
10th Percentile £30,000 £33,750 £37,500
25th Percentile £45,000 £42,500 £47,500
Median annual salary (50th Percentile) £60,000 £57,500 £62,500
Median % change year-on-year +4.35% -8.00% +4.17%
75th Percentile £77,500 £75,000 £82,500
90th Percentile £102,500 £95,000 £100,000
UK median annual salary £57,500 £55,000 £61,500
% change year-on-year +4.55% -10.57% +2.50%

Architectural Design
Trend for Jobs with a WFH Option

Job vacancies with remote working options citing Architectural Design as a proportion of all IT jobs advertised.
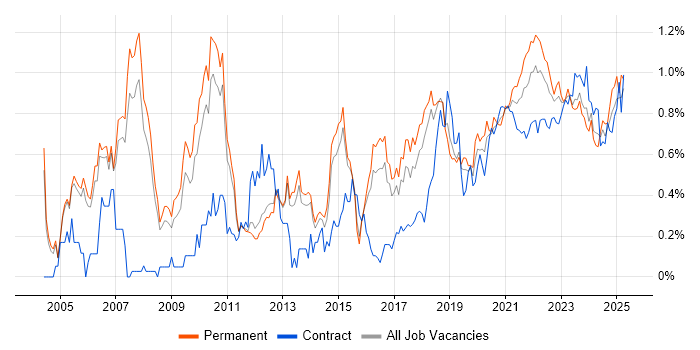
Architectural Design trend for jobs with Hybrid/Remote/WFH options

Architectural Design
Salary Trend for Jobs with a WFH Option

3-month moving average salary quoted in job vacancies with remote working options citing Architectural Design.

Architectural Design salary trend for jobs with a WFH option

Architectural Design
Salary Histogram for Jobs with a WFH Option

Salary distribution for jobs with remote working options citing Architectural Design over the 6 months to 3 May 2025.

Architectural Design salary histogram for jobs with a WFH option

Architectural Design
Co-occurring Skills and Capabilities with WFH Options by Category

The follow tables expand on the table above by listing co-occurrences grouped by category. The same employment type, locality and period is covered with up to 20 co-occurrences shown in each of the following categories:

Application Platforms
1 3 (1.91%) CMS
1 3 (1.91%) Oracle SOA Suite
2 2 (1.27%) Confluence
Applications
1 5 (3.18%) Microsoft Office
Business Applications
1 3 (1.91%) Oracle EBS
1 3 (1.91%) SAP S/4HANA
2 1 (0.64%) Dynamics CRM
2 1 (0.64%) SAP FI
Cloud Services
1 47 (29.94%) Azure
2 36 (22.93%) AWS
3 35 (22.29%) GCP
4 17 (10.83%) SaaS
5 16 (10.19%) Serverless
6 14 (8.92%) AWS Lambda
7 13 (8.28%) AWS CloudFormation
7 13 (8.28%) AWS KMS
8 8 (5.10%) npm
8 8 (5.10%) PaaS
9 5 (3.18%) IaaS
10 3 (1.91%) Amazon ECS
10 3 (1.91%) Dynamics 365
10 3 (1.91%) OCI
10 3 (1.91%) Power Platform
10 3 (1.91%) PowerApps
11 2 (1.27%) Amazon CloudWatch
11 2 (1.27%) Amazon ECR
11 2 (1.27%) GitHub Actions
11 2 (1.27%) Snowflake
Communications & Networking
1 14 (8.92%) Network Security
2 6 (3.82%) DNS
3 5 (3.18%) DHCP
3 5 (3.18%) Firewall
3 5 (3.18%) NAS
3 5 (3.18%) SAN
3 5 (3.18%) VSAN
4 2 (1.27%) SNMP
5 1 (0.64%) Cisco ISE
5 1 (0.64%) Cisco Nexus
5 1 (0.64%) Ethernet
5 1 (0.64%) InfiniBand
5 1 (0.64%) LAN
5 1 (0.64%) MPLS
5 1 (0.64%) SD-WAN
5 1 (0.64%) Software-Defined Networking
5 1 (0.64%) SpaceWire
5 1 (0.64%) WAN
5 1 (0.64%) WLAN
Database & Business Intelligence
1 12 (7.64%) NoSQL
2 11 (7.01%) PostgreSQL
3 8 (5.10%) Data Lake
4 6 (3.82%) SQL Server
5 5 (3.18%) MongoDB
6 3 (1.91%) MySQL
6 3 (1.91%) Oracle ODI
7 2 (1.27%) Cloud Spanner
7 2 (1.27%) Elasticsearch
7 2 (1.27%) Oracle Database
7 2 (1.27%) Power BI
7 2 (1.27%) Redis
8 1 (0.64%) Azure SQL Database
8 1 (0.64%) Big Data
8 1 (0.64%) Data Warehouse
8 1 (0.64%) DynamoDB
8 1 (0.64%) Flink
8 1 (0.64%) PowerCenter
8 1 (0.64%) SAP BW
8 1 (0.64%) SQL Server Reporting Services
Development Applications
1 25 (15.92%) Git
2 8 (5.10%) Cucumber
2 8 (5.10%) Cypress.io
2 8 (5.10%) Sonatype Nexus
2 8 (5.10%) webpack
3 7 (4.46%) JIRA
4 5 (3.18%) Oracle Forms
5 4 (2.55%) GitLab
6 2 (1.27%) Atlassian Bamboo
6 2 (1.27%) Jenkins
6 2 (1.27%) JUnit
6 2 (1.27%) Maven
6 2 (1.27%) Mockito
6 2 (1.27%) Postman
6 2 (1.27%) REST Assured
6 2 (1.27%) SoapUI
6 2 (1.27%) SonarQube
6 2 (1.27%) Subversion
6 2 (1.27%) Xcode
6 2 (1.27%) XCTest
General
1 54 (34.39%) Social Skills
2 32 (20.38%) Finance
3 24 (15.29%) Banking
4 21 (13.38%) Electronics
5 14 (8.92%) Inclusion and Diversity
6 13 (8.28%) Games
7 10 (6.37%) Law
7 10 (6.37%) Public Sector
8 7 (4.46%) Presentation Skills
9 6 (3.82%) Tech for Good
10 5 (3.18%) Analytical Skills
10 5 (3.18%) Marketing
11 4 (2.55%) iGaming
11 4 (2.55%) Influencing Skills
11 4 (2.55%) Retail
12 3 (1.91%) Documentation Skills
12 3 (1.91%) French Language
13 2 (1.27%) Aerospace
13 2 (1.27%) Manufacturing
13 2 (1.27%) Telecoms
Job Titles
1 64 (40.76%) Architect
2 40 (25.48%) Senior
3 35 (22.29%) Solutions Architect
4 22 (14.01%) Lead
5 20 (12.74%) Senior Architect
5 20 (12.74%) Senior Solutions Architect
6 19 (12.10%) AWS Architect
7 16 (10.19%) Cloud Architect
8 11 (7.01%) Consultant
8 11 (7.01%) Infrastructure Engineer
9 10 (6.37%) Cloud Engineer
9 10 (6.37%) IT Consultant
9 10 (6.37%) Software Engineer
10 9 (5.73%) Data Architect
11 8 (5.10%) Analyst
11 8 (5.10%) Cloud Infrastructure Engineer
11 8 (5.10%) Integration Architect
11 8 (5.10%) Java Engineer
11 8 (5.10%) Lead Java Engineer
11 8 (5.10%) SOC Analyst
Libraries, Frameworks & Software Standards
1 21 (13.38%) Kafka
2 17 (10.83%) Spring Boot
3 13 (8.28%) Elastic Stack
3 13 (8.28%) Node.js
4 11 (7.01%) .NET
4 11 (7.01%) React
5 10 (6.37%) RESTful
5 10 (6.37%) Web Services
6 8 (5.10%) Jest
7 7 (4.46%) Playwright
7 7 (4.46%) Spring
8 6 (3.82%) AngularJS
8 6 (3.82%) HTML
8 6 (3.82%) HTML5
8 6 (3.82%) Middleware
8 6 (3.82%) OpenAPI
8 6 (3.82%) RabbitMQ
8 6 (3.82%) REST
9 4 (2.55%) Android Jetpack
9 4 (2.55%) SwiftUI
Miscellaneous
1 39 (24.84%) Management Information System
2 31 (19.75%) Cloud Native
3 21 (13.38%) Public Cloud
4 19 (12.10%) Algorithms
5 14 (8.92%) Legacy Systems
5 14 (8.92%) Virtual Team
6 10 (6.37%) CSOC
6 10 (6.37%) Mobile App
6 10 (6.37%) Mobile Games
6 10 (6.37%) Onboarding
7 8 (5.10%) Distributed Applications
7 8 (5.10%) Distributed Architecture
8 6 (3.82%) Analogue Electronics
8 6 (3.82%) FPGA
8 6 (3.82%) Life Science
8 6 (3.82%) VHDL
9 5 (3.18%) Hybrid Cloud
10 3 (1.91%) CMDB
10 3 (1.91%) Distributed Systems
10 3 (1.91%) Renewable Energy
Operating Systems
1 9 (5.73%) Windows
2 8 (5.10%) Linux
3 4 (2.55%) Android
3 4 (2.55%) Apple iOS
4 2 (1.27%) CentOS
4 2 (1.27%) Unix
4 2 (1.27%) Windows Server
5 1 (0.64%) VMS
Processes & Methodologies
1 52 (33.12%) Mentoring
2 48 (30.57%) Agile
3 42 (26.75%) CI/CD
4 41 (26.11%) DevOps
4 41 (26.11%) Microservices
4 41 (26.11%) Software Engineering
5 39 (24.84%) Technical Leadership
6 36 (22.93%) Event-Driven
7 35 (22.29%) Event-Driven Architecture
8 32 (20.38%) Problem-Solving
9 31 (19.75%) Containerisation
10 26 (16.56%) Architectural Patterns
11 24 (15.29%) Stakeholder Management
12 23 (14.65%) Computer Science
12 23 (14.65%) Incident Response
13 21 (13.38%) Roadmaps
14 20 (12.74%) Analytics
14 20 (12.74%) Full-Stack Development
14 20 (12.74%) Test Automation
15 18 (11.46%) Service Delivery
Programming Languages
1 43 (27.39%) Java
2 26 (16.56%) SQL
3 24 (15.29%) Python
4 18 (11.46%) JavaScript
5 17 (10.83%) C#
6 11 (7.01%) TypeScript
7 7 (4.46%) C
8 6 (3.82%) C++
9 4 (2.55%) Swift
10 3 (1.91%) Ruby
10 3 (1.91%) Shell Script
11 2 (1.27%) Bash
11 2 (1.27%) Groovy
12 1 (0.64%) Go
12 1 (0.64%) PowerShell
12 1 (0.64%) Scala
Qualifications
1 33 (21.02%) Security Cleared
2 28 (17.83%) SC Cleared
3 24 (15.29%) Degree
4 22 (14.01%) Computer Science Degree
5 19 (12.10%) AWS Certification
5 19 (12.10%) AWS Certified Solutions Architect
6 14 (8.92%) BPSS Clearance
7 11 (7.01%) Azure Certification
8 5 (3.18%) Microsoft Certification
8 5 (3.18%) VMware Certified Professional (VCP)
9 3 (1.91%) TOGAF Certification
10 2 (1.27%) DV Cleared
10 2 (1.27%) Master's Degree
11 1 (0.64%) CCNP
11 1 (0.64%) Cisco Certification
11 1 (0.64%) DBS Check
11 1 (0.64%) RIBA
11 1 (0.64%) SAP Certification
Quality Assurance & Compliance
1 22 (14.01%) GDPR
1 22 (14.01%) HIPAA
2 14 (8.92%) ISO/IEC 15288
3 6 (3.82%) NIST
4 4 (2.55%) Accessibility
4 4 (2.55%) QA
5 3 (1.91%) ISO/IEC 27001
5 3 (1.91%) SOC 2
6 1 (0.64%) Data Quality
6 1 (0.64%) ECSS
System Software
1 34 (21.66%) Docker
2 7 (4.46%) VMware NSX
3 6 (3.82%) Firmware
4 2 (1.27%) Active Directory
4 2 (1.27%) VMware ESXi
Systems Management
1 28 (17.83%) Kubernetes
2 24 (15.29%) Terraform
3 16 (10.19%) Grafana
4 14 (8.92%) Prometheus
5 10 (6.37%) QRadar
6 5 (3.18%) Progress Chef
7 4 (2.55%) Ansible
8 2 (1.27%) Nagios
Vendors
1 29 (18.47%) Microsoft
2 19 (12.10%) Google
3 10 (6.37%) Oracle
4 7 (4.46%) VMware
5 5 (3.18%) Databricks
5 5 (3.18%) EMC
5 5 (3.18%) SAP
6 4 (2.55%) Splunk
7 3 (1.91%) Cisco
8 2 (1.27%) CA Agile Central
8 2 (1.27%) Dynatrace
8 2 (1.27%) Rapid7
8 2 (1.27%) Red Hat
9 1 (0.64%) Informatica
9 1 (0.64%) Meraki
9 1 (0.64%) NVIDIA
9 1 (0.64%) PagerDuty
9 1 (0.64%) Palo Alto
9 1 (0.64%) Sparx