Hybrid/Remote Analytical Skills Job Trends

Analytical Skills
UK > Work from Home

The table below looks at the prevalence of the term Analytical Skills in remote or hybrid work. Included is a benchmarking guide to the salaries offered in vacancies that cited Analytical Skills over the 6 months leading up to 23 November 2025, comparing them to the same period in the previous two years.

6 months to
23 Nov 2025
Same period 2024 Same period 2023
Rank 10 16 23
Rank change year-on-year +6 +7 +4
Permanent jobs citing Analytical Skills 2,013 2,120 1,952
As % of all permanent jobs with remote/hybrid work options 13.24% 10.47% 9.14%
As % of the General category 20.36% 16.56% 14.04%
Number of salaries quoted 944 1,096 1,393
10th Percentile £29,000 £34,404 £32,625
25th Percentile £39,000 £42,500 £42,500
Median annual salary (50th Percentile) £50,000 £57,000 £57,550
Median % change year-on-year -12.28% -0.96% +4.64%
75th Percentile £70,000 £72,500 £72,500
90th Percentile £85,000 £90,000 £87,500
UK median annual salary £50,000 £55,000 £56,868
% change year-on-year -9.09% -3.28% +3.40%

All General Skills
Work from Home

Analytical Skills falls under the General Skills category. For comparison with the information above, the following table provides summary statistics for all permanent job vacancies with remote or hybrid options requiring common skills.

Permanent vacancies with a requirement for common skills 9,888 12,804 13,901
As % of all permanent jobs with a WFH option 65.03% 63.22% 65.08%
Number of salaries quoted 6,312 7,445 10,946
10th Percentile £28,500 £35,000 £36,085
25th Percentile £38,500 £46,250 £46,250
Median annual salary (50th Percentile) £55,000 £62,500 £62,500
Median % change year-on-year -12.00% - +0.81%
75th Percentile £77,500 £83,750 £82,500
90th Percentile £100,000 £108,750 £100,000
UK median annual salary £52,500 £60,000 £60,000
% change year-on-year -12.50% - -

Analytical Skills
Job Vacancy Trend for Remote/Hybrid Jobs

Historical trend showing the proportion of permanent IT job postings citing Analytical Skills and offering remote or hybrid work options relative to all permanent IT jobs advertised.
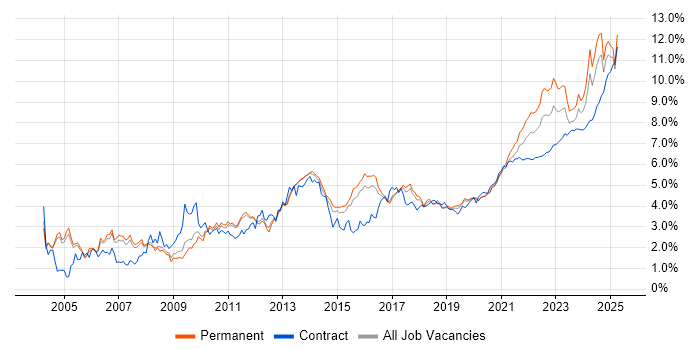
Analytical Skills job vacancy trend for remote/hybrid jobs

Analytical Skills
Salary Trend for Remote/Hybrid Jobs

Salary distribution trend for jobs with remote/hybrid work options citing Analytical Skills.

Salary distribution trend for jobs with remote/hybrid work options citing Analytical Skills

Analytical Skills
Salary Histogram for Remote/Hybrid Jobs

Salary distribution for jobs with remote/hybrid work options citing Analytical Skills over the 6 months to 23 November 2025.

Analytical Skills salary histogram for jobs with remote/hybrid work options

Analytical Skills
Co-Occurring Skills & Capabilities in Remote/Hybrid Jobs by Category

The following tables expand on the one above by listing co-occurrences grouped by category. They cover the same employment type, locality and period, with up to 20 co-occurrences shown in each category:

Application Platforms
1 39 (1.94%) SharePoint
2 38 (1.89%) Confluence
3 21 (1.04%) CMS
4 14 (0.70%) Microsoft Exchange
5 6 (0.30%) SAS
5 6 (0.30%) WordPress
6 5 (0.25%) Apache Spark
7 4 (0.20%) Apache
7 4 (0.20%) Drupal
7 4 (0.20%) Moodle
8 3 (0.15%) HCL Notes
8 3 (0.15%) nginx
8 3 (0.15%) Skype for Business
9 2 (0.099%) Apache Airflow
9 2 (0.099%) ArcGIS
9 2 (0.099%) IIS
9 2 (0.099%) Oracle SOA Suite
10 1 (0.050%) Oracle Workflow
10 1 (0.050%) WebLogic
Applications
1 551 (27.37%) Chatbot
2 250 (12.42%) Microsoft Excel
3 124 (6.16%) Microsoft Office
4 46 (2.29%) Microsoft PowerPoint
5 26 (1.29%) Spreadsheet
6 21 (1.04%) MS Visio
7 12 (0.60%) Adobe XD
8 7 (0.35%) Microsoft Project
9 4 (0.20%) Blender
9 4 (0.20%) Oracle Smart View
9 4 (0.20%) Photoshop
10 3 (0.15%) Adobe Creative Suite
11 1 (0.050%) Camtasia
11 1 (0.050%) InVision
11 1 (0.050%) Notion
11 1 (0.050%) PlantUML
11 1 (0.050%) Sketch
11 1 (0.050%) SmartSuite
Business Applications
1 31 (1.54%) NetSuite
2 29 (1.44%) SAP S/4HANA
3 20 (0.99%) Dynamics CRM
4 18 (0.89%) Shopify
5 17 (0.84%) Oracle Payables
6 12 (0.60%) SAP FI
7 11 (0.55%) SAP CO
7 11 (0.55%) SAP FI/CO
8 10 (0.50%) Oracle Assets
8 10 (0.50%) Oracle General Ledger
8 10 (0.50%) Oracle Receivables
9 9 (0.45%) Oracle ERP
10 8 (0.40%) Oracle Financials
11 7 (0.35%) Dynamics GP
12 4 (0.20%) Elite 3E
12 4 (0.20%) Hyperion Planning
12 4 (0.20%) Sage X3
12 4 (0.20%) Salesforce CRM
13 3 (0.15%) Primavera
14 2 (0.099%) SAP SD
Cloud Services
1 239 (11.87%) Azure
2 224 (11.13%) Power Platform
3 108 (5.37%) SaaS
4 94 (4.67%) AWS
5 67 (3.33%) Azure DevOps
5 67 (3.33%) Dynamics 365
6 57 (2.83%) Google Analytics
7 52 (2.58%) Microsoft 365
8 50 (2.48%) Azure Data Factory
9 48 (2.38%) GitHub
10 41 (2.04%) GCP
11 38 (1.89%) Snowflake
12 30 (1.49%) Azure Synapse Analytics
13 25 (1.24%) Google Ads
14 24 (1.19%) Entra ID
15 23 (1.14%) GitHub Copilot
16 21 (1.04%) dbt
16 21 (1.04%) Power Automate
17 20 (0.99%) GitHub Actions
18 18 (0.89%) PowerApps
Communications & Networking
1 39 (1.94%) Network Security
1 39 (1.94%) Remote Desktop
2 31 (1.54%) Firewall
3 24 (1.19%) WAN
4 22 (1.09%) VPN
5 20 (0.99%) DNS
6 15 (0.75%) TCP/IP
6 15 (0.75%) Wi-Fi
7 14 (0.70%) LAN
8 13 (0.65%) DHCP
9 10 (0.50%) Internet
9 10 (0.50%) Wireshark
10 8 (0.40%) 5G
10 8 (0.40%) SD-WAN
10 8 (0.40%) VoIP
11 7 (0.35%) Broadband
11 7 (0.35%) Intrusion Detection
11 7 (0.35%) Wireless
12 5 (0.25%) VLAN
13 4 (0.20%) Ethernet
Database & Business Intelligence
1 203 (10.08%) Power BI
2 79 (3.92%) SQL Server
3 67 (3.33%) Tableau
4 58 (2.88%) Data Warehouse
5 34 (1.69%) Azure SQL Database
5 34 (1.69%) SQL Server Reporting Services
6 22 (1.09%) Power Query
7 21 (1.04%) MySQL
7 21 (1.04%) Relational Database
8 20 (0.99%) Metadata
9 18 (0.89%) Geospatial Data
10 14 (0.70%) BusinessObjects
10 14 (0.70%) SQL Server Integration Services
11 13 (0.65%) Crystal Reports
11 13 (0.65%) GIS
11 13 (0.65%) Oracle Reports
11 13 (0.65%) Snowflake Schema
12 12 (0.60%) Data Lake
12 12 (0.60%) Looker
13 9 (0.45%) SAP BW
Development Applications
1 81 (4.02%) JIRA
2 32 (1.59%) Git
3 16 (0.79%) GitLab
4 12 (0.60%) Selenium
5 11 (0.55%) Axure RP
5 11 (0.55%) Balsamiq
5 11 (0.55%) Cypress.io
6 9 (0.45%) Jenkins
6 9 (0.45%) Oracle Forms
7 8 (0.40%) ER Studio
7 8 (0.40%) ERwin
7 8 (0.40%) Subversion
8 7 (0.35%) WebDriver
9 6 (0.30%) Babel
9 6 (0.30%) TeamCity
9 6 (0.30%) webpack
10 5 (0.25%) Bitbucket
10 5 (0.25%) Postman
10 5 (0.25%) SQL Server Management Studio (SSMS)
11 4 (0.20%) Bazaar
General
1 791 (39.29%) Social Skills
2 566 (28.12%) Finance
3 185 (9.19%) Marketing
4 134 (6.66%) Retail
5 132 (6.56%) Public Sector
6 115 (5.71%) Inclusion and Diversity
7 97 (4.82%) Legal
8 88 (4.37%) Presentation Skills
9 86 (4.27%) Law
10 85 (4.22%) Manufacturing
10 85 (4.22%) Organisational Skills
11 63 (3.13%) Telecoms
12 53 (2.63%) Advertising
12 53 (2.63%) Influencing Skills
13 38 (1.89%) Electronics
14 35 (1.74%) Banking
15 22 (1.09%) Documentation Skills
16 21 (1.04%) Billing
16 21 (1.04%) Financial Institution
17 18 (0.89%) Automotive
Job Titles
1 548 (27.22%) Trainer
2 394 (19.57%) Analyst
3 156 (7.75%) Senior
4 120 (5.96%) Developer
5 89 (4.42%) Lead
6 82 (4.07%) Business Analyst
7 81 (4.02%) Architect
8 75 (3.73%) Consultant
9 64 (3.18%) Support Analyst
10 63 (3.13%) Data Analyst
11 59 (2.93%) Financial Analyst
12 53 (2.63%) Senior Analyst
13 46 (2.29%) 2nd Line Support
14 45 (2.24%) IT Analyst
15 41 (2.04%) Solutions Architect
16 39 (1.94%) IT Support
17 29 (1.44%) Systems Engineer
18 28 (1.39%) 1st/2nd Line Support
19 27 (1.34%) Business Intelligence Analyst
20 26 (1.29%) Security Consultant
Libraries, Frameworks & Software Standards
1 55 (2.73%) HTML
2 43 (2.14%) CSS
3 37 (1.84%) REST
4 24 (1.19%) SOAP
5 23 (1.14%) React
6 21 (1.04%) .NET
6 21 (1.04%) Middleware
7 19 (0.94%) JSON
8 18 (0.89%) OAuth
8 18 (0.89%) SAML
8 18 (0.89%) XML
9 17 (0.84%) Node.js
10 15 (0.75%) Flash
11 14 (0.70%) BAPI
11 14 (0.70%) IBM Integration Bus
11 14 (0.70%) JMS
12 13 (0.65%) Web Services
13 10 (0.50%) Sass
14 9 (0.45%) .NET Core
15 8 (0.40%) AngularJS
Miscellaneous
1 213 (10.58%) Analytical Mindset
2 138 (6.86%) Self-Motivation
3 123 (6.11%) Onboarding
4 78 (3.87%) Management Information System
5 76 (3.78%) Product Ownership
6 35 (1.74%) Algorithms
7 34 (1.69%) Virtual Team
8 31 (1.54%) Enterprise Software
8 31 (1.54%) Social Media
9 30 (1.49%) Driving Licence
9 30 (1.49%) e-Learning
10 26 (1.29%) Foreign Exchange (FX)
11 24 (1.19%) Cloud Native
12 22 (1.09%) Data Centre
12 22 (1.09%) Legacy Systems
13 19 (0.94%) Data Structures
13 19 (0.94%) Security Posture
14 17 (0.84%) Reinsurance
15 13 (0.65%) FMCG
15 13 (0.65%) Reference Data
Operating Systems
1 76 (3.78%) Windows
2 45 (2.24%) Linux
3 17 (0.84%) Unix
4 12 (0.60%) Windows Server
5 9 (0.45%) Mac OS
5 9 (0.45%) Windows 10
6 6 (0.30%) Android
7 5 (0.25%) Apple iOS
7 5 (0.25%) Mac OS X
8 3 (0.15%) OpenWrt
9 2 (0.099%) Windows Server 2016
10 1 (0.050%) OpenVMS
10 1 (0.050%) Red Hat Enterprise Linux
Processes & Methodologies
1 783 (38.90%) AI
2 705 (35.02%) Problem-Solving
3 561 (27.87%) Chemistry
4 553 (27.47%) Conversational UI
5 374 (18.58%) Continuous Improvement
6 343 (17.04%) Decision-Making
7 313 (15.55%) Analytics
8 288 (14.31%) Agile
9 281 (13.96%) Business Intelligence
10 188 (9.34%) Analytical Thinking
11 168 (8.35%) ERP
12 167 (8.30%) Project Management
13 164 (8.15%) Mentoring
14 162 (8.05%) Data Analysis
15 148 (7.35%) Actionable Insight
16 142 (7.05%) Cybersecurity
17 141 (7.00%) Stakeholder Management
18 126 (6.26%) Process Improvement
19 125 (6.21%) CRM
20 124 (6.16%) DevOps
Programming Languages
1 331 (16.44%) SQL
2 161 (8.00%) Python
3 79 (3.92%) C#
4 54 (2.68%) JavaScript
5 39 (1.94%) Java
6 33 (1.64%) Data Analysis Expressions
7 30 (1.49%) C++
7 30 (1.49%) R
8 26 (1.29%) PowerShell
9 21 (1.04%) VBA
10 15 (0.75%) C
11 14 (0.70%) TypeScript
12 12 (0.60%) T-SQL
13 8 (0.40%) Bicep
13 8 (0.40%) PHP
14 7 (0.35%) ABAP
14 7 (0.35%) Bash
14 7 (0.35%) MATLAB
15 4 (0.20%) Go
15 4 (0.20%) Groovy
Qualifications
1 886 (44.01%) Degree
2 571 (28.37%) Master's Degree
3 554 (27.52%) PhD
4 179 (8.89%) Security Cleared
5 128 (6.36%) SC Cleared
6 98 (4.87%) ACCA
7 91 (4.52%) CIMA
8 68 (3.38%) Computer Science Degree
9 67 (3.33%) CISSP
10 50 (2.48%) DV Cleared
11 40 (1.99%) CEH
12 37 (1.84%) CompTIA Security+
13 31 (1.54%) DBS Check
14 30 (1.49%) CISM
15 29 (1.44%) Microsoft Certification
16 24 (1.19%) CISA
17 20 (0.99%) BPSS Clearance
18 14 (0.70%) AAT
18 14 (0.70%) PMI Certification
19 13 (0.65%) ITIL Foundation Certificate
Quality Assurance & Compliance
1 93 (4.62%) QA
2 88 (4.37%) ISO/IEC 27001
3 74 (3.68%) Data Quality
4 64 (3.18%) GDPR
5 58 (2.88%) PMO
6 57 (2.83%) NIST
7 43 (2.14%) Accessibility
8 35 (1.74%) PCI DSS
9 20 (0.99%) GRC
10 16 (0.79%) Actionable Recommendations
11 14 (0.70%) WCAG
12 8 (0.40%) IFRS
12 8 (0.40%) SLA
13 6 (0.30%) COBIT
13 6 (0.30%) Cyber Essentials
13 6 (0.30%) ISO 9001
14 5 (0.25%) ITGC
14 5 (0.25%) SOC 2
15 4 (0.20%) GAAP
15 4 (0.20%) Sarbanes-Oxley
System Software
1 38 (1.89%) Active Directory
2 20 (0.99%) Virtual Machines
3 17 (0.84%) VMware Infrastructure
4 12 (0.60%) Docker
5 6 (0.30%) Hyper-V
5 6 (0.30%) vSphere
6 3 (0.15%) Firmware
7 1 (0.050%) BitLocker
Systems Management
1 22 (1.09%) Terraform
2 12 (0.60%) Ansible
3 10 (0.50%) Microsoft Intune
4 9 (0.45%) Kubernetes
4 9 (0.45%) Single Sign-On
5 5 (0.25%) Grafana
5 5 (0.25%) Prometheus
5 5 (0.25%) SCOM
6 4 (0.20%) Computer Incident Response Team
7 3 (0.15%) QRadar
8 1 (0.050%) Computer Emergency Response Teams
8 1 (0.050%) FortiGate
8 1 (0.050%) Jamf Pro
8 1 (0.050%) Nessus
8 1 (0.050%) RSA Archer
8 1 (0.050%) SCCM
8 1 (0.050%) ZABBIX
Vendors
1 548 (27.22%) PayPal
2 365 (18.13%) Microsoft
3 104 (5.17%) SAP
4 96 (4.77%) Google
5 53 (2.63%) Oracle
6 30 (1.49%) Salesforce
7 28 (1.39%) Databricks
7 28 (1.39%) Workday
8 25 (1.24%) ServiceNow
9 22 (1.09%) Adobe
10 21 (1.04%) VMware
11 14 (0.70%) IBM
12 13 (0.65%) Adaptive Insights
12 13 (0.65%) TikTok
13 12 (0.60%) Xero
14 11 (0.55%) Autodesk
14 11 (0.55%) Cisco
15 10 (0.50%) Ahrefs
16 9 (0.45%) Hotjar
16 9 (0.45%) Sage