Power Platform Jobs with Work from Home Options

Microsoft Power Platform
UK > Work from Home

The table below provides summary statistics for permanent job vacancies with an option to work from home (WFH) and a requirement for Power Platform skills. Included is a benchmarking guide to the salaries offered in vacancies that have cited Power Platform over the 6 months to 30 November 2023 with a comparison to the same period in the previous 2 years.

6 months to
30 Nov 2023
Same period 2022 Same period 2021
Rank 31 72 80
Rank change year-on-year +41 +8 +15
Permanent jobs citing Power Platform 1,695 2,623 2,087
As % of all permanent jobs with a WFH option 7.41% 4.72% 4.13%
As % of the Cloud Services category 15.44% 9.76% 8.01%
Number of salaries quoted 1,050 2,055 1,739
10th Percentile £36,250 £36,250 £33,200
25th Percentile £46,250 £45,000 £41,000
Median annual salary (50th Percentile) £58,000 £57,500 £52,500
Median % change year-on-year +0.87% +9.52% +5.00%
75th Percentile £75,000 £73,750 £66,250
90th Percentile £86,375 £86,250 £77,500
UK median annual salary £57,500 £57,500 £53,500
% change year-on-year - +7.48% +7.00%

All Cloud Skills
Work from Home

Power Platform is in the Cloud Services category. The following table is for comparison with the above and provides summary statistics for all permanent job vacancies with a WFH option and a requirement for cloud computing skills.

Permanent vacancies with a requirement for cloud computing skills 10,977 26,872 26,048
As % of all permanent jobs with a WFH option 48.01% 48.31% 51.52%
Number of salaries quoted 8,463 19,075 20,076
10th Percentile £36,500 £37,500 £36,250
25th Percentile £47,500 £47,500 £45,000
Median annual salary (50th Percentile) £64,500 £65,000 £60,000
Median % change year-on-year -0.77% +8.33% +9.09%
75th Percentile £82,500 £85,000 £80,000
90th Percentile £98,750 £100,000 £95,000
UK median annual salary £62,500 £63,500 £60,000
% change year-on-year -1.57% +5.83% +4.35%

Power Platform
Trend for Jobs with a WFH Option

Job vacancies with a work from home option citing Power Platform as a proportion of all IT jobs advertised.
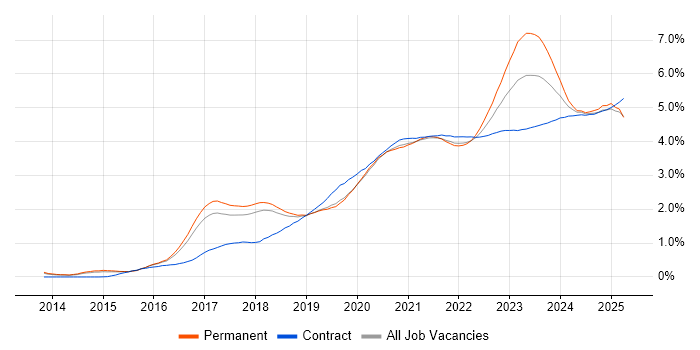
Power Platform trend for jobs with a WFH option

Power Platform
Salary Trend for Jobs with a WFH Option

3-month moving average salary quoted in job vacancies with a work from home option citing Power Platform.

Power Platform salary trend for jobs with a WFH option

Power Platform
Salary Histogram for Jobs with a WFH Option

Salary distribution for jobs with a work from home option citing Power Platform over the 6 months to 30 November 2023.

Power Platform salary histogram for jobs with a WFH option

Power Platform
Co-occurring Skills and Capabilities with WFH Options by Category

The follow tables expand on the table above by listing co-occurrences grouped by category. The same employment type, locality and period is covered with up to 20 co-occurrences shown in each of the following categories:

Application Platforms
1 150 (8.85%) SharePoint
2 54 (3.19%) Apache
3 53 (3.13%) Apache Spark
4 33 (1.95%) Confluence
5 16 (0.94%) Tomcat
6 10 (0.59%) Apache Airflow
6 10 (0.59%) IIS
7 5 (0.29%) Luigi
7 5 (0.29%) MS Exchange
8 4 (0.24%) SAS
9 3 (0.18%) Jupyter
10 2 (0.12%) Alfresco
10 2 (0.12%) Camunda
10 2 (0.12%) CMS
10 2 (0.12%) Documentum
10 2 (0.12%) FileNet
10 2 (0.12%) WordPress
11 1 (0.059%) BizTalk Server
11 1 (0.059%) Oracle Workflow
11 1 (0.059%) WebLogic
Applications
1 192 (11.33%) Microsoft Excel
2 64 (3.78%) Microsoft Office
3 29 (1.71%) Microsoft PowerPoint
4 8 (0.47%) InDesign
4 8 (0.47%) Photoshop
5 7 (0.41%) Spreadsheet
6 5 (0.29%) MS Visio
7 4 (0.24%) Chatbot
8 3 (0.18%) Microsoft Project
9 2 (0.12%) SPSS
9 2 (0.12%) Trello
Business Applications
1 370 (21.83%) Dynamics CRM
2 4 (0.24%) Dynamics NAV
2 4 (0.24%) Oracle EBS
2 4 (0.24%) Shopify
2 4 (0.24%) Siebel CRM
2 4 (0.24%) Unit4 Business World
3 3 (0.18%) Dynamics AX
3 3 (0.18%) Sparx Enterprise Architect
4 2 (0.12%) iTrent
4 2 (0.12%) Primavera
4 2 (0.12%) SAP S/4HANA
5 1 (0.059%) BusinessWorks
5 1 (0.059%) Dynamics GP
5 1 (0.059%) FastStats
5 1 (0.059%) IBM Planning Analytics
5 1 (0.059%) Oracle Applications
5 1 (0.059%) Oracle Financials
5 1 (0.059%) Salesforce CRM
5 1 (0.059%) SAP ERP
5 1 (0.059%) SAP GRC
Cloud Services
1 988 (58.29%) Azure
2 664 (39.17%) Dynamics 365
3 369 (21.77%) Azure DevOps
4 264 (15.58%) Serverless
5 247 (14.57%) Azure Functions
6 244 (14.40%) PaaS
7 242 (14.28%) SaaS
8 239 (14.10%) PowerApps
9 232 (13.69%) IaaS
10 175 (10.32%) Microsoft 365
11 134 (7.91%) Power Automate
12 119 (7.02%) GCP
13 80 (4.72%) Azure Data Factory
14 75 (4.42%) AWS
15 54 (3.19%) GitHub
16 50 (2.95%) Azure Synapse Analytics
17 49 (2.89%) GitHub Actions
18 47 (2.77%) Vertex AI
19 46 (2.71%) Azure Logic Apps
20 41 (2.42%) Snowflake
Communications & Networking
1 17 (1.00%) DNS
2 14 (0.83%) Network Security
2 14 (0.83%) TCP/IP
3 13 (0.77%) SSL
4 7 (0.41%) Firewall
4 7 (0.41%) VPN
5 6 (0.35%) IPv6
6 4 (0.24%) BGP
6 4 (0.24%) Remote Desktop
6 4 (0.24%) SD-WAN
7 3 (0.18%) DHCP
7 3 (0.18%) LAN
7 3 (0.18%) Unified Communications
7 3 (0.18%) VLAN
7 3 (0.18%) WAN
8 2 (0.12%) Extranet
8 2 (0.12%) FTP
8 2 (0.12%) HTTP
8 2 (0.12%) Intranet
9 1 (0.059%) Internet
Database & Business Intelligence
1 1,077 (63.54%) Power BI
2 249 (14.69%) SQL Server
3 239 (14.10%) Tableau
4 193 (11.39%) Data Warehouse
5 151 (8.91%) SQL Server Integration Services
6 145 (8.55%) SQL Server Reporting Services
7 110 (6.49%) Data Lake
8 92 (5.43%) Relational Database
9 83 (4.90%) MySQL
10 81 (4.78%) SQL Server Analysis Services
11 73 (4.31%) BigQuery
11 73 (4.31%) NoSQL
12 68 (4.01%) PostgreSQL
13 65 (3.83%) Big Data
14 64 (3.78%) Looker
15 58 (3.42%) Power Query
16 51 (3.01%) Bigtable
17 43 (2.54%) Azure SQL Database
18 32 (1.89%) Microsoft Analysis Services
19 30 (1.77%) Star Schema
Development Applications
1 54 (3.19%) Jenkins
2 46 (2.71%) JIRA
3 24 (1.42%) Git
4 14 (0.83%) SQL Server Management Studio (SSMS)
4 14 (0.83%) Visual Studio
5 10 (0.59%) Team Foundation Server
6 4 (0.24%) Visual Studio Code
6 4 (0.24%) Visual Website Optimizer
7 3 (0.18%) ERwin
7 3 (0.18%) RStudio
7 3 (0.18%) Selenium
8 2 (0.12%) MSBuild
8 2 (0.12%) SpecFlow
9 1 (0.059%) Atlassian Bamboo
9 1 (0.059%) Cypress.io
9 1 (0.059%) Maven
9 1 (0.059%) NUnit
9 1 (0.059%) Poetry
9 1 (0.059%) Postman
9 1 (0.059%) SonarQube
General
1 810 (47.79%) Finance
2 386 (22.77%) Social Skills
3 285 (16.81%) Analytical Skills
4 153 (9.03%) Banking
5 118 (6.96%) Marketing
5 118 (6.96%) Retail
6 75 (4.42%) Presentation Skills
7 60 (3.54%) Manufacturing
8 56 (3.30%) Public Sector
9 52 (3.07%) Inclusion and Diversity
10 49 (2.89%) Law
11 46 (2.71%) Legal
12 32 (1.89%) Influencing Skills
13 24 (1.42%) Advertising
13 24 (1.42%) Electronics
14 13 (0.77%) Organisational Skills
15 11 (0.65%) Pharmaceutical
16 9 (0.53%) Corporate Banking
17 8 (0.47%) Games
17 8 (0.47%) Local Government
Job Titles
1 489 (28.85%) Architect
2 413 (24.37%) Dynamics 365 Architect
3 326 (19.23%) Developer
4 271 (15.99%) Analyst
5 224 (13.22%) CRM Architect
6 222 (13.10%) Dynamics CRM Architect
7 183 (10.80%) Solutions Architect
8 166 (9.79%) Senior
9 151 (8.91%) Dynamics 365 Solution Architect
10 141 (8.32%) Data Engineer
11 122 (7.20%) Data Analyst
12 109 (6.43%) Lead
13 97 (5.72%) Dynamics 365 Developer
14 84 (4.96%) Business Intelligence Developer
15 75 (4.42%) Consultant
16 68 (4.01%) CRM Developer
17 64 (3.78%) Dynamics 365 CRM Developer
17 64 (3.78%) Dynamics CRM Developer
18 53 (3.13%) Power BI Developer
19 52 (3.07%) Senior Analyst
Libraries, Frameworks & Software Standards
1 185 (10.91%) .NET
2 100 (5.90%) HTML
3 87 (5.13%) CSS
4 50 (2.95%) Kafka
5 30 (1.77%) .NET Framework
6 25 (1.47%) ASP.NET
7 22 (1.30%) JSON
8 19 (1.12%) XML
9 18 (1.06%) jQuery
10 17 (1.00%) HTML5 Canvas
11 16 (0.94%) MDX
11 16 (0.94%) REST
12 15 (0.88%) RESTful
13 14 (0.83%) PySpark
14 13 (0.77%) React
15 12 (0.71%) Middleware
16 11 (0.65%) Django
16 11 (0.65%) Web Services
17 10 (0.59%) .NET Core
18 9 (0.53%) Pandas
Miscellaneous
1 55 (3.24%) Public Cloud
2 51 (3.01%) Data Structures
3 35 (2.06%) Management Information System
4 29 (1.71%) Product Ownership
5 22 (1.30%) Low-Code
6 18 (1.06%) Enterprise Software
7 17 (1.00%) Greenfield Project
8 16 (0.94%) Legacy Systems
9 15 (0.88%) Cloud Native
10 13 (0.77%) Algorithms
11 11 (0.65%) Mobile App
12 10 (0.59%) Data Centre
12 10 (0.59%) Self-Motivation
13 9 (0.53%) Analytical Mindset
13 9 (0.53%) Housing Association
13 9 (0.53%) Marketing Technology
14 8 (0.47%) iPhone
14 8 (0.47%) NHS
15 7 (0.41%) Legacy Applications
15 7 (0.41%) Pricing Data
Operating Systems
1 48 (2.83%) Windows
2 25 (1.47%) Linux
3 24 (1.42%) Unix
4 21 (1.24%) Windows Server
5 19 (1.12%) Android
6 11 (0.65%) Apple iOS
7 5 (0.29%) Mac OS
8 3 (0.18%) Windows 10
9 1 (0.059%) CentOS
9 1 (0.059%) Debian
9 1 (0.059%) Red Hat Enterprise Linux
9 1 (0.059%) Ubuntu
9 1 (0.059%) Windows Server 2012
9 1 (0.059%) Windows Server 2016
9 1 (0.059%) Windows Server 2019
Processes & Methodologies
1 889 (52.45%) Business Intelligence
2 867 (51.15%) Agile
3 525 (30.97%) Actionable Insight
4 445 (26.25%) DevOps
5 415 (24.48%) CRM
6 382 (22.54%) Analytics
7 356 (21.00%) Visualisation
8 295 (17.40%) Problem-Solving
9 289 (17.05%) Roadmaps
10 279 (16.46%) Mentoring
11 247 (14.57%) Presales
12 246 (14.51%) Requirements Gathering
13 239 (14.10%) Strategic Roadmap
14 234 (13.81%) Data Visualisation
15 233 (13.75%) ETL
16 221 (13.04%) Project Planning
17 220 (12.98%) Work Breakdown Structure
18 198 (11.68%) Customer Engagement
19 196 (11.56%) Data Analysis
20 194 (11.45%) User Acceptance Testing
Programming Languages
1 615 (36.28%) SQL
2 192 (11.33%) C#
3 186 (10.97%) Python
4 149 (8.79%) JavaScript
5 104 (6.14%) T-SQL
6 92 (5.43%) Data Analysis Expressions
7 56 (3.30%) PowerShell
8 44 (2.60%) R
9 15 (0.88%) Java
10 13 (0.77%) TypeScript
11 9 (0.53%) PL/SQL
11 9 (0.53%) VBA
12 8 (0.47%) VB.NET
12 8 (0.47%) X++
13 7 (0.41%) Scala
14 6 (0.35%) U-SQL
15 5 (0.29%) VB
15 5 (0.29%) XPath
16 4 (0.24%) PHP
16 4 (0.24%) Shell Script
Qualifications
1 201 (11.86%) Degree
2 85 (5.01%) Security Cleared
3 61 (3.60%) SC Cleared
4 41 (2.42%) Microsoft Certification
5 25 (1.47%) Computer Science Degree
6 15 (0.88%) Azure Certification
7 11 (0.65%) MCSE
8 10 (0.59%) Master's Degree
9 6 (0.35%) ACCA
10 4 (0.24%) BPSS Clearance
10 4 (0.24%) Numerate Degree
11 3 (0.18%) DV Cleared
11 3 (0.18%) ITIL Certification
11 3 (0.18%) Postgraduate
12 2 (0.12%) ITIL Foundation Certificate
12 2 (0.12%) PhD
12 2 (0.12%) PMI Certification
12 2 (0.12%) PMP
12 2 (0.12%) Tableau Certification
13 1 (0.059%) ECDL
Quality Assurance & Compliance
1 121 (7.14%) Data Quality
2 49 (2.89%) GDPR
3 38 (2.24%) SLA
4 30 (1.77%) QA
5 15 (0.88%) ISO/IEC 27001
6 12 (0.71%) PMO
7 11 (0.65%) Accessibility
8 8 (0.47%) Actionable Recommendations
9 6 (0.35%) COBIT
9 6 (0.35%) Cyber Essentials
9 6 (0.35%) WCAG
10 3 (0.18%) GMP
10 3 (0.18%) ISO 22301
10 3 (0.18%) NIST
11 2 (0.12%) GRC
System Software
1 43 (2.54%) Active Directory
2 19 (1.12%) Docker
3 9 (0.53%) VMware Infrastructure
4 8 (0.47%) Virtual Desktop
4 8 (0.47%) Virtual Machines
5 3 (0.18%) Hyper-V
6 2 (0.12%) HDFS
Systems Management
1 62 (3.66%) Terraform
2 24 (1.42%) Kubernetes
3 21 (1.24%) Microsoft Intune
4 7 (0.41%) Ansible
5 5 (0.29%) Jamf Pro
6 4 (0.24%) SysTrack
7 3 (0.18%) Active Directory Federation Services
8 2 (0.12%) Oracle Identity Management
9 1 (0.059%) Kibana
9 1 (0.059%) Nagios
9 1 (0.059%) Puppet
9 1 (0.059%) SCCM
9 1 (0.059%) SCOM
9 1 (0.059%) WSUS
Vendors
1 980 (57.82%) Microsoft
2 106 (6.25%) Google
3 53 (3.13%) Databricks
4 41 (2.42%) Oracle
5 27 (1.59%) Alteryx
6 22 (1.30%) Teradata
7 21 (1.24%) Atlassian
7 21 (1.24%) SAP
8 19 (1.12%) Adobe
8 19 (1.12%) ServiceNow
9 12 (0.71%) Salesforce
10 11 (0.65%) VMware
11 9 (0.53%) Dataiku
11 9 (0.53%) Sitecore
12 8 (0.47%) Cognos
13 7 (0.41%) Informatica
13 7 (0.41%) OpenAI
14 6 (0.35%) Criteo
15 5 (0.29%) iManage
15 5 (0.29%) Splunk