Master's Degree Jobs with Hybrid/Remote/WFH Options

Master's Degree
UK > Work from Home

The table below provides summary statistics for remote or hybrid work with a requirement for Master's Degree qualifications. It includes a benchmarking guide to the salaries offered over the 6 months leading up to 1 May 2025, comparing them to the same period in the previous two years.

6 months to
1 May 2025
Same period 2024 Same period 2023
Rank 76 269 245
Rank change year-on-year +193 -24 +33
Permanent jobs citing Master's Degree 538 390 571
As % of all permanent jobs with a WFH option 3.60% 1.15% 1.34%
As % of the Qualifications category 11.44% 4.11% 5.25%
Number of salaries quoted 158 231 319
10th Percentile - £35,000 £42,500
25th Percentile £45,000 £47,250 £50,329
Median annual salary (50th Percentile) £60,000 £62,500 £62,500
Median % change year-on-year -4.00% - -7.41%
75th Percentile £74,721 £81,250 £86,250
90th Percentile £95,000 £107,500 £110,500
UK median annual salary £69,315 £65,000 £62,500
% change year-on-year +6.64% +4.00% -10.71%

All Academic and Professional Certifications
Work from Home

Master's Degree falls under the Academic Qualifications and Professional Certifications category. For comparison with the information above, the following table provides summary statistics for all permanent job vacancies with remote or hybrid options requiring academic qualifications or professional certifications.

Permanent vacancies requiring academic qualifications or professional certifications 4,703 9,496 10,878
As % of all permanent jobs with a WFH option 31.45% 28.06% 25.44%
Number of salaries quoted 3,034 5,942 6,655
10th Percentile £31,250 £32,500 £35,000
25th Percentile £46,777 £42,500 £45,000
Median annual salary (50th Percentile) £55,000 £57,000 £60,000
Median % change year-on-year -3.51% -5.00% +0.45%
75th Percentile £70,600 £72,500 £77,715
90th Percentile £85,000 £87,500 £95,000
UK median annual salary £55,000 £54,000 £58,000
% change year-on-year +1.85% -6.90% +5.45%

Master's Degree
Trend for Jobs with a WFH Option

Job vacancies with remote working options citing Master's Degree as a proportion of all IT jobs advertised.
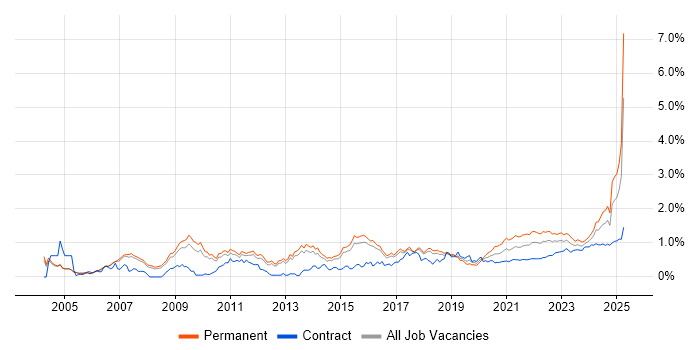
Master's Degree trend for jobs with Hybrid/Remote/WFH options

Master's Degree
Salary Trend for Jobs with a WFH Option

3-month moving average salary quoted in job vacancies with remote working options citing Master's Degree.

Master's Degree salary trend for jobs with a WFH option

Master's Degree
Salary Histogram for Jobs with a WFH Option

Salary distribution for jobs with remote working options citing Master's Degree over the 6 months to 1 May 2025.

Master's Degree salary histogram for jobs with a WFH option

Master's Degree
Co-occurring Skills and Capabilities with WFH Options by Category

The follow tables expand on the table above by listing co-occurrences grouped by category. The same employment type, locality and period is covered with up to 20 co-occurrences shown in each of the following categories:

Application Platforms
1 5 (0.93%) Apache Airflow
1 5 (0.93%) Apache Spark
1 5 (0.93%) SharePoint
2 4 (0.74%) SAS
3 3 (0.56%) Jupyter
4 2 (0.37%) ArcGIS
5 1 (0.19%) CMS
5 1 (0.19%) Confluence
Applications
1 299 (55.58%) Chatbot
2 4 (0.74%) Microsoft Project
3 3 (0.56%) Microsoft Excel
Business Applications
1 3 (0.56%) SAP S/4HANA
2 2 (0.37%) SAP ERP
Cloud Services
1 44 (8.18%) Azure
2 33 (6.13%) AWS
3 23 (4.28%) GCP
4 11 (2.04%) Power Platform
5 10 (1.86%) Cloud Computing
5 10 (1.86%) GitHub
6 8 (1.49%) Adobe Analytics
6 8 (1.49%) Azure Synapse Analytics
6 8 (1.49%) Snowflake
7 6 (1.12%) Dialogflow
8 5 (0.93%) Azure Data Factory
8 5 (0.93%) SaaS
9 4 (0.74%) Serverless
10 3 (0.56%) Amazon EC2
10 3 (0.56%) AWS Lambda
10 3 (0.56%) Microsoft 365
10 3 (0.56%) Microsoft Copilot
10 3 (0.56%) PowerApps
10 3 (0.56%) Prefect
11 2 (0.37%) GitHub Actions
Communications & Networking
1 5 (0.93%) Network Security
2 4 (0.74%) Firewall
3 3 (0.56%) VPN
4 2 (0.37%) Ethernet
5 1 (0.19%) Intranet
5 1 (0.19%) RS-485
5 1 (0.19%) TCP/IP
5 1 (0.19%) ZigBee
Database & Business Intelligence
1 31 (5.76%) Tableau
2 20 (3.72%) Relational Database
3 12 (2.23%) PostgreSQL
4 11 (2.04%) Power BI
4 11 (2.04%) SQL Server
5 9 (1.67%) Data Lake
5 9 (1.67%) NoSQL
6 8 (1.49%) Hadoop
7 7 (1.30%) MySQL
8 6 (1.12%) Metadata
9 5 (0.93%) Amazon Redshift
9 5 (0.93%) Data Warehouse
10 4 (0.74%) Apache Hive
10 4 (0.74%) Azure SQL Data Warehouse
10 4 (0.74%) BigQuery
10 4 (0.74%) Enterprise Data Warehouse
10 4 (0.74%) Neo4j
10 4 (0.74%) RDBMS
10 4 (0.74%) SAP BW
10 4 (0.74%) SAP HANA
Development Applications
1 32 (5.95%) Git
2 8 (1.49%) Moq
2 8 (1.49%) SpecFlow
3 6 (1.12%) Jenkins
4 5 (0.93%) JIRA
4 5 (0.93%) MLflow
5 3 (0.56%) GitLab
6 2 (0.37%) Ant
6 2 (0.37%) Babel
6 2 (0.37%) TeamCity
6 2 (0.37%) webpack
7 1 (0.19%) Cypress.io
7 1 (0.19%) git-flow
7 1 (0.19%) Selenium
7 1 (0.19%) WebDriver
General
1 205 (38.10%) Analytical Skills
2 77 (14.31%) Social Skills
3 71 (13.20%) Finance
4 55 (10.22%) Banking
5 48 (8.92%) Legal
6 34 (6.32%) Inclusion and Diversity
7 23 (4.28%) Presentation Skills
8 19 (3.53%) Public Sector
9 17 (3.16%) Law
10 16 (2.97%) Retail
11 15 (2.79%) Agriculture
11 15 (2.79%) Manufacturing
12 11 (2.04%) Marketing
13 10 (1.86%) Aerospace
13 10 (1.86%) Pharmaceutical
13 10 (1.86%) Telecoms
14 7 (1.30%) Electronics
15 4 (0.74%) Front Office
15 4 (0.74%) Organisational Skills
16 3 (0.56%) Public Speaking
Job Titles
1 302 (56.13%) Trainer
2 51 (9.48%) Analyst
3 48 (8.92%) Senior
4 40 (7.43%) Graduate
5 33 (6.13%) Software Engineer
6 26 (4.83%) Data Analyst
7 20 (3.72%) Developer
8 19 (3.53%) Data Scientist
9 16 (2.97%) Data Science Graduate
10 15 (2.79%) Research Scientist
10 15 (2.79%) Senior Software Engineer
11 12 (2.23%) Biostatistician
12 11 (2.04%) Data Engineer
13 10 (1.86%) Senior Developer
14 9 (1.67%) Lead
14 9 (1.67%) Principal Data Scientist
14 9 (1.67%) Principal Engineer
14 9 (1.67%) Senior Data Scientist
15 8 (1.49%) Data Insight Analyst
15 8 (1.49%) Insight Data Analyst
Libraries, Frameworks & Software Standards
1 25 (4.65%) TensorFlow
2 22 (4.09%) .NET
3 19 (3.53%) scikit-learn
4 16 (2.97%) PyTorch
5 15 (2.79%) REST
6 14 (2.60%) Pandas
7 13 (2.42%) .NET Framework
8 11 (2.04%) .NET Core
8 11 (2.04%) Entity Framework
9 10 (1.86%) CSS
9 10 (1.86%) HTML
9 10 (1.86%) PySpark
10 8 (1.49%) Hugging Face
10 8 (1.49%) OAuth
10 8 (1.49%) OAuth2
10 8 (1.49%) Swagger
11 6 (1.12%) FHIR
11 6 (1.12%) NLTK
11 6 (1.12%) React
11 6 (1.12%) SpaCy
Miscellaneous
1 52 (9.67%) Algorithms
2 37 (6.88%) Learning Management System
3 25 (4.65%) Credit Risk
4 17 (3.16%) Hackathon
4 17 (3.16%) Management Information System
4 17 (3.16%) Mobile App
5 14 (2.60%) Self-Motivation
6 13 (2.42%) Robotics
7 10 (1.86%) Molecular Biology
8 8 (1.49%) Enterprise Software
9 7 (1.30%) Data Structures
10 6 (1.12%) Virtual Team
11 5 (0.93%) Derivative
12 4 (0.74%) Cloud Native
12 4 (0.74%) Life Science
12 4 (0.74%) Renewable Energy
13 3 (0.56%) Cyber Threat
13 3 (0.56%) Distributed Computing
13 3 (0.56%) Distributed Systems
13 3 (0.56%) Product Ownership
Operating Systems
1 16 (2.97%) Linux
2 10 (1.86%) Unix
3 9 (1.67%) Robot Operating System
4 5 (0.93%) Windows
5 2 (0.37%) Mac OS
6 1 (0.19%) Ubuntu
Processes & Methodologies
1 367 (68.22%) Artificial Intelligence
2 299 (55.58%) Conversational UI
3 197 (36.62%) Computer Science
4 190 (35.32%) Mathematics
5 132 (24.54%) Chemistry
6 120 (22.30%) Statistics
7 93 (17.29%) Physics
8 88 (16.36%) Problem-Solving
9 83 (15.43%) Agile
10 81 (15.06%) Data Science
11 77 (14.31%) Software Engineering
12 65 (12.08%) Analytics
13 64 (11.90%) Machine Learning
14 53 (9.85%) Visualisation
15 45 (8.36%) Decision-Making
16 43 (7.99%) DevOps
17 42 (7.81%) Mentoring
18 38 (7.06%) Data Analytics
19 34 (6.32%) Business Intelligence
20 32 (5.95%) Data Visualisation
Programming Languages
1 134 (24.91%) Python
2 70 (13.01%) SQL
3 40 (7.43%) C#
4 29 (5.39%) Java
4 29 (5.39%) JavaScript
5 22 (4.09%) C++
6 18 (3.35%) Kotlin
7 12 (2.23%) C
8 11 (2.04%) Bash
8 11 (2.04%) Fortran
8 11 (2.04%) TypeScript
9 4 (0.74%) PL/SQL
9 4 (0.74%) PowerShell
10 3 (0.56%) R
10 3 (0.56%) VBA
11 2 (0.37%) Go
11 2 (0.37%) MATLAB
11 2 (0.37%) Scala
12 1 (0.19%) JCL
12 1 (0.19%) SPARQL
Qualifications
1 538 (100.00%) Degree
2 371 (68.96%) PhD
3 53 (9.85%) Computer Science Degree
4 27 (5.02%) Security Cleared
5 20 (3.72%) SC Cleared
6 18 (3.35%) DBS Check
7 10 (1.86%) DV Cleared
7 10 (1.86%) HNC
8 8 (1.49%) PMI Certification
8 8 (1.49%) PMP
9 7 (1.30%) Azure Certification
10 6 (1.12%) MBA
10 6 (1.12%) SAP Certification
11 4 (0.74%) Chartered Engineer
11 4 (0.74%) Cisco Certification
11 4 (0.74%) CISM
11 4 (0.74%) CISSP
12 3 (0.56%) AWS Certification
12 3 (0.56%) BPSS Clearance
12 3 (0.56%) HND
Quality Assurance & Compliance
1 15 (2.79%) Accessibility
2 10 (1.86%) QA
3 8 (1.49%) Data Quality
4 6 (1.12%) CDISC
5 5 (0.93%) GDPR
6 3 (0.56%) ISO/IEC 27001
6 3 (0.56%) NIST
7 2 (0.37%) 21 CFR Part 11
7 2 (0.37%) GMP
7 2 (0.37%) HIPAA
7 2 (0.37%) ISO 9001
7 2 (0.37%) NIST 800
8 1 (0.19%) Actionable Recommendations
8 1 (0.19%) California Consumer Privacy Act
8 1 (0.19%) NCSC
System Software
1 17 (3.16%) Docker
2 4 (0.74%) HDFS
3 2 (0.37%) Active Directory
3 2 (0.37%) Firmware
3 2 (0.37%) Virtual Machines
Systems Management
1 10 (1.86%) Kubernetes
1 10 (1.86%) Terraform
2 2 (0.37%) Grafana
2 2 (0.37%) Prometheus
3 1 (0.19%) Single Sign-On
Vendors
1 293 (54.46%) PayPal
2 46 (8.55%) Microsoft
3 35 (6.51%) Google
4 33 (6.13%) Databricks
5 23 (4.28%) SAP
6 18 (3.35%) IBM
7 9 (1.67%) Teradata
8 8 (1.49%) Adobe
9 7 (1.30%) Omniture
10 5 (0.93%) Oracle
10 5 (0.93%) Salesforce
11 3 (0.56%) Facebook
11 3 (0.56%) Salesforce Marketing Cloud
11 3 (0.56%) YouTube
12 1 (0.19%) Broadcom
12 1 (0.19%) CrowdStrike
12 1 (0.19%) Darktrace
12 1 (0.19%) FactSet
12 1 (0.19%) Freescale
12 1 (0.19%) Sparx