SC Cleared Jobs with Hybrid/Remote/WFH Options

Security Check (SC) Clearance
UK > Work from Home

The table below provides summary statistics for remote or hybrid work with a requirement for SC Cleared qualifications. It includes a benchmarking guide to the salaries offered over the 6 months leading up to 19 July 2025, comparing them to the same period in the previous two years.

6 months to
19 Jul 2025
Same period 2024 Same period 2023
Rank 130 42 31
Rank change year-on-year -88 -11 +85
Permanent jobs citing SC Cleared 573 1,695 2,676
As % of all permanent jobs with a WFH option 2.70% 5.40% 7.84%
As % of the Qualifications category 7.36% 19.36% 28.90%
Number of salaries quoted 368 996 1,214
10th Percentile £45,000 £40,000 £39,650
25th Percentile £51,938 £48,750 £47,500
Median annual salary (50th Percentile) £65,000 £60,000 £65,000
Median % change year-on-year +8.33% -7.69% +4.00%
75th Percentile £80,000 £73,750 £78,750
90th Percentile £91,100 £88,775 £86,168
UK median annual salary £60,000 £57,000 £62,500
% change year-on-year +5.26% -8.80% +12.61%

All Academic and Professional Certifications
Work from Home

SC Cleared falls under the Academic Qualifications and Professional Certifications category. For comparison with the information above, the following table provides summary statistics for all permanent job vacancies with remote or hybrid options requiring academic qualifications or professional certifications.

Permanent vacancies requiring academic qualifications or professional certifications 7,789 8,753 9,259
As % of all permanent jobs with a WFH option 36.72% 27.88% 27.14%
Number of salaries quoted 3,141 5,182 5,756
10th Percentile £31,250 £32,500 £35,000
25th Percentile £47,500 £42,500 £45,000
Median annual salary (50th Percentile) £58,000 £57,500 £60,000
Median % change year-on-year +0.87% -4.17% +2.64%
75th Percentile £72,500 £72,500 £77,500
90th Percentile £87,500 £86,000 £95,000
UK median annual salary £55,000 £54,995 £60,000
% change year-on-year +0.01% -8.34% +9.09%

SC Cleared
Trend for Jobs with a WFH Option

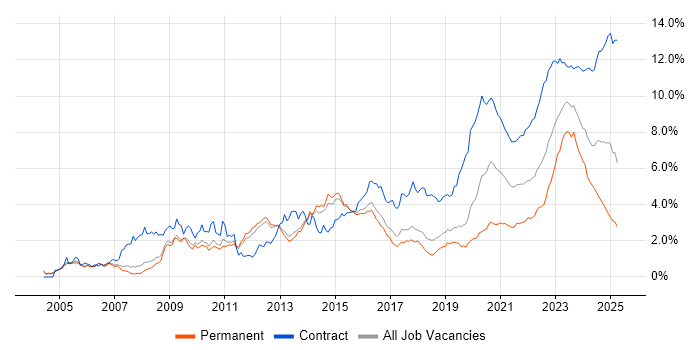
Job vacancies with remote working options citing SC Cleared as a proportion of all IT jobs advertised.

SC Cleared trend for jobs with Hybrid/Remote/WFH options

SC Cleared
Salary Trend for Jobs with a WFH Option

3-month moving average salary quoted in job vacancies with remote working options citing SC Cleared.

SC Cleared salary trend for jobs with a WFH option

SC Cleared
Salary Histogram for Jobs with a WFH Option

Salary distribution for jobs with remote working options citing SC Cleared over the 6 months to 19 July 2025.

SC Cleared salary histogram for jobs with a WFH option

SC Cleared
Co-occurring Skills and Capabilities with WFH Options by Category

The follow tables expand on the table above by listing co-occurrences grouped by category. The same employment type, locality and period is covered with up to 20 co-occurrences shown in each of the following categories:

Application Platforms
1 10 (1.75%) SharePoint
2 7 (1.22%) Confluence
2 7 (1.22%) Microsoft Exchange
3 6 (1.05%) Appian
4 2 (0.35%) nginx
4 2 (0.35%) Oracle Workflow
5 1 (0.17%) Apache Spark
5 1 (0.17%) Drupal
5 1 (0.17%) WordPress
Applications
1 17 (2.97%) Microsoft Office
2 8 (1.40%) Adobe XD
3 5 (0.87%) Microsoft Excel
4 4 (0.70%) Microsoft PowerPoint
4 4 (0.70%) MS Visio
5 3 (0.52%) Simulink
6 2 (0.35%) Microsoft Project
6 2 (0.35%) Oracle Smart View
6 2 (0.35%) Spreadsheet
7 1 (0.17%) Chatbot
7 1 (0.17%) InVision
7 1 (0.17%) Revit
7 1 (0.17%) Sketch
Business Applications
1 29 (5.06%) Sparx Enterprise Architect
2 14 (2.44%) SAP S/4HANA
3 3 (0.52%) Oracle ERP
3 3 (0.52%) SAP BPC
4 2 (0.35%) Oracle Assets
4 2 (0.35%) Oracle Cash Management
4 2 (0.35%) Oracle Financials
4 2 (0.35%) Oracle General Ledger
4 2 (0.35%) Oracle Payables
4 2 (0.35%) Oracle Receivables
4 2 (0.35%) Sage 200
4 2 (0.35%) SAP CO
4 2 (0.35%) SAP FI
4 2 (0.35%) SAP FI/CO
5 1 (0.17%) SAP GRC
5 1 (0.17%) SAP LE
5 1 (0.17%) SAP MM
5 1 (0.17%) SAP Oil and Gas
5 1 (0.17%) SAP PM
5 1 (0.17%) Workday HCM
Cloud Services
1 134 (23.39%) Azure
2 119 (20.77%) AWS
3 38 (6.63%) Microsoft 365
4 36 (6.28%) Entra ID
5 32 (5.58%) GCP
6 31 (5.41%) Power Platform
7 29 (5.06%) AWS CloudFormation
7 29 (5.06%) Azure DevOps
8 20 (3.49%) Serverless
9 19 (3.32%) Dynamics 365
10 18 (3.14%) AWS Lambda
11 16 (2.79%) Amazon ECS
12 12 (2.09%) dbt
12 12 (2.09%) Power Automate
13 11 (1.92%) Amazon ECR
13 11 (1.92%) Amazon ElastiCache
13 11 (1.92%) Amazon OpenSearch
13 11 (1.92%) AWS CodeBuild
13 11 (1.92%) Cloud Computing
13 11 (1.92%) Pulumi
Communications & Networking
1 35 (6.11%) Wireless
2 34 (5.93%) Network Security
3 32 (5.58%) Software-Defined Radio
4 30 (5.24%) Firewall
5 26 (4.54%) TCP/IP
5 26 (4.54%) VPN
6 22 (3.84%) WAN
7 19 (3.32%) LAN
8 15 (2.62%) Wi-Fi
9 14 (2.44%) DNS
10 13 (2.27%) BGP
11 12 (2.09%) Junos
11 12 (2.09%) OSPF
12 9 (1.57%) VLAN
13 7 (1.22%) Cisco ASA
13 7 (1.22%) DHCP
13 7 (1.22%) IPsec
13 7 (1.22%) SD-WAN
14 6 (1.05%) Internet
14 6 (1.05%) SMTP
Database & Business Intelligence
1 27 (4.71%) PostgreSQL
2 21 (3.66%) Power BI
3 19 (3.32%) MongoDB
4 16 (2.79%) Amazon RDS
5 13 (2.27%) Redis
6 12 (2.09%) Elasticsearch
7 8 (1.40%) MySQL
7 8 (1.40%) NoSQL
8 7 (1.22%) SQL Server
9 3 (0.52%) Big Data
9 3 (0.52%) Data Warehouse
9 3 (0.52%) Metadata
9 3 (0.52%) Pentaho
9 3 (0.52%) Relational Database
10 2 (0.35%) Amazon Aurora
10 2 (0.35%) DB2
10 2 (0.35%) Metadata Repository
10 2 (0.35%) Oracle Exadata
10 2 (0.35%) Triplestore
11 1 (0.17%) RDBMS
Development Applications
1 34 (5.93%) Git
2 16 (2.79%) Jenkins
3 13 (2.27%) GitLab
4 10 (1.75%) JIRA
5 8 (1.40%) Selenium
6 7 (1.22%) Axure RP
6 7 (1.22%) Balsamiq
6 7 (1.22%) JMeter
7 5 (0.87%) Cypress.io
7 5 (0.87%) JUnit
8 4 (0.70%) Babel
8 4 (0.70%) Mockito
8 4 (0.70%) Subversion
8 4 (0.70%) TeamCity
8 4 (0.70%) webpack
9 3 (0.52%) Gatling
9 3 (0.52%) LabVIEW
9 3 (0.52%) Locust
9 3 (0.52%) Postman
10 2 (0.35%) REST Assured
General
1 171 (29.84%) Social Skills
2 169 (29.49%) Finance
3 103 (17.98%) Public Sector
4 68 (11.87%) Analytical Skills
5 62 (10.82%) Inclusion and Diversity
6 24 (4.19%) Law
7 17 (2.97%) Presentation Skills
8 16 (2.79%) Back Office
9 14 (2.44%) Marketing
10 11 (1.92%) Influencing Skills
11 10 (1.75%) Aerospace
11 10 (1.75%) Manufacturing
12 9 (1.57%) Legal
13 8 (1.40%) Electronics
13 8 (1.40%) Retail
14 7 (1.22%) Military
14 7 (1.22%) Telecoms
15 6 (1.05%) Tech for Good
16 5 (0.87%) Documentation Skills
16 5 (0.87%) Local Government
Job Titles
1 96 (16.75%) Architect
2 88 (15.36%) Senior
3 63 (10.99%) Systems Engineer
4 61 (10.65%) Developer
5 46 (8.03%) Consultant
6 44 (7.68%) Lead
7 40 (6.98%) Software Engineer
8 35 (6.11%) Embedded Engineer
9 31 (5.41%) Embedded Software Engineer
10 26 (4.54%) Solutions Architect
11 24 (4.19%) Administrator
11 24 (4.19%) Systems Administrator
12 22 (3.84%) Senior Consultant
12 22 (3.84%) Senior Developer
13 21 (3.66%) Security Architect
14 19 (3.32%) Analyst
15 16 (2.79%) Desktop Support
15 16 (2.79%) Desktop Support Technician
15 16 (2.79%) Desktop Technician
15 16 (2.79%) Support Technician
Libraries, Frameworks & Software Standards
1 24 (4.19%) Kafka
2 20 (3.49%) Node.js
3 19 (3.32%) React
4 15 (2.62%) Django
4 15 (2.62%) Elastic Stack
5 14 (2.44%) HTML
5 14 (2.44%) RESTful
6 12 (2.09%) .NET
7 11 (1.92%) CSS
7 11 (1.92%) SAP Fiori
8 8 (1.40%) AngularJS
9 7 (1.22%) REST
9 7 (1.22%) SOAP
9 7 (1.22%) Spring
10 6 (1.05%) PySpark
11 5 (0.87%) Spring Boot
12 4 (0.70%) CSS3
12 4 (0.70%) HTML5
12 4 (0.70%) HTML5 Canvas
12 4 (0.70%) Sass
Miscellaneous
1 111 (19.37%) e-Learning
2 38 (6.63%) Data Centre
3 33 (5.76%) MicroBlaze
4 31 (5.41%) Embedded Systems
5 29 (5.06%) RISC-V
6 24 (4.19%) Management Information System
7 17 (2.97%) Cloud Native
7 17 (2.97%) Product Ownership
8 16 (2.79%) FPGA
8 16 (2.79%) Hybrid Cloud
9 13 (2.27%) Security Posture
10 12 (2.09%) Self-Motivation
11 11 (1.92%) NHS
12 10 (1.75%) Distributed Systems
13 9 (1.57%) Onboarding
14 8 (1.40%) Housing Association
15 7 (1.22%) Algorithms
16 6 (1.05%) PKI
16 6 (1.05%) Virtual Team
17 5 (0.87%) Greenfield Project
Operating Systems
1 104 (18.15%) Linux
2 57 (9.95%) Windows
3 29 (5.06%) Embedded Linux
4 28 (4.89%) Unix
5 19 (3.32%) Windows 10
6 18 (3.14%) Windows Server
7 10 (1.75%) Windows Server 2019
8 6 (1.05%) Rocky
9 5 (0.87%) Android
10 4 (0.70%) CentOS
10 4 (0.70%) HPUX
10 4 (0.70%) Oracle Linux
10 4 (0.70%) Red Hat Enterprise Linux
10 4 (0.70%) Solaris
11 3 (0.52%) Windows Server 2016
12 1 (0.17%) Apple iOS
Processes & Methodologies
1 141 (24.61%) Agile
2 112 (19.55%) Innovative Thinking
3 90 (15.71%) DevOps
4 79 (13.79%) Problem-Solving
5 77 (13.44%) Cybersecurity
6 76 (13.26%) Software Engineering
7 73 (12.74%) CI/CD
8 59 (10.30%) Continuous Improvement
8 59 (10.30%) Mentoring
9 51 (8.90%) Analytics
10 46 (8.03%) Computer Science
10 46 (8.03%) High Availability
11 42 (7.33%) Systems Engineering
12 41 (7.16%) Technical Leadership
13 39 (6.81%) TOGAF
14 36 (6.28%) Containerisation
14 36 (6.28%) Digital Signal Processing
14 36 (6.28%) Signal Processing
15 35 (6.11%) SDLC
15 35 (6.11%) UML
Programming Languages
1 58 (10.12%) Python
2 45 (7.85%) Java
2 45 (7.85%) JavaScript
3 41 (7.16%) SQL
4 37 (6.46%) C
4 37 (6.46%) C++
5 21 (3.66%) C#
5 21 (3.66%) TypeScript
6 13 (2.27%) PowerShell
7 11 (1.92%) Bash
8 6 (1.05%) Ruby
9 5 (0.87%) Go
10 4 (0.70%) Kotlin
10 4 (0.70%) MATLAB
10 4 (0.70%) X++
11 3 (0.52%) R
11 3 (0.52%) Shell Script
11 3 (0.52%) SPARQL
12 2 (0.35%) Scala
12 2 (0.35%) VBA
Qualifications
1 573 (100.00%) Security Cleared
2 135 (23.56%) Degree
3 91 (15.88%) DV Cleared
4 54 (9.42%) Cisco Certification
5 44 (7.68%) AWS Certification
5 44 (7.68%) CCNP
6 37 (6.46%) Computer Science Degree
7 25 (4.36%) CCNA
8 21 (3.66%) CISSP
9 18 (3.14%) Azure Certification
9 18 (3.14%) CTC Cleared
9 18 (3.14%) RHCSA
10 17 (2.97%) BPSS Clearance
11 15 (2.62%) AWS Certified Solutions Architect
11 15 (2.62%) TOGAF Certification
12 14 (2.44%) CISM
13 10 (1.75%) Microsoft Certification
14 9 (1.57%) JNCIA
15 8 (1.40%) CompTIA Security+
15 8 (1.40%) Network+ Certification
Quality Assurance & Compliance
1 29 (5.06%) ISO/IEC 27001
1 29 (5.06%) QA
2 26 (4.54%) NIST
3 22 (3.84%) GDPR
4 21 (3.66%) NCSC
4 21 (3.66%) SLA
5 18 (3.14%) Accessibility
6 11 (1.92%) HIPAA
7 8 (1.40%) Def Stans
7 8 (1.40%) WCAG
8 4 (0.70%) JSP 440
8 4 (0.70%) RMADS
9 3 (0.52%) ISO 9001
10 2 (0.35%) AQAP
10 2 (0.35%) Dublin Core
10 2 (0.35%) GRC
10 2 (0.35%) ISO 22301
10 2 (0.35%) Software Quality Assurance
11 1 (0.17%) Cyber Essentials
11 1 (0.17%) SOC 2
System Software
1 50 (8.73%) Docker
2 40 (6.98%) Firmware
3 33 (5.76%) Embedded Firmware
4 24 (4.19%) Active Directory
5 11 (1.92%) VMware Infrastructure
6 9 (1.57%) Hyper-V
7 5 (0.87%) vSphere
8 4 (0.70%) Virtual Machines
9 3 (0.52%) IAG
10 2 (0.35%) Virtual Desktop
10 2 (0.35%) VMware ESXi
11 1 (0.17%) pfSense
11 1 (0.17%) Virtual Servers
Systems Management
1 48 (8.38%) Terraform
2 47 (8.20%) Kubernetes
3 20 (3.49%) Ansible
4 17 (2.97%) Grafana
5 16 (2.79%) Prometheus
6 11 (1.92%) AWS Copilot
7 5 (0.87%) Active Directory Federation Services
7 5 (0.87%) Microsoft Intune
8 4 (0.70%) FortiGate
8 4 (0.70%) Kibana
9 3 (0.52%) Argo
9 3 (0.52%) Computer Emergency Response Teams
9 3 (0.52%) Nagios
9 3 (0.52%) Single Sign-On
10 2 (0.35%) Failover Clustering
10 2 (0.35%) HAProxy
10 2 (0.35%) Iperf
10 2 (0.35%) Puppet
10 2 (0.35%) SCCM
10 2 (0.35%) vCenter Server
Vendors
1 72 (12.57%) Microsoft
2 69 (12.04%) Cisco
3 30 (5.24%) Sparx
3 30 (5.24%) VMware
4 21 (3.66%) SAP
5 20 (3.49%) Google
6 18 (3.14%) Red Hat
7 17 (2.97%) Juniper
8 15 (2.62%) Oracle
9 14 (2.44%) ServiceNow
10 10 (1.75%) Fortinet
11 8 (1.40%) Adobe
12 7 (1.22%) Dell
13 6 (1.05%) Splunk
14 5 (0.87%) CheckPoint
14 5 (0.87%) Salesforce
15 4 (0.70%) Palo Alto
15 4 (0.70%) Samsung
15 4 (0.70%) SolarWinds
16 3 (0.52%) Thales