Roadmaps Jobs with Work from Home Options

Roadmaps
UK > Work from Home

The table below provides summary statistics for permanent job vacancies with an option to work from home (WFH) and a requirement for Roadmaps skills. Included is a benchmarking guide to the salaries offered in vacancies that have cited Roadmaps over the 6 months to 2 December 2023 with a comparison to the same period in the previous 2 years.

6 months to
2 Dec 2023
Same period 2022 Same period 2021
Rank 32 22 35
Rank change year-on-year -10 +13 +11
Permanent jobs citing Roadmaps 1,664 5,687 4,009
As % of all permanent jobs with a WFH option 7.36% 10.34% 7.91%
As % of the Processes & Methodologies category 7.72% 10.76% 8.24%
Number of salaries quoted 1,111 3,398 2,976
10th Percentile £51,716 £46,250 £42,633
25th Percentile £60,250 £55,000 £52,500
Median annual salary (50th Percentile) £75,000 £71,500 £70,000
Median % change year-on-year +4.90% +2.14% +12.00%
75th Percentile £96,539 £90,000 £87,500
90th Percentile £115,000 £106,250 £112,500
UK median annual salary £75,000 £72,500 £70,000
% change year-on-year +3.45% +3.57% +7.69%

All Process and Methodology Skills
Work from Home

Roadmaps is in the Processes and Methodologies category. The following table is for comparison with the above and provides summary statistics for all permanent job vacancies with a WFH option and a requirement for process or methodology skills.

Permanent vacancies with a requirement for process or methodology skills 21,556 52,864 48,661
As % of all permanent jobs with a WFH option 95.41% 96.15% 96.05%
Number of salaries quoted 15,787 36,766 36,291
10th Percentile £36,500 £37,500 £35,745
25th Percentile £46,306 £47,500 £43,750
Median annual salary (50th Percentile) £62,500 £62,500 £60,000
Median % change year-on-year - +4.17% +9.09%
75th Percentile £80,250 £81,250 £77,500
90th Percentile £97,500 £97,500 £93,250
UK median annual salary £60,000 £60,000 £60,000
% change year-on-year - - +9.09%

Roadmaps
Trend for Jobs with a WFH Option

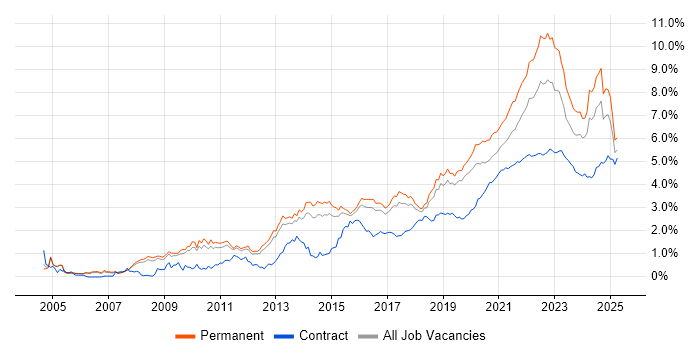
Job vacancies with a work from home option citing Roadmaps as a proportion of all IT jobs advertised.

Roadmaps trend for jobs with a WFH option

Roadmaps
Salary Trend for Jobs with a WFH Option

3-month moving average salary quoted in job vacancies with a work from home option citing Roadmaps.

Roadmaps salary trend for jobs with a WFH option

Roadmaps
Salary Histogram for Jobs with a WFH Option

Salary distribution for jobs with a work from home option citing Roadmaps over the 6 months to 2 December 2023.

Roadmaps salary histogram for jobs with a WFH option

Roadmaps
Co-occurring Skills and Capabilities with WFH Options by Category

The follow tables expand on the table above by listing co-occurrences grouped by category. The same employment type, locality and period is covered with up to 20 co-occurrences shown in each of the following categories:

Application Platforms
1 41 (2.46%) SharePoint
2 20 (1.20%) Confluence
3 8 (0.48%) nginx
4 6 (0.36%) CMS
5 5 (0.30%) Apache Spark
6 4 (0.24%) Oracle SOA Suite
7 2 (0.12%) Alfresco
7 2 (0.12%) Apache
7 2 (0.12%) Camunda
7 2 (0.12%) Documentum
7 2 (0.12%) FileNet
7 2 (0.12%) Hedera
7 2 (0.12%) Oracle Workflow
7 2 (0.12%) WebLogic
8 1 (0.060%) IIS
8 1 (0.060%) MS Exchange
8 1 (0.060%) SharePoint 2010
8 1 (0.060%) SharePoint 2013
8 1 (0.060%) WebSphere
8 1 (0.060%) WordPress
Applications
1 26 (1.56%) Microsoft Office
2 17 (1.02%) Microsoft Excel
3 13 (0.78%) Microsoft Project
4 11 (0.66%) Chatbot
5 7 (0.42%) Microsoft PowerPoint
5 7 (0.42%) Simulink
6 6 (0.36%) MS Visio
7 2 (0.12%) Adobe Creative Suite
7 2 (0.12%) InVision
7 2 (0.12%) Sketch
8 1 (0.060%) CANalyzer
8 1 (0.060%) Oracle Smart View
8 1 (0.060%) Spreadsheet
8 1 (0.060%) Trello
Business Applications
1 239 (14.36%) Dynamics CRM
2 30 (1.80%) SAP S/4HANA
3 29 (1.74%) Unit4 Business World
4 25 (1.50%) Endur
5 9 (0.54%) SAP CO
5 9 (0.54%) SAP FI
5 9 (0.54%) SAP FI/CO
6 6 (0.36%) SAP Business One
7 5 (0.30%) SAP BPC
8 4 (0.24%) Oracle EBS
8 4 (0.24%) SAP MDG
8 4 (0.24%) SAP WM
9 3 (0.18%) IBM Planning Analytics
9 3 (0.18%) Oracle Procure-to-Pay
9 3 (0.18%) SAP CRM
9 3 (0.18%) SAP CX
9 3 (0.18%) SAP MM
10 2 (0.12%) OpenText VIM for SAP
10 2 (0.12%) Salesforce CRM
10 2 (0.12%) SAP EWM
Cloud Services
1 603 (36.24%) Azure
2 373 (22.42%) SaaS
3 327 (19.65%) PaaS
4 305 (18.33%) IaaS
5 291 (17.49%) AWS
6 287 (17.25%) Power Platform
7 245 (14.72%) Serverless
8 243 (14.60%) Dynamics 365
9 234 (14.06%) Azure Functions
10 164 (9.86%) GCP
11 78 (4.69%) Microsoft 365
12 66 (3.97%) Azure DevOps
13 43 (2.58%) Entra ID
14 24 (1.44%) Azure Sentinel
15 23 (1.38%) GitHub
16 21 (1.26%) OpenShift
17 18 (1.08%) Azure Data Factory
18 16 (0.96%) Azure ExpressRoute
19 15 (0.90%) PowerApps
20 14 (0.84%) AWS CodePipeline
Communications & Networking
1 51 (3.06%) Network Security
2 39 (2.34%) DNS
3 37 (2.22%) Firewall
4 19 (1.14%) LAN
5 17 (1.02%) WAN
6 16 (0.96%) Internet
7 15 (0.90%) DHCP
8 14 (0.84%) VPN
9 12 (0.72%) TCP/IP
9 12 (0.72%) Wireless
10 10 (0.60%) SAN
11 9 (0.54%) Wi-Fi
12 7 (0.42%) VoIP
13 5 (0.30%) HTTP
13 5 (0.30%) SD-WAN
13 5 (0.30%) Software-Defined Radio
13 5 (0.30%) Unified Communications
14 4 (0.24%) MPLS
14 4 (0.24%) NetScaler
14 4 (0.24%) Reverse Proxy
Database & Business Intelligence
1 102 (6.13%) Data Warehouse
2 76 (4.57%) Data Lake
3 65 (3.91%) NoSQL
4 57 (3.43%) SQL Server
5 41 (2.46%) Power BI
6 33 (1.98%) Relational Database
7 32 (1.92%) Elasticsearch
8 31 (1.86%) MongoDB
9 22 (1.32%) BigQuery
10 21 (1.26%) Metadata
11 20 (1.20%) Azure SQL Database
12 18 (1.08%) RDBMS
13 16 (0.96%) Tableau
14 11 (0.66%) MySQL
14 11 (0.66%) PostgreSQL
15 10 (0.60%) Big Data
15 10 (0.60%) SQL Server Integration Services
16 9 (0.54%) Redis
17 6 (0.36%) Metadata Repository
17 6 (0.36%) SQL Server Reporting Services
Development Applications
1 47 (2.82%) Cypress.io
2 46 (2.76%) JIRA
3 43 (2.58%) Jenkins
4 35 (2.10%) Git
5 25 (1.50%) Selenium
6 22 (1.32%) Cucumber
7 8 (0.48%) GitLab
8 7 (0.42%) ERwin
8 7 (0.42%) Visual Studio
9 6 (0.36%) Octopus Deploy
10 5 (0.30%) JMeter
10 5 (0.30%) Oracle Forms
11 3 (0.18%) Atlassian Bamboo
11 3 (0.18%) Postman
11 3 (0.18%) Visual Studio Team System
12 2 (0.12%) Artifactory
12 2 (0.12%) Capybara
12 2 (0.12%) Hardhat
12 2 (0.12%) Team Foundation Server
12 2 (0.12%) Visual Studio Code
General
1 759 (45.61%) Finance
2 419 (25.18%) Social Skills
3 213 (12.80%) Banking
4 151 (9.07%) Retail
5 131 (7.87%) Analytical Skills
6 130 (7.81%) Inclusion and Diversity
7 125 (7.51%) Marketing
8 68 (4.09%) Public Sector
9 60 (3.61%) Influencing Skills
10 46 (2.76%) Legal
11 35 (2.10%) Law
12 31 (1.86%) Back Office
13 29 (1.74%) Front Office
14 28 (1.68%) Presentation Skills
15 27 (1.62%) Local Government
16 26 (1.56%) Manufacturing
17 25 (1.50%) Games
17 25 (1.50%) Publishing
18 19 (1.14%) Aerospace
18 19 (1.14%) Documentation Skills
Job Titles
1 576 (34.62%) Architect
2 222 (13.34%) Dynamics 365 Architect
3 220 (13.22%) CRM Architect
3 220 (13.22%) Dynamics CRM Architect
4 219 (13.16%) Lead
5 206 (12.38%) Senior
6 117 (7.03%) Product Manager
7 116 (6.97%) Solutions Architect
8 95 (5.71%) Enterprise Architect
9 92 (5.53%) Developer
10 77 (4.63%) Analyst
11 73 (4.39%) Software Engineer
12 60 (3.61%) IT Manager
13 49 (2.94%) Consultant
14 48 (2.88%) Data Architect
14 48 (2.88%) Product Owner
15 41 (2.46%) Business Analyst
16 36 (2.16%) Cloud Architect
17 34 (2.04%) Service Manager
18 32 (1.92%) Senior Manager
Libraries, Frameworks & Software Standards
1 80 (4.81%) .NET
2 77 (4.63%) React
3 75 (4.51%) Node.js
4 48 (2.88%) OpenID
5 32 (1.92%) Redux
6 23 (1.38%) CSS
6 23 (1.38%) HTML
7 22 (1.32%) JSON
8 21 (1.26%) Kafka
8 21 (1.26%) RESTful
9 17 (1.02%) .NET Core
9 17 (1.02%) REST
9 17 (1.02%) Web Services
9 17 (1.02%) YAML
10 16 (0.96%) AngularJS
11 13 (0.78%) Middleware
12 10 (0.60%) Azure Blueprints
12 10 (0.60%) Oracle Fusion
12 10 (0.60%) Spring
12 10 (0.60%) Vue
Miscellaneous
1 199 (11.96%) Product Ownership
2 77 (4.63%) Data Centre
3 75 (4.51%) Cloud Native
4 62 (3.73%) Management Information System
5 61 (3.67%) Public Cloud
6 60 (3.61%) Mainframe
7 58 (3.49%) Blockchain
8 54 (3.25%) Virtual Team
9 28 (1.68%) Algorithms
9 28 (1.68%) Self-Motivation
10 27 (1.62%) Fixed Income
11 26 (1.56%) Enterprise Software
12 25 (1.50%) Private Cloud
13 18 (1.08%) Hybrid Cloud
14 17 (1.02%) Mobile App
14 17 (1.02%) Swaptions
15 16 (0.96%) Linux Command Line
15 16 (0.96%) Replication
16 15 (0.90%) IoT
16 15 (0.90%) Security Posture
Operating Systems
1 75 (4.51%) Windows
2 48 (2.88%) Unix
3 46 (2.76%) Linux
4 26 (1.56%) Windows Server
5 22 (1.32%) Red Hat Enterprise Linux
6 13 (0.78%) Android
6 13 (0.78%) HPUX
7 12 (0.72%) AIX
7 12 (0.72%) Apple iOS
7 12 (0.72%) Solaris
8 6 (0.36%) Mac OS
8 6 (0.36%) Ubuntu
8 6 (0.36%) Windows 10
9 5 (0.30%) Windows Server 2016
10 3 (0.18%) Data ONTAP
10 3 (0.18%) Windows Server 2012
10 3 (0.18%) Windows Server 2019
11 2 (0.12%) VMS
12 1 (0.060%) CentOS
12 1 (0.060%) Debian
Processes & Methodologies
1 871 (52.34%) Agile
2 528 (31.73%) Strategic Roadmap
3 292 (17.55%) CRM
4 288 (17.31%) DevOps
5 265 (15.93%) Product Roadmap
6 256 (15.38%) Actionable Insight
7 244 (14.66%) Presales
8 232 (13.94%) Technology Roadmap
9 228 (13.70%) Project Planning
10 221 (13.28%) Work Breakdown Structure
11 202 (12.14%) Software Engineering
12 191 (11.48%) Analytics
13 181 (10.88%) Mentoring
14 155 (9.31%) Technology Strategy
15 154 (9.25%) Artificial Intelligence
16 153 (9.19%) Problem-Solving
17 148 (8.89%) Enterprise Architecture
18 141 (8.47%) Continuous Improvement
18 141 (8.47%) IT Strategy
18 141 (8.47%) Microservices
Programming Languages
1 158 (9.50%) Python
2 135 (8.11%) SQL
3 125 (7.51%) JavaScript
4 105 (6.31%) Java
5 76 (4.57%) PowerShell
6 67 (4.03%) C#
7 58 (3.49%) TypeScript
8 47 (2.82%) Bash
9 22 (1.32%) C++
10 20 (1.20%) VB
11 17 (1.02%) Go
12 14 (0.84%) Bicep
13 9 (0.54%) PHP
14 5 (0.30%) MATLAB
15 4 (0.24%) T-SQL
16 3 (0.18%) Kotlin
16 3 (0.18%) Kusto Query Language
16 3 (0.18%) PL/SQL
16 3 (0.18%) Ruby
16 3 (0.18%) VBScript
Qualifications
1 169 (10.16%) Degree
2 132 (7.93%) Security Cleared
3 94 (5.65%) SC Cleared
4 36 (2.16%) CISSP
5 35 (2.10%) Azure Certification
6 29 (1.74%) Master's Degree
7 18 (1.08%) BPSS Clearance
8 16 (0.96%) CISM
8 16 (0.96%) Computer Science Degree
9 13 (0.78%) AWS Certification
10 12 (0.72%) Cisco Certification
10 12 (0.72%) ISACA
10 12 (0.72%) Microsoft Certification
10 12 (0.72%) TOGAF Certification
11 9 (0.54%) CCNP
11 9 (0.54%) CompTIA Security+
11 9 (0.54%) DV Cleared
11 9 (0.54%) PMI Certification
12 8 (0.48%) GIAC
12 8 (0.48%) ITIL Certification
Quality Assurance & Compliance
1 53 (3.19%) Data Quality
2 33 (1.98%) GDPR
3 30 (1.80%) ISO/IEC 27001
4 24 (1.44%) QA
5 21 (1.26%) PMO
6 17 (1.02%) Accessibility
6 17 (1.02%) Cyber Essentials
7 14 (0.84%) NIST
8 13 (0.78%) PCI DSS
9 11 (0.66%) GRC
10 9 (0.54%) NCSC
11 7 (0.42%) Cyber Essentials PLUS
11 7 (0.42%) ISO 9001
11 7 (0.42%) Sarbanes-Oxley
11 7 (0.42%) SLA
12 6 (0.36%) GAAP
12 6 (0.36%) HIPAA
13 5 (0.30%) GxP
14 4 (0.24%) COBIT
14 4 (0.24%) MiFID
System Software
1 75 (4.51%) Docker
2 64 (3.85%) Active Directory
3 23 (1.38%) Virtual Machines
4 20 (1.20%) VMware Infrastructure
5 10 (0.60%) Virtual Desktop
6 7 (0.42%) Hyper-V
7 6 (0.36%) vSphere
8 5 (0.30%) Firmware
8 5 (0.30%) VMware ESXi
9 4 (0.24%) BitLocker
Systems Management
1 119 (7.15%) Kubernetes
2 63 (3.79%) Terraform
3 27 (1.62%) Microsoft Intune
4 18 (1.08%) Ansible
5 16 (0.96%) Istio
6 13 (0.78%) SCCM
7 8 (0.48%) Nessus
8 7 (0.42%) Grafana
9 6 (0.36%) SysTrack
10 4 (0.24%) Active Directory Federation Services
11 3 (0.18%) Cisco CUCM
11 3 (0.18%) NetBackup
11 3 (0.18%) Single Sign-On
12 2 (0.12%) Backup Exec
12 2 (0.12%) Jamf Pro
12 2 (0.12%) Kibana
12 2 (0.12%) Microsoft Data Protection Manager
12 2 (0.12%) Oracle Identity Management
12 2 (0.12%) Stealthwatch
12 2 (0.12%) vCenter Server
Vendors
1 444 (26.68%) Microsoft
2 76 (4.57%) Google
3 74 (4.45%) Oracle
4 68 (4.09%) SAP
5 54 (3.25%) Salesforce
6 26 (1.56%) Cisco
6 26 (1.56%) Databricks
7 24 (1.44%) ServiceNow
7 24 (1.44%) VMware
8 22 (1.32%) IBM
9 19 (1.14%) TIBCO
10 17 (1.02%) HP
10 17 (1.02%) OpenLink
10 17 (1.02%) Sybase
11 14 (0.84%) Palo Alto
11 14 (0.84%) Splunk
11 14 (0.84%) Sun
12 12 (0.72%) Unisys
13 8 (0.48%) Red Hat
13 8 (0.48%) Remedy