Stakeholder Management Jobs with Hybrid/Remote/WFH Options

Stakeholder Management
UK > Work from Home

The table below provides summary statistics for permanent remote or hybrid work requiring Stakeholder Management skills. It includes a benchmarking guide to the annual salaries offered in vacancies that cited Stakeholder Management over the 6 months leading up to 30 May 2025, comparing them to the same period in the previous two years.

6 months to
30 May 2025
Same period 2024 Same period 2023
Rank 65 53 49
Rank change year-on-year -12 -4 +7
Permanent jobs citing Stakeholder Management 881 1,656 2,372
As % of all permanent jobs with a WFH option 4.67% 4.81% 5.98%
As % of the Processes & Methodologies category 4.96% 5.32% 6.23%
Number of salaries quoted 480 1,211 1,667
10th Percentile £42,500 £38,734 £41,740
25th Percentile £51,051 £46,250 £51,250
Median annual salary (50th Percentile) £65,000 £62,500 £65,000
Median % change year-on-year +4.00% -3.85% +4.00%
75th Percentile £84,000 £82,500 £85,000
90th Percentile £105,000 £100,000 £101,250
UK median annual salary £65,000 £62,500 £65,000
% change year-on-year +4.00% -3.85% +4.00%

All Process and Methodology Skills
Work from Home

Stakeholder Management falls under the Processes and Methodologies category. For comparison with the information above, the following table provides summary statistics for all permanent job vacancies with remote or hybrid options requiring process or methodology skills.

Permanent vacancies with a requirement for process or methodology skills 17,749 31,137 38,086
As % of all permanent jobs with a WFH option 93.99% 90.42% 96.09%
Number of salaries quoted 9,374 23,468 26,396
10th Percentile £27,000 £33,750 £37,500
25th Percentile £42,500 £42,500 £47,500
Median annual salary (50th Percentile) £57,500 £57,500 £62,871
Median % change year-on-year - -8.54% +4.79%
75th Percentile £76,840 £75,000 £82,500
90th Percentile £100,000 £95,000 £100,000
UK median annual salary £57,443 £55,000 £60,899
% change year-on-year +4.44% -9.69% +1.50%

Stakeholder Management
Trend for Jobs with a WFH Option

Job vacancies with remote working options citing Stakeholder Management as a proportion of all IT jobs advertised.
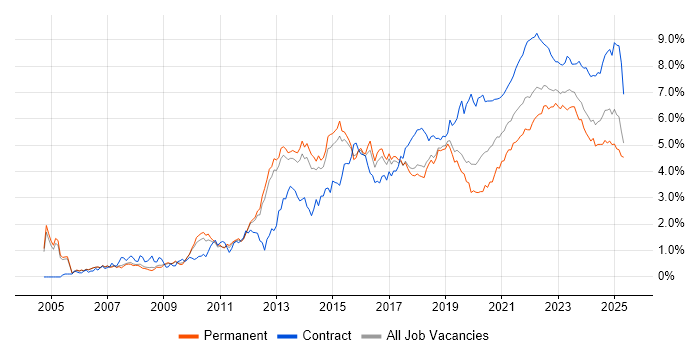
Stakeholder Management trend for jobs with Hybrid/Remote/WFH options

Stakeholder Management
Salary Trend for Jobs with a WFH Option

3-month moving average salary quoted in job vacancies with remote working options citing Stakeholder Management.

Stakeholder Management salary trend for jobs with a WFH option

Stakeholder Management
Salary Histogram for Jobs with a WFH Option

Salary distribution for jobs with remote working options citing Stakeholder Management over the 6 months to 30 May 2025.

Stakeholder Management salary histogram for jobs with a WFH option

Stakeholder Management
Co-occurring Skills and Capabilities with WFH Options by Category

The follow tables expand on the table above by listing co-occurrences grouped by category. The same employment type, locality and period is covered with up to 20 co-occurrences shown in each of the following categories:

Application Platforms
1 78 (8.85%) Confluence
2 13 (1.48%) SharePoint
3 6 (0.68%) CMS
4 5 (0.57%) SAS
5 4 (0.45%) Apache Spark
6 3 (0.34%) Apache Airflow
7 2 (0.23%) IIS
7 2 (0.23%) Microsoft Exchange
7 2 (0.23%) Oracle Workflow
7 2 (0.23%) ThingWorx
8 1 (0.11%) Apache
8 1 (0.11%) ColdFusion
8 1 (0.11%) Drupal
8 1 (0.11%) Mendix
8 1 (0.11%) NetWeaver
8 1 (0.11%) SharePoint Server
8 1 (0.11%) Umbraco
Applications
1 85 (9.65%) Microsoft Office
2 37 (4.20%) Microsoft Excel
3 34 (3.86%) Microsoft Project
4 23 (2.61%) Microsoft PowerPoint
5 11 (1.25%) MS Visio
6 8 (0.91%) Trello
7 7 (0.79%) Spreadsheet
8 4 (0.45%) AutoCAD
9 2 (0.23%) Adobe Captivate
9 2 (0.23%) Chatbot
10 1 (0.11%) Adobe Illustrator
10 1 (0.11%) Adobe Premiere
10 1 (0.11%) Photoshop
Business Applications
1 12 (1.36%) SAP S/4HANA
2 9 (1.02%) Dynamics CRM
3 7 (0.79%) Oracle ERP
4 6 (0.68%) SAP CO
4 6 (0.68%) SAP FI
4 6 (0.68%) SAP FI/CO
5 4 (0.45%) SAP PP
6 3 (0.34%) Infor M3
6 3 (0.34%) Sparx Enterprise Architect
7 2 (0.23%) Adobe Campaign
7 2 (0.23%) Aladdin
7 2 (0.23%) Dynamics AX
7 2 (0.23%) Oracle EBS
7 2 (0.23%) Oracle EBS R12
7 2 (0.23%) Oracle Financials
7 2 (0.23%) SAP HCM
7 2 (0.23%) Workday HCM
8 1 (0.11%) Dynamics GP
8 1 (0.11%) Magento
8 1 (0.11%) SAP BPC
Cloud Services
1 102 (11.58%) Azure
2 73 (8.29%) Miro
3 72 (8.17%) Asana
4 61 (6.92%) AWS
5 51 (5.79%) Power Platform
6 37 (4.20%) GCP
7 34 (3.86%) SaaS
8 24 (2.72%) Azure DevOps
9 17 (1.93%) Microsoft 365
10 16 (1.82%) Dynamics 365
11 11 (1.25%) Serverless
12 9 (1.02%) Amazon S3
13 8 (0.91%) Amazon EC2
14 7 (0.79%) AWS Lambda
14 7 (0.79%) Azure Synapse Analytics
14 7 (0.79%) Cloud Computing
14 7 (0.79%) Entra ID
14 7 (0.79%) Snowflake
15 6 (0.68%) GitHub
15 6 (0.68%) SuccessFactors
Communications & Networking
1 84 (9.53%) Broadband
2 18 (2.04%) Firewall
3 10 (1.14%) VPN
4 8 (0.91%) WAN
5 7 (0.79%) Network Security
6 5 (0.57%) SD-WAN
6 5 (0.57%) Wi-Fi
7 4 (0.45%) DHCP
7 4 (0.45%) DNS
7 4 (0.45%) LAN
8 2 (0.23%) Cisco ASA
8 2 (0.23%) Cisco Firepower
8 2 (0.23%) Cisco ISE
8 2 (0.23%) Internet
8 2 (0.23%) Intranet
8 2 (0.23%) Junos
8 2 (0.23%) Software-Defined Networking
8 2 (0.23%) TACACS
8 2 (0.23%) Wireless
8 2 (0.23%) Wireshark
Database & Business Intelligence
1 43 (4.88%) Power BI
2 23 (2.61%) Tableau
3 16 (1.82%) SQL Server
4 14 (1.59%) Data Warehouse
5 10 (1.14%) Data Lake
5 10 (1.14%) Metadata
6 9 (1.02%) SQL Server Reporting Services
7 8 (0.91%) MySQL
7 8 (0.91%) Relational Database
8 7 (0.79%) PostgreSQL
8 7 (0.79%) SQL Server Integration Services
9 5 (0.57%) Oracle Reports
9 5 (0.57%) SAP HANA
10 4 (0.45%) Hadoop
11 3 (0.34%) Amazon Athena
11 3 (0.34%) Amazon Redshift
11 3 (0.34%) MongoDB
11 3 (0.34%) Parquet
11 3 (0.34%) Redis
11 3 (0.34%) Spark SQL
Development Applications
1 112 (12.71%) JIRA
2 15 (1.70%) Git
3 8 (0.91%) GitLab
4 6 (0.68%) Jenkins
5 5 (0.57%) ERwin
6 3 (0.34%) Cypress.io
6 3 (0.34%) Oracle Forms
6 3 (0.34%) Visual Studio
7 2 (0.23%) Axure RP
7 2 (0.23%) SQL Server Management Studio (SSMS)
7 2 (0.23%) webpack
8 1 (0.11%) JUnit
8 1 (0.11%) Maven
8 1 (0.11%) MLflow
8 1 (0.11%) Mockito
8 1 (0.11%) Rational Rhapsody
8 1 (0.11%) Selenium
8 1 (0.11%) SonarQube
8 1 (0.11%) Subversion
8 1 (0.11%) Yeoman
General
1 458 (51.99%) Finance
2 363 (41.20%) Social Skills
3 161 (18.27%) Banking
4 148 (16.80%) Analytical Skills
5 101 (11.46%) Influencing Skills
6 74 (8.40%) Public Sector
7 69 (7.83%) Inclusion and Diversity
8 61 (6.92%) Marketing
9 43 (4.88%) Presentation Skills
10 40 (4.54%) Manufacturing
11 39 (4.43%) Legal
12 32 (3.63%) Organisational Skills
13 26 (2.95%) Law
14 25 (2.84%) Electronics
15 24 (2.72%) Retail
16 23 (2.61%) Telecoms
17 21 (2.38%) Local Government
18 16 (1.82%) Financial Institution
19 14 (1.59%) Front Office
20 12 (1.36%) Advertising
Job Titles
1 189 (21.45%) Senior
2 170 (19.30%) Analyst
3 81 (9.19%) Architect
3 81 (9.19%) Designer
4 80 (9.08%) Senior Designer
4 80 (9.08%) Senior UX Designer
4 80 (9.08%) UX Designer
5 75 (8.51%) Product Analyst
6 70 (7.95%) Project Manager
7 49 (5.56%) Lead
8 45 (5.11%) IT Manager
9 43 (4.88%) Consultant
10 39 (4.43%) Solutions Architect
11 37 (4.20%) Developer
12 30 (3.41%) Senior Manager
13 27 (3.06%) Senior Analyst
14 26 (2.95%) Business Analyst
14 26 (2.95%) Product Manager
15 25 (2.84%) Programme Manager
16 21 (2.38%) Delivery Manager
Libraries, Frameworks & Software Standards
1 19 (2.16%) .NET
1 19 (2.16%) REST
2 14 (1.59%) React
3 12 (1.36%) .NET Core
4 11 (1.25%) AngularJS
5 9 (1.02%) EDI
5 9 (1.02%) HTML
6 8 (0.91%) CSS
7 6 (0.68%) .NET Framework
8 5 (0.57%) FHIR
8 5 (0.57%) Node.js
8 5 (0.57%) Oracle Fusion
8 5 (0.57%) PySpark
9 4 (0.45%) Android Jetpack
9 4 (0.45%) Jetpack Compose
9 4 (0.45%) Middleware
9 4 (0.45%) SOAP
9 4 (0.45%) SwiftUI
10 3 (0.34%) JSON
10 3 (0.34%) XML
Miscellaneous
1 109 (12.37%) Product Ownership
2 102 (11.58%) Self-Motivation
3 72 (8.17%) Over-the-Top Content
3 72 (8.17%) Video\Live Streaming
4 39 (4.43%) Management Information System
5 24 (2.72%) Social Media
6 20 (2.27%) Onboarding
6 20 (2.27%) PMI
7 19 (2.16%) Cloud Native
7 19 (2.16%) NHS
8 15 (1.70%) Public Cloud
9 14 (1.59%) Derivative
10 12 (1.36%) Legacy Systems
11 11 (1.25%) Data Centre
12 9 (1.02%) Enterprise Software
12 9 (1.02%) Hybrid Cloud
13 8 (0.91%) CMDB
13 8 (0.91%) IoT
13 8 (0.91%) Mobile App
14 7 (0.79%) Data Protection Act
Operating Systems
1 32 (3.63%) Windows
2 14 (1.59%) Linux
3 6 (0.68%) Windows Vista
4 4 (0.45%) Android
4 4 (0.45%) Apple iOS
5 3 (0.34%) CentOS
5 3 (0.34%) Windows Server
6 2 (0.23%) Windows Server 2016
7 1 (0.11%) Debian
7 1 (0.11%) Ubuntu
7 1 (0.11%) VMS
7 1 (0.11%) Windows 10
Processes & Methodologies
1 440 (49.94%) Agile
2 264 (29.97%) Project Management
3 178 (20.20%) Roadmaps
4 174 (19.75%) Problem-Solving
5 149 (16.91%) Project Delivery
6 141 (16.00%) Continuous Improvement
7 124 (14.07%) User Experience
8 117 (13.28%) Prototyping
9 107 (12.15%) UX Design
10 106 (12.03%) CRM
10 106 (12.03%) Design Thinking
11 105 (11.92%) User-Centered Design (UCD)
12 104 (11.80%) Wireframes
13 102 (11.58%) User Research
13 102 (11.58%) UX Research
14 100 (11.35%) Journey Map
14 100 (11.35%) Usability Testing
15 96 (10.90%) Risk Management
16 94 (10.67%) PRINCE2
17 90 (10.22%) Product Management
Programming Languages
1 69 (7.83%) SQL
2 43 (4.88%) Python
3 28 (3.18%) C#
4 22 (2.50%) JavaScript
5 21 (2.38%) Java
6 8 (0.91%) PowerShell
7 7 (0.79%) T-SQL
7 7 (0.79%) TypeScript
8 5 (0.57%) Data Analysis Expressions
9 4 (0.45%) R
9 4 (0.45%) Swift
10 2 (0.23%) Apex Code
10 2 (0.23%) C++
10 2 (0.23%) PL/SQL
10 2 (0.23%) Ruby
10 2 (0.23%) VB
10 2 (0.23%) VBA
11 1 (0.11%) Bicep
11 1 (0.11%) PHP
Qualifications
1 116 (13.17%) Degree
2 53 (6.02%) PMI Certification
2 53 (6.02%) Security Cleared
3 37 (4.20%) PMP
4 31 (3.52%) Computer Science Degree
4 31 (3.52%) DBS Check
5 26 (2.95%) SC Cleared
6 24 (2.72%) DV Cleared
7 18 (2.04%) CISSP
8 14 (1.59%) Master's Degree
9 11 (1.25%) CISA
10 10 (1.14%) ITIL Certification
11 8 (0.91%) Azure Certification
11 8 (0.91%) Postgraduate
11 8 (0.91%) PRINCE2 Practitioner
12 7 (0.79%) ACCA
12 7 (0.79%) Cisco Certification
12 7 (0.79%) Microsoft Certification
13 6 (0.68%) CIMA
13 6 (0.68%) CISM
Quality Assurance & Compliance
1 134 (15.21%) Accessibility
2 40 (4.54%) QA
3 24 (2.72%) PMO
4 18 (2.04%) GDPR
5 17 (1.93%) ISO/IEC 27001
6 12 (1.36%) Data Quality
7 10 (1.14%) PCI DSS
8 9 (1.02%) ITGC
9 8 (0.91%) Cyber Essentials
10 6 (0.68%) IFRS
10 6 (0.68%) IFRS 9
10 6 (0.68%) SLA
11 5 (0.57%) GRC
11 5 (0.57%) NIST
12 4 (0.45%) 21 CFR Part 11
12 4 (0.45%) Cyber Essentials PLUS
12 4 (0.45%) Good Clinical Practice
12 4 (0.45%) SOC 2
13 3 (0.34%) PMBOK
13 3 (0.34%) Sarbanes-Oxley
System Software
1 20 (2.27%) Docker
2 12 (1.36%) Active Directory
3 4 (0.45%) VMware Infrastructure
4 2 (0.23%) Firmware
4 2 (0.23%) Hyper-V
4 2 (0.23%) VMware ESXi
4 2 (0.23%) VMware NSX
5 1 (0.11%) NFS
Systems Management
1 20 (2.27%) Kubernetes
2 12 (1.36%) Terraform
3 8 (0.91%) Ansible
4 2 (0.23%) Grafana
4 2 (0.23%) Kibana
4 2 (0.23%) logstash
4 2 (0.23%) Prometheus
5 1 (0.11%) Consul
5 1 (0.11%) Marathon
5 1 (0.11%) Microsoft Intune
5 1 (0.11%) Packer
5 1 (0.11%) Plesk
5 1 (0.11%) SCCM
Vendors
1 159 (18.05%) Microsoft
2 102 (11.58%) Salesforce
3 64 (7.26%) SAP
4 27 (3.06%) Google
4 27 (3.06%) Oracle
5 19 (2.16%) ServiceNow
6 11 (1.25%) Adobe
6 11 (1.25%) Databricks
7 10 (1.14%) IBM
8 9 (1.02%) Cisco
9 7 (0.79%) Ariba
10 6 (0.68%) Concur
10 6 (0.68%) VMware
10 6 (0.68%) Workday
11 5 (0.57%) Fortinet
11 5 (0.57%) PeopleSoft
11 5 (0.57%) Sparx
12 4 (0.45%) JD Edwards
12 4 (0.45%) Teradata
12 4 (0.45%) YouTube