Technology Roadmap Jobs with Work from Home Options

Technology Roadmaps
UK > Work from Home

The table below provides summary statistics for permanent job vacancies with an option to work from home (WFH) and a requirement for Technology Roadmap skills. Included is a benchmarking guide to the salaries offered in vacancies that have cited Technology Roadmap over the 6 months to 7 May 2024 with a comparison to the same period in the previous 2 years.

6 months to
7 May 2024
Same period 2023 Same period 2022
Rank 336 229 326
Rank change year-on-year -107 +97 -72
Permanent jobs citing Technology Roadmap 282 615 772
As % of all permanent jobs with a WFH option 0.84% 1.48% 1.12%
As % of the Processes & Methodologies category 0.92% 1.54% 1.16%
Number of salaries quoted 207 397 414
10th Percentile £47,750 £53,463 £46,000
25th Percentile £58,125 £61,180 £57,039
Median annual salary (50th Percentile) £77,500 £80,000 £72,500
Median % change year-on-year -3.13% +10.34% -3.33%
75th Percentile £92,500 £115,000 £95,000
90th Percentile £110,500 £120,000 £108,750
UK median annual salary £75,400 £79,632 £70,000
% change year-on-year -5.31% +13.76% -

All Process and Methodology Skills
Work from Home

Technology Roadmap is in the Processes and Methodologies category. The following table is for comparison with the above and provides summary statistics for all permanent job vacancies with a WFH option and a requirement for process or methodology skills.

Permanent vacancies with a requirement for process or methodology skills 30,775 39,955 66,612
As % of all permanent jobs with a WFH option 91.47% 96.10% 96.96%
Number of salaries quoted 23,345 27,739 41,261
10th Percentile £33,750 £37,500 £36,250
25th Percentile £42,500 £47,500 £45,750
Median annual salary (50th Percentile) £57,500 £62,500 £60,000
Median % change year-on-year -8.00% +4.17% +9.09%
75th Percentile £75,000 £82,500 £80,000
90th Percentile £95,000 £100,000 £95,000
UK median annual salary £55,000 £61,180 £60,000
% change year-on-year -10.10% +1.97% +9.09%

Technology Roadmap
Trend for Jobs with a WFH Option

Job vacancies with a work from home option citing Technology Roadmap as a proportion of all IT jobs advertised.
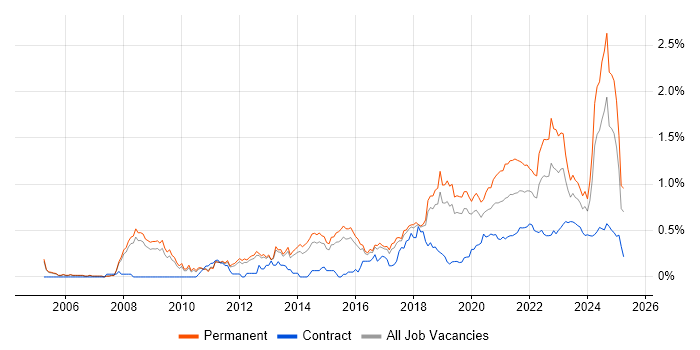
Technology Roadmap trend for jobs with a WFH option

Technology Roadmap
Salary Trend for Jobs with a WFH Option

3-month moving average salary quoted in job vacancies with a work from home option citing Technology Roadmap.

Technology Roadmap salary trend for jobs with a WFH option

Technology Roadmap
Salary Histogram for Jobs with a WFH Option

Salary distribution for jobs with a work from home option citing Technology Roadmap over the 6 months to 7 May 2024.

Technology Roadmap salary histogram for jobs with a WFH option

Technology Roadmap
Co-occurring Skills and Capabilities with WFH Options by Category

The follow tables expand on the table above by listing co-occurrences grouped by category. The same employment type, locality and period is covered with up to 20 co-occurrences shown in each of the following categories:

Application Platforms
1 12 (4.26%) SharePoint
2 6 (2.13%) Apache
2 6 (2.13%) IIS
3 3 (1.06%) Apache Solr
3 3 (1.06%) Microsoft Exchange
4 2 (0.71%) Confluence
5 1 (0.35%) Apache Spark
5 1 (0.35%) CMS
5 1 (0.35%) Umbraco
Applications
1 8 (2.84%) Microsoft Office
2 3 (1.06%) Microsoft Excel
3 1 (0.35%) CANalyzer
3 1 (0.35%) Microsoft PowerPoint
3 1 (0.35%) Microsoft Project
3 1 (0.35%) Simulink
Business Applications
1 6 (2.13%) Oracle General Ledger
1 6 (2.13%) Oracle Subledger Accounting
2 2 (0.71%) SAP Business One
3 1 (0.35%) Cognos Business Intelligence
3 1 (0.35%) Cognos Controller
3 1 (0.35%) Dynamics CRM
3 1 (0.35%) IBM Planning Analytics
3 1 (0.35%) Oracle Assets
3 1 (0.35%) Oracle Payables
3 1 (0.35%) Oracle Receivables
3 1 (0.35%) SAP EWM
3 1 (0.35%) SAP FI
3 1 (0.35%) SAP S/4HANA
3 1 (0.35%) SAP SD
Cloud Services
1 61 (21.63%) AWS
2 56 (19.86%) Azure
3 31 (10.99%) Microsoft 365
4 17 (6.03%) SaaS
5 15 (5.32%) Entra ID
6 13 (4.61%) Power Platform
7 11 (3.90%) dbt
7 11 (3.90%) GCP
8 9 (3.19%) Dynamics 365
9 6 (2.13%) OCI
9 6 (2.13%) OneDrive
10 5 (1.77%) Azure DevOps
10 5 (1.77%) Azure Sentinel
10 5 (1.77%) Microsoft Purview
10 5 (1.77%) Power Automate
10 5 (1.77%) PowerApps
11 4 (1.42%) PaaS
11 4 (1.42%) Serverless
12 2 (0.71%) Azure Logic Apps
12 2 (0.71%) Azure Service Bus
Communications & Networking
1 6 (2.13%) WAN
2 5 (1.77%) LAN
3 4 (1.42%) DHCP
3 4 (1.42%) DNS
3 4 (1.42%) Firewall
3 4 (1.42%) SAN
3 4 (1.42%) Wireless
4 3 (1.06%) PBX
4 3 (1.06%) SD-WAN
4 3 (1.06%) VLAN
5 2 (0.71%) Cisco Nexus
5 2 (0.71%) Wi-Fi
6 1 (0.35%) 802.11
6 1 (0.35%) BGP
6 1 (0.35%) Cisco ISE
6 1 (0.35%) GLBP
6 1 (0.35%) IGRP
6 1 (0.35%) Internet
6 1 (0.35%) Multicast
6 1 (0.35%) NAS
Database & Business Intelligence
1 8 (2.84%) PostgreSQL
1 8 (2.84%) Power BI
2 7 (2.48%) Data Warehouse
3 6 (2.13%) MySQL
3 6 (2.13%) SAP BW
4 5 (1.77%) SQL Server
5 4 (1.42%) Big Data
6 3 (1.06%) Apache Cassandra
6 3 (1.06%) BigQuery
6 3 (1.06%) MongoDB
7 2 (0.71%) Snowflake Schema
7 2 (0.71%) Star Schema
8 1 (0.35%) Amazon RDS
8 1 (0.35%) Azure SQL Database
8 1 (0.35%) Relational Database
8 1 (0.35%) SQL Server Integration Services
8 1 (0.35%) SQL Server Reporting Services
Development Applications
1 11 (3.90%) JIRA
2 3 (1.06%) Rational DOORS
2 3 (1.06%) Rational Rhapsody
3 2 (0.71%) Sonatype Nexus
4 1 (0.35%) CANoe
4 1 (0.35%) Cucumber
4 1 (0.35%) DbUnit
4 1 (0.35%) Git
4 1 (0.35%) Jenkins
4 1 (0.35%) jMock
4 1 (0.35%) JUnit
4 1 (0.35%) Maven
4 1 (0.35%) Mockito
4 1 (0.35%) Postman
4 1 (0.35%) Selenium
4 1 (0.35%) SoapUI
4 1 (0.35%) SonarQube
4 1 (0.35%) TestNG
General
1 65 (23.05%) Social Skills
2 40 (14.18%) Finance
3 28 (9.93%) Analytical Skills
4 14 (4.96%) Inclusion and Diversity
5 12 (4.26%) Manufacturing
6 11 (3.90%) Retail
7 9 (3.19%) Public Sector
8 8 (2.84%) Law
8 8 (2.84%) Marketing
9 7 (2.48%) Aviation
9 7 (2.48%) Back Office
9 7 (2.48%) Games
10 6 (2.13%) Electronics
10 6 (2.13%) General Ledger
11 5 (1.77%) Legal
11 5 (1.77%) Presentation Skills
12 3 (1.06%) Automotive
12 3 (1.06%) Banking
12 3 (1.06%) Pharmaceutical
12 3 (1.06%) Telecoms
Job Titles
1 111 (39.36%) Architect
2 50 (17.73%) Applications Architect
3 45 (15.96%) Lead
4 27 (9.57%) Senior
5 25 (8.87%) Solutions Architect
6 23 (8.16%) Developer
7 19 (6.74%) Technical Architect
8 15 (5.32%) Software Manager
9 12 (4.26%) Principal Engineer
9 12 (4.26%) Software Engineer
10 10 (3.55%) Engineering Manager
10 10 (3.55%) Infrastructure Engineer
10 10 (3.55%) Technical Leader
11 9 (3.19%) Lead Developer
12 8 (2.84%) Enterprise Architect
12 8 (2.84%) IT Manager
12 8 (2.84%) Senior Software Engineer
13 7 (2.48%) Head of Architecture
14 6 (2.13%) Java Developer
14 6 (2.13%) Software Engineering Manager
Libraries, Frameworks & Software Standards
1 28 (9.93%) .NET
1 28 (9.93%) React
2 20 (7.09%) Node.js
3 13 (4.61%) .NET Framework
4 12 (4.26%) XML
5 11 (3.90%) AngularJS
5 11 (3.90%) Django
5 11 (3.90%) HTML
6 9 (3.19%) CSS
6 9 (3.19%) GraphQL
7 7 (2.48%) Entity Framework
7 7 (2.48%) Twitter Bootstrap
8 6 (2.13%) .NET Core
8 6 (2.13%) Laravel
8 6 (2.13%) REST
9 5 (1.77%) ASP.NET
9 5 (1.77%) SOAP
9 5 (1.77%) Vue
9 5 (1.77%) Web Services
10 4 (1.42%) Symfony
Miscellaneous
1 14 (4.96%) Enterprise Software
1 14 (4.96%) Greenfield Project
2 13 (4.61%) Cloud Native
3 10 (3.55%) Hackathon
4 7 (2.48%) Embedded Systems
5 6 (2.13%) Reinsurance
6 5 (1.77%) PMI
7 4 (1.42%) Data Centre
7 4 (1.42%) Distributed Systems
7 4 (1.42%) Legacy Systems
7 4 (1.42%) Management Information System
7 4 (1.42%) Product Ownership
8 3 (1.06%) Algorithms
8 3 (1.06%) Client/Server
8 3 (1.06%) Educational Technology
8 3 (1.06%) IVR
8 3 (1.06%) Replication
9 2 (0.71%) Blockchain
9 2 (0.71%) FlexPod
9 2 (0.71%) Hybrid Cloud
Operating Systems
1 22 (7.80%) Windows
2 3 (1.06%) Windows 10
2 3 (1.06%) Windows Server
3 2 (0.71%) Android
3 2 (0.71%) Apple iOS
3 2 (0.71%) Linux
Processes & Methodologies
1 282 (100.00%) Roadmaps
2 51 (18.09%) Agile
3 49 (17.38%) Technical Leadership
4 45 (15.96%) CI/CD
5 35 (12.41%) DevOps
5 35 (12.41%) Mentoring
6 34 (12.06%) Problem-Solving
7 33 (11.70%) Stakeholder Management
8 25 (8.87%) Business Strategy
8 25 (8.87%) Software Engineering
9 24 (8.51%) Code Quality
10 22 (7.80%) Project Delivery
10 22 (7.80%) Technology Strategy
11 20 (7.09%) IT Strategy
11 20 (7.09%) Technical Architecture
12 19 (6.74%) Coaching
13 18 (6.38%) Customer Service
13 18 (6.38%) ITIL
14 17 (6.03%) Analytical Thinking
14 17 (6.03%) TDD
Programming Languages
1 31 (10.99%) Python
2 25 (8.87%) JavaScript
3 24 (8.51%) Java
4 23 (8.16%) C#
5 22 (7.80%) PowerShell
6 15 (5.32%) TypeScript
7 14 (4.96%) C++
8 12 (4.26%) SQL
9 11 (3.90%) PHP
10 4 (1.42%) Bash
10 4 (1.42%) C
11 2 (0.71%) Apex Code
11 2 (0.71%) R
11 2 (0.71%) Ruby
11 2 (0.71%) Tcl
12 1 (0.35%) Delphi
12 1 (0.35%) Go
12 1 (0.35%) MATLAB
12 1 (0.35%) PL/SQL
Qualifications
1 33 (11.70%) Degree
2 24 (8.51%) Security Cleared
3 20 (7.09%) SC Cleared
4 7 (2.48%) TOGAF Certification
5 6 (2.13%) Oracle Certification
6 5 (1.77%) PMI Certification
7 4 (1.42%) ITIL Foundation Certificate
7 4 (1.42%) Master's Degree
8 3 (1.06%) BPSS Clearance
8 3 (1.06%) Computer Science Degree
9 2 (0.71%) Azure Certification
9 2 (0.71%) ITIL Certification
10 1 (0.35%) DBS Check
10 1 (0.35%) Microsoft Certification
10 1 (0.35%) PhD
Quality Assurance & Compliance
1 6 (2.13%) GAAP
1 6 (2.13%) IFRS
1 6 (2.13%) QA
1 6 (2.13%) SLA
2 5 (1.77%) Accessibility
3 3 (1.06%) Cyber Essentials
3 3 (1.06%) ISO/IEC 27001
4 2 (0.71%) Data Quality
5 1 (0.35%) ISO 26262
5 1 (0.35%) PMO
System Software
1 19 (6.74%) Active Directory
2 5 (1.77%) Docker
2 5 (1.77%) Embedded Firmware
2 5 (1.77%) Firmware
3 3 (1.06%) Hyper-V
3 3 (1.06%) VMware Infrastructure
4 2 (0.71%) Virtual Machines
Systems Management
1 9 (3.19%) Ansible
2 8 (2.84%) Terraform
3 7 (2.48%) Microsoft Intune
4 5 (1.77%) Kubernetes
5 4 (1.42%) SCCM
6 2 (0.71%) Single Sign-On
7 1 (0.35%) Consul
7 1 (0.35%) Oracle Identity Management
Vendors
1 118 (41.84%) Microsoft
2 12 (4.26%) SAP
3 8 (2.84%) Salesforce
4 7 (2.48%) Google
4 7 (2.48%) Oracle
5 6 (2.13%) PeopleSoft
6 5 (1.77%) VMware
7 4 (1.42%) Cisco
7 4 (1.42%) ServiceNow
8 3 (1.06%) Fortinet
9 2 (0.71%) Cognos
9 2 (0.71%) Dell
9 2 (0.71%) F5
9 2 (0.71%) Guidewire
9 2 (0.71%) HP
9 2 (0.71%) NetApp
9 2 (0.71%) OpenAI
10 1 (0.35%) Meraki
10 1 (0.35%) Riverbed
10 1 (0.35%) Sitecore