Computer Science Jobs with Work from Home Options

Computer Science
UK > Work from Home

The table below provides summary statistics for permanent job vacancies with an option to work from home (WFH) and a requirement for Computer Science skills. Included is a benchmarking guide to the salaries offered in vacancies that have cited Computer Science over the 6 months to 1 December 2023 with a comparison to the same period in the previous 2 years.

6 months to
1 Dec 2023
Same period 2022 Same period 2021
Rank 71 63 57
Rank change year-on-year -8 -6 +38
Permanent jobs citing Computer Science 1,031 2,734 2,753
As % of all permanent jobs with a WFH option 4.53% 4.97% 5.44%
As % of the Processes & Methodologies category 4.75% 5.17% 5.67%
Number of salaries quoted 689 1,462 1,493
10th Percentile £36,250 £33,750 £31,250
25th Percentile £50,000 £46,250 £41,250
Median annual salary (50th Percentile) £65,000 £62,500 £57,500
Median % change year-on-year +4.00% +8.70% -
75th Percentile £87,500 £86,250 £78,750
90th Percentile £115,000 £108,750 £95,000
UK median annual salary £65,000 £60,000 £60,000
% change year-on-year +8.33% - +4.35%

All Process and Methodology Skills
Work from Home

Computer Science is in the Processes and Methodologies category. The following table is for comparison with the above and provides summary statistics for all permanent job vacancies with a WFH option and a requirement for process or methodology skills.

Permanent vacancies with a requirement for process or methodology skills 21,722 52,931 48,590
As % of all permanent jobs with a WFH option 95.40% 96.16% 96.04%
Number of salaries quoted 15,948 36,786 36,186
10th Percentile £36,500 £37,500 £35,745
25th Percentile £46,306 £47,500 £43,750
Median annual salary (50th Percentile) £62,500 £62,500 £60,000
Median % change year-on-year - +4.17% +9.09%
75th Percentile £80,070 £81,250 £77,500
90th Percentile £97,500 £97,500 £93,000
UK median annual salary £60,000 £60,000 £60,000
% change year-on-year - - +9.09%

Computer Science
Trend for Jobs with a WFH Option

Job vacancies with a work from home option citing Computer Science as a proportion of all IT jobs advertised.
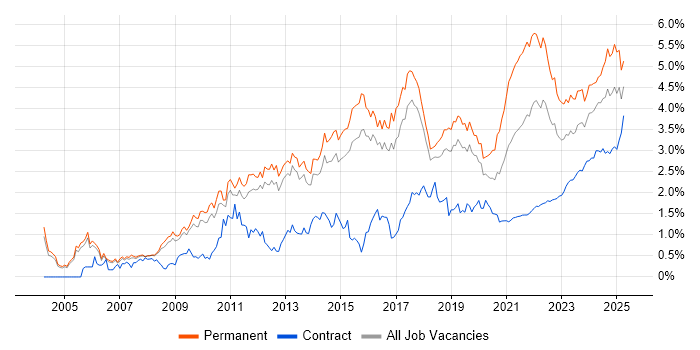
Computer Science trend for jobs with a WFH option

Computer Science
Salary Trend for Jobs with a WFH Option

3-month moving average salary quoted in job vacancies with a work from home option citing Computer Science.

Computer Science salary trend for jobs with a WFH option

Computer Science
Salary Histogram for Jobs with a WFH Option

Salary distribution for jobs with a work from home option citing Computer Science over the 6 months to 1 December 2023.

Computer Science salary histogram for jobs with a WFH option

Computer Science
Co-occurring Skills and Capabilities with WFH Options by Category

The follow tables expand on the table above by listing co-occurrences grouped by category. The same employment type, locality and period is covered with up to 20 co-occurrences shown in each of the following categories:

Application Platforms
1 85 (8.24%) SAS
2 22 (2.13%) Apache
3 19 (1.84%) Apache Airflow
4 18 (1.75%) Apache Spark
5 16 (1.55%) Jupyter
6 10 (0.97%) Confluence
7 8 (0.78%) Luigi
7 8 (0.78%) SharePoint
7 8 (0.78%) Tomcat
8 4 (0.39%) SharePoint Server
8 4 (0.39%) ThingWorx
8 4 (0.39%) WordPress
9 2 (0.19%) Apache Solr
9 2 (0.19%) IIS
9 2 (0.19%) JBoss
9 2 (0.19%) nginx
9 2 (0.19%) NServiceBus
10 1 (0.097%) CICS
10 1 (0.097%) MS Exchange
10 1 (0.097%) Oracle Workflow
Applications
1 18 (1.75%) Microsoft Office
2 11 (1.07%) Microsoft Excel
3 8 (0.78%) Adobe Creative Suite
4 3 (0.29%) 3ds Max
4 3 (0.29%) Blender
4 3 (0.29%) Maya
4 3 (0.29%) MS Visio
4 3 (0.29%) Simulink
5 2 (0.19%) ArcView
5 2 (0.19%) AutoCAD
5 2 (0.19%) Sketch
5 2 (0.19%) UXPin
5 2 (0.19%) Zeplin
6 1 (0.097%) Microsoft PowerPoint
6 1 (0.097%) Microsoft Project
6 1 (0.097%) SPSS
6 1 (0.097%) Trello
Business Applications
1 19 (1.84%) NetSuite
2 5 (0.48%) ProductWriter
3 2 (0.19%) Dynamics CRM
3 2 (0.19%) SAP S/4HANA
3 2 (0.19%) SAP SCM
4 1 (0.097%) Alphatax
4 1 (0.097%) Distributed Ledger
4 1 (0.097%) Endur
4 1 (0.097%) Oracle 11i
4 1 (0.097%) Oracle Applications
4 1 (0.097%) Oracle Assets
4 1 (0.097%) Oracle Cash Management
4 1 (0.097%) Oracle EBS
4 1 (0.097%) Oracle E-Business Tax
4 1 (0.097%) Oracle Payables
4 1 (0.097%) Oracle Receivables
4 1 (0.097%) R3 Corda
4 1 (0.097%) SAP ERP
4 1 (0.097%) SAP PP
4 1 (0.097%) Sparx Enterprise Architect
Cloud Services
1 219 (21.24%) AWS
2 195 (18.91%) Azure
3 93 (9.02%) GCP
4 70 (6.79%) GitHub
5 66 (6.40%) SaaS
6 47 (4.56%) Azure DevOps
7 44 (4.27%) Power Platform
8 34 (3.30%) Serverless
9 31 (3.01%) Amazon EC2
10 29 (2.81%) Microsoft 365
11 20 (1.94%) Cloud Computing
11 20 (1.94%) Figma
12 18 (1.75%) AWS Lambda
13 15 (1.45%) OpenShift
14 12 (1.16%) WhatsApp
15 11 (1.07%) PaaS
16 9 (0.87%) Amazon S3
16 9 (0.87%) Entra ID
16 9 (0.87%) IaaS
17 8 (0.78%) Amazon SQS
Communications & Networking
1 36 (3.49%) WAN
2 31 (3.01%) Firewall
3 30 (2.91%) SD-WAN
4 29 (2.81%) 5G
5 28 (2.72%) TCP/IP
6 26 (2.52%) Wireless
7 18 (1.75%) Network Security
8 16 (1.55%) Internet
9 15 (1.45%) Intrusion Detection
10 12 (1.16%) VPN
11 10 (0.97%) DNS
12 8 (0.78%) DHCP
12 8 (0.78%) IPv4
13 6 (0.58%) Unified Communications
14 5 (0.48%) SAN
14 5 (0.48%) SNMP
15 4 (0.39%) Ethernet
15 4 (0.39%) SSL
16 3 (0.29%) IPFIX
17 2 (0.19%) HTTP
Database & Business Intelligence
1 83 (8.05%) Base SAS
2 75 (7.27%) Big Data
3 74 (7.18%) Metadata
4 67 (6.50%) SQL Server
5 61 (5.92%) MySQL
6 40 (3.88%) Data Warehouse
7 39 (3.78%) Data Lake
7 39 (3.78%) Power BI
8 31 (3.01%) Amazon RDS
9 29 (2.81%) Relational Database
10 28 (2.72%) NoSQL
11 25 (2.42%) PostgreSQL
12 19 (1.84%) Tableau
13 15 (1.45%) BigQuery
14 12 (1.16%) SQL Server Integration Services
15 11 (1.07%) Elasticsearch
16 10 (0.97%) Redis
17 9 (0.87%) MongoDB
18 8 (0.78%) DynamoDB
18 8 (0.78%) Hadoop
Development Applications
1 109 (10.57%) Git
2 64 (6.21%) Jenkins
3 41 (3.98%) Maven
4 27 (2.62%) JIRA
5 26 (2.52%) IntelliJ
6 18 (1.75%) Visual Studio
7 10 (0.97%) Postman
8 9 (0.87%) CMake
9 7 (0.68%) Cucumber
9 7 (0.68%) GitLab
9 7 (0.68%) Rational DOORS
9 7 (0.68%) Subversion
10 6 (0.58%) Selenium
11 5 (0.48%) Cypress.io
11 5 (0.48%) Oracle Forms
11 5 (0.48%) Serilog
12 4 (0.39%) TeamCity
12 4 (0.39%) TestComplete
12 4 (0.39%) Visual Studio Code
12 4 (0.39%) Visual Website Optimizer
General
1 355 (34.43%) Social Skills
2 217 (21.05%) Finance
3 168 (16.29%) Inclusion and Diversity
4 141 (13.68%) Analytical Skills
5 91 (8.83%) Pharmaceutical
6 59 (5.72%) Marketing
7 54 (5.24%) Retail
8 48 (4.66%) Public Sector
9 40 (3.88%) Presentation Skills
10 37 (3.59%) Aerospace
11 35 (3.39%) Games
12 33 (3.20%) Manufacturing
13 27 (2.62%) Legal
14 24 (2.33%) Banking
15 23 (2.23%) Electronics
16 22 (2.13%) Organisational Skills
17 18 (1.75%) Front Office
18 15 (1.45%) Telecoms
19 13 (1.26%) Military
20 11 (1.07%) Financial Institution
Job Titles
1 264 (25.61%) Senior
2 245 (23.76%) Developer
3 162 (15.71%) Software Engineer
4 82 (7.95%) Senior Developer
5 75 (7.27%) Lead
6 70 (6.79%) Programmer
7 66 (6.40%) SAS Programmer
7 66 (6.40%) SAS Statistical Programmer
7 66 (6.40%) Statistical Programmer
8 59 (5.72%) Software Developer
9 57 (5.53%) Data Engineer
10 56 (5.43%) Java Developer
11 52 (5.04%) Senior Software Engineer
12 50 (4.85%) Architect
13 46 (4.46%) DevOps Engineer
14 45 (4.36%) Analyst
14 45 (4.36%) Data Scientist
15 43 (4.17%) Senior Java Developer
16 35 (3.39%) Senior Programmer
16 35 (3.39%) Senior SAS Programmer
Libraries, Frameworks & Software Standards
1 131 (12.71%) HTML
2 92 (8.92%) .NET
3 89 (8.63%) CSS
4 82 (7.95%) XML
5 76 (7.37%) React
6 44 (4.27%) AngularJS
7 43 (4.17%) RESTful
8 37 (3.59%) ASP.NET
9 30 (2.91%) Redux
10 28 (2.72%) React Native
11 27 (2.62%) REST
11 27 (2.62%) SOAP
12 26 (2.52%) J2EE
12 26 (2.52%) jOOQ
13 25 (2.42%) Node.js
14 24 (2.33%) Unity (Game Engine)
15 23 (2.23%) PyTorch
16 22 (2.13%) Unreal Engine
17 21 (2.04%) Kafka
17 21 (2.04%) Pandas
Miscellaneous
1 118 (11.45%) Algorithms
2 89 (8.63%) Onboarding
3 87 (8.44%) Life Science
4 83 (8.05%) Self-Motivation
5 73 (7.08%) Greenfield Project
6 43 (4.17%) Management Information System
7 39 (3.78%) Cyberattack
8 37 (3.59%) Data Structures
9 23 (2.23%) Mobile App
9 23 (2.23%) Virtual Team
10 22 (2.13%) Legacy Systems
10 22 (2.13%) Product Ownership
11 20 (1.94%) Distributed Systems
12 18 (1.75%) Handset
12 18 (1.75%) Mali
12 18 (1.75%) Ray Tracing
12 18 (1.75%) SIMD
12 18 (1.75%) Smartphone
13 16 (1.55%) IoT
14 15 (1.45%) Public Cloud
Operating Systems
1 133 (12.90%) Linux
2 78 (7.57%) Windows
3 33 (3.20%) Mac OS
4 25 (2.42%) Windows Server
5 24 (2.33%) Android
6 21 (2.04%) Unix
7 17 (1.65%) Windows Server 2016
8 16 (1.55%) Windows Server 2019
9 15 (1.45%) Mac OS X
10 13 (1.26%) Windows 10
11 6 (0.58%) Debian
11 6 (0.58%) Windows Server 2012
12 5 (0.48%) Apple iOS
12 5 (0.48%) FreeRTOS
13 3 (0.29%) VMS
14 2 (0.19%) Kali Linux
15 1 (0.097%) Ubuntu
15 1 (0.097%) zOS
Processes & Methodologies
1 446 (43.26%) Problem-Solving
2 315 (30.55%) Software Engineering
3 313 (30.36%) Mathematics
4 269 (26.09%) Agile
5 188 (18.23%) DevOps
6 171 (16.59%) Statistics
7 131 (12.71%) Collaborative Working
8 129 (12.51%) Mentoring
9 124 (12.03%) Project Management
10 120 (11.64%) Data Science
11 112 (10.86%) Creative Thinking
11 112 (10.86%) Decision-Making
12 111 (10.77%) Machine Learning
13 107 (10.38%) CI/CD
14 105 (10.18%) Analytics
15 99 (9.60%) Visualisation
16 97 (9.41%) Line Management
17 90 (8.73%) Artificial Intelligence
17 90 (8.73%) Cybersecurity
17 90 (8.73%) Data Analysis
Programming Languages
1 328 (31.81%) Python
2 222 (21.53%) SQL
3 186 (18.04%) JavaScript
4 182 (17.65%) Java
5 145 (14.06%) C#
6 132 (12.80%) C++
7 95 (9.21%) Bash
8 83 (8.05%) SAS Macro
9 75 (7.27%) PowerShell
10 74 (7.18%) C
11 47 (4.56%) R
12 28 (2.72%) Ruby
13 27 (2.62%) Go
14 25 (2.42%) Perl
15 22 (2.13%) Rust
15 22 (2.13%) TypeScript
15 22 (2.13%) VB.NET
16 19 (1.84%) PHP
17 18 (1.75%) Embedded C
18 11 (1.07%) Kotlin
Qualifications
1 922 (89.43%) Degree
2 482 (46.75%) Computer Science Degree
3 143 (13.87%) Security Cleared
4 109 (10.57%) Master's Degree
5 84 (8.15%) SC Cleared
6 64 (6.21%) Numerate Degree
7 48 (4.66%) DV Cleared
8 32 (3.10%) CISSP
9 21 (2.04%) Azure Certification
9 21 (2.04%) PhD
10 20 (1.94%) Microsoft Certification
11 18 (1.75%) HND
12 17 (1.65%) CISM
13 12 (1.16%) AWS Certification
14 10 (0.97%) Cisco Certification
15 9 (0.87%) Chartered Engineer
16 8 (0.78%) PMP
17 7 (0.68%) CEH
17 7 (0.68%) MCSA
18 5 (0.48%) CRISC
Quality Assurance & Compliance
1 116 (11.25%) QA
2 83 (8.05%) CDISC
3 29 (2.81%) Data Quality
4 27 (2.62%) ISO/IEC 27001
5 24 (2.33%) PMO
6 18 (1.75%) NIST
7 13 (1.26%) NCSC
8 12 (1.16%) PCI DSS
9 10 (0.97%) Cyber Essentials
10 9 (0.87%) Accessibility
10 9 (0.87%) JSP 440
11 8 (0.78%) GDPR
12 7 (0.68%) RMADS
13 5 (0.48%) DO-178B
13 5 (0.48%) IEC 61508
13 5 (0.48%) SLA
14 3 (0.29%) Cyber Essentials PLUS
15 2 (0.19%) ISO/IEC 15288
15 2 (0.19%) MISRA
15 2 (0.19%) MISRA C
System Software
1 160 (15.52%) Docker
2 36 (3.49%) Firmware
3 30 (2.91%) Active Directory
4 28 (2.72%) VMware Infrastructure
5 22 (2.13%) Hyper-V
6 10 (0.97%) Embedded Firmware
7 6 (0.58%) Virtual Machines
8 4 (0.39%) Virtual Desktop
9 2 (0.19%) BitLocker
9 2 (0.19%) VMware ESXi
10 1 (0.097%) KVM
10 1 (0.097%) QEMU
10 1 (0.097%) Slurm Workload Manager
Systems Management
1 112 (10.86%) Kubernetes
2 54 (5.24%) Terraform
3 45 (4.36%) Ansible
4 9 (0.87%) Puppet
5 4 (0.39%) Grafana
5 4 (0.39%) vRealize
5 4 (0.39%) vRealize Orchestrator
6 3 (0.29%) Progress Chef
6 3 (0.29%) WSUS
7 2 (0.19%) Microsoft Intune
7 2 (0.19%) MIIS
7 2 (0.19%) Nmap
7 2 (0.19%) SCCM
7 2 (0.19%) Single Sign-On
8 1 (0.097%) Consul
8 1 (0.097%) FortiGate
8 1 (0.097%) Norton AntiVirus
8 1 (0.097%) Oozie
8 1 (0.097%) SCOM
8 1 (0.097%) SolarWinds Orion
Vendors
1 101 (9.80%) Microsoft
2 43 (4.17%) Google
3 30 (2.91%) VMware
4 29 (2.81%) Oracle
5 17 (1.65%) Databricks
5 17 (1.65%) SAP
6 12 (1.16%) LogicMonitor
6 12 (1.16%) Splunk
7 11 (1.07%) Adobe
7 11 (1.07%) Okta
8 8 (0.78%) Salesforce
9 7 (0.68%) Atlassian
9 7 (0.68%) Citrix
10 6 (0.58%) Cisco
10 6 (0.58%) Dell
10 6 (0.58%) Teradata
11 5 (0.48%) Confluent
12 4 (0.39%) Optimizely
12 4 (0.39%) PTC
12 4 (0.39%) Xilinx