Security Cleared Jobs with Hybrid/Remote/WFH Options

Security Clearance
UK > Work from Home

The table below provides summary statistics for remote or hybrid work with a requirement for Security Cleared qualifications. It includes a benchmarking guide to the salaries offered over the 6 months leading up to 4 July 2025, comparing them to the same period in the previous two years.

6 months to
4 Jul 2025
Same period 2024 Same period 2023
Rank 53 22 20
Rank change year-on-year -31 -2 +51
Permanent jobs citing Security Cleared 1,096 3,089 3,664
As % of all permanent jobs with a WFH option 5.35% 9.03% 10.17%
As % of the Qualifications category 14.60% 32.67% 38.14%
Number of salaries quoted 561 1,742 1,620
10th Percentile £45,608 £40,000 £36,557
25th Percentile £52,500 £48,750 £45,300
Median annual salary (50th Percentile) £65,000 £60,000 £62,500
Median % change year-on-year +8.33% -4.00% +4.17%
75th Percentile £77,500 £75,000 £77,500
90th Percentile £93,750 £85,000 £87,500
UK median annual salary £62,500 £57,500 £60,000
% change year-on-year +8.70% -4.17% +9.09%

All Academic and Professional Certifications
Work from Home

Security Cleared falls under the Academic Qualifications and Professional Certifications category. For comparison with the information above, the following table provides summary statistics for all permanent job vacancies with remote or hybrid options requiring academic qualifications or professional certifications.

Permanent vacancies requiring academic qualifications or professional certifications 7,508 9,454 9,607
As % of all permanent jobs with a WFH option 36.65% 27.64% 26.68%
Number of salaries quoted 3,051 5,706 5,913
10th Percentile £30,000 £32,500 £35,000
25th Percentile £47,000 £42,500 £45,000
Median annual salary (50th Percentile) £57,500 £57,500 £60,000
Median % change year-on-year - -4.17% +2.65%
75th Percentile £70,600 £72,500 £77,500
90th Percentile £85,000 £86,250 £95,000
UK median annual salary £55,000 £53,500 £60,000
% change year-on-year +2.80% -10.83% +9.09%

Security Cleared
Trend for Jobs with a WFH Option

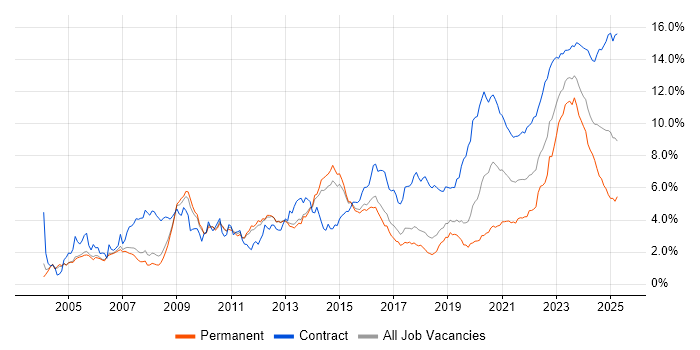
Job vacancies with remote working options citing Security Cleared as a proportion of all IT jobs advertised.

Security Cleared trend for jobs with Hybrid/Remote/WFH options

Security Cleared
Salary Trend for Jobs with a WFH Option

3-month moving average salary quoted in job vacancies with remote working options citing Security Cleared.

Security Cleared salary trend for jobs with a WFH option

Security Cleared
Salary Histogram for Jobs with a WFH Option

Salary distribution for jobs with remote working options citing Security Cleared over the 6 months to 4 July 2025.

Security Cleared salary histogram for jobs with a WFH option

Security Cleared
Co-occurring Skills and Capabilities with WFH Options by Category

The follow tables expand on the table above by listing co-occurrences grouped by category. The same employment type, locality and period is covered with up to 20 co-occurrences shown in each of the following categories:

Application Platforms
1 23 (2.10%) Jupyter
2 17 (1.55%) SharePoint
3 16 (1.46%) Microsoft Exchange
4 8 (0.73%) Confluence
5 6 (0.55%) Appian
6 2 (0.18%) Apache Spark
6 2 (0.18%) nginx
6 2 (0.18%) Oracle Workflow
6 2 (0.18%) Skype for Business
6 2 (0.18%) WordPress
7 1 (0.091%) Alfresco
7 1 (0.091%) Apache
7 1 (0.091%) Drupal
7 1 (0.091%) Moodle
Applications
1 21 (1.92%) Microsoft Office
2 8 (0.73%) Adobe XD
3 6 (0.55%) Microsoft Excel
3 6 (0.55%) Microsoft PowerPoint
4 4 (0.36%) MS Visio
4 4 (0.36%) Revit
4 4 (0.36%) Simulink
5 3 (0.27%) AutoCAD
5 3 (0.27%) EPLAN
6 2 (0.18%) Microsoft Project
6 2 (0.18%) Oracle Smart View
6 2 (0.18%) Spreadsheet
7 1 (0.091%) Adobe Creative Suite
7 1 (0.091%) Chatbot
7 1 (0.091%) InVision
7 1 (0.091%) Sketch
Business Applications
1 25 (2.28%) Sparx Enterprise Architect
2 19 (1.73%) SAP S/4HANA
3 7 (0.64%) Q-Pulse
4 4 (0.36%) Oracle ERP
4 4 (0.36%) SAP BPC
4 4 (0.36%) SAP HR
4 4 (0.36%) SAP SCM
5 3 (0.27%) SAP PP
6 2 (0.18%) Oracle Financials
6 2 (0.18%) Oracle General Ledger
6 2 (0.18%) Sage 200
6 2 (0.18%) SAP APO
6 2 (0.18%) SAP CO
6 2 (0.18%) SAP EWM
6 2 (0.18%) SAP FI
6 2 (0.18%) SAP FI/CO
6 2 (0.18%) SAP GRC
6 2 (0.18%) SAP LE
6 2 (0.18%) SAP MM
6 2 (0.18%) SAP QM
Cloud Services
1 380 (34.67%) AWS
2 379 (34.58%) Azure
3 220 (20.07%) GCP
4 85 (7.76%) AWS CloudFormation
5 56 (5.11%) Amazon EKS
6 51 (4.65%) Microsoft 365
7 37 (3.38%) Azure DevOps
8 36 (3.28%) Entra ID
9 32 (2.92%) Power Platform
9 32 (2.92%) Serverless
10 28 (2.55%) AWS Lambda
11 19 (1.73%) Dynamics 365
12 18 (1.64%) SaaS
13 16 (1.46%) Amazon ECS
13 16 (1.46%) GitHub
14 15 (1.37%) IaaS
15 14 (1.28%) GitHub Actions
15 14 (1.28%) PaaS
16 13 (1.19%) OCI
17 12 (1.09%) Power Automate
Communications & Networking
1 43 (3.92%) Network Security
2 38 (3.47%) Firewall
3 35 (3.19%) Wireless
4 33 (3.01%) VPN
5 32 (2.92%) TCP/IP
6 29 (2.65%) Software-Defined Radio
7 24 (2.19%) WAN
8 21 (1.92%) LAN
9 19 (1.73%) DNS
10 15 (1.37%) BGP
11 14 (1.28%) Junos
11 14 (1.28%) Wi-Fi
12 13 (1.19%) OSPF
13 12 (1.09%) DHCP
13 12 (1.09%) SAN
14 9 (0.82%) IPsec
14 9 (0.82%) VLAN
15 7 (0.64%) Cisco ASA
15 7 (0.64%) SD-WAN
16 6 (0.55%) NAS
Database & Business Intelligence
1 64 (5.84%) Elasticsearch
2 49 (4.47%) Big Data
3 30 (2.74%) PostgreSQL
4 21 (1.92%) Power BI
5 19 (1.73%) SQL Server
6 18 (1.64%) Amazon RDS
6 18 (1.64%) MongoDB
7 16 (1.46%) Redis
8 9 (0.82%) MySQL
8 9 (0.82%) NoSQL
9 5 (0.46%) Relational Database
10 4 (0.36%) Data Warehouse
10 4 (0.36%) Metadata
11 3 (0.27%) Metadata Repository
11 3 (0.27%) Pentaho
12 2 (0.18%) DB2
12 2 (0.18%) DynamoDB
12 2 (0.18%) Neo4j
12 2 (0.18%) Oracle Exadata
12 2 (0.18%) Triplestore
Development Applications
1 48 (4.38%) Git
2 22 (2.01%) Jenkins
3 19 (1.73%) JIRA
4 14 (1.28%) GitLab
5 12 (1.09%) SonarQube
6 8 (0.73%) Selenium
7 7 (0.64%) Axure RP
7 7 (0.64%) Balsamiq
7 7 (0.64%) JMeter
8 6 (0.55%) Cypress.io
9 5 (0.46%) JUnit
10 4 (0.36%) Cucumber
10 4 (0.36%) Mockito
10 4 (0.36%) Subversion
11 3 (0.27%) Artifactory
11 3 (0.27%) Babel
11 3 (0.27%) LabVIEW
11 3 (0.27%) Locust
11 3 (0.27%) TeamCity
11 3 (0.27%) webpack
General
1 356 (32.48%) Inclusion and Diversity
2 257 (23.45%) Finance
3 252 (22.99%) Social Skills
4 163 (14.87%) Public Sector
5 155 (14.14%) Analytical Skills
6 57 (5.20%) Electronics
7 51 (4.65%) Telecoms
8 44 (4.01%) Marketing
9 43 (3.92%) Law
10 42 (3.83%) Manufacturing
11 32 (2.92%) Aerospace
12 30 (2.74%) Presentation Skills
13 24 (2.19%) Military
14 19 (1.73%) Legal
15 17 (1.55%) Back Office
15 17 (1.55%) Influencing Skills
15 17 (1.55%) Retail
16 10 (0.91%) Aviation
16 10 (0.91%) Police
17 9 (0.82%) Documentation Skills
Job Titles
1 325 (29.65%) Senior
2 232 (21.17%) Software Engineer
3 184 (16.79%) Senior Software Engineer
4 131 (11.95%) Developer
5 127 (11.59%) Architect
6 79 (7.21%) Consultant
7 65 (5.93%) Systems Engineer
8 64 (5.84%) Lead
9 58 (5.29%) Software Developer
10 47 (4.29%) Data Scientist
11 41 (3.74%) Infrastructure Engineer
12 33 (3.01%) Solutions Architect
13 32 (2.92%) Embedded Engineer
14 31 (2.83%) Senior Developer
15 30 (2.74%) DevOps Engineer
16 28 (2.55%) Embedded Software Engineer
17 27 (2.46%) Security Architect
18 26 (2.37%) Lead Architect
19 24 (2.19%) Analyst
20 23 (2.10%) Cloud Architect
Libraries, Frameworks & Software Standards
1 249 (22.72%) Node.js
2 245 (22.35%) .NET
3 49 (4.47%) Pandas
4 27 (2.46%) React
5 26 (2.37%) Kafka
6 24 (2.19%) OLE
7 23 (2.10%) RESTful
8 22 (2.01%) Elastic Stack
9 20 (1.82%) HTML
10 18 (1.64%) Django
11 17 (1.55%) CSS
12 15 (1.37%) AngularJS
13 13 (1.19%) Spring
14 12 (1.09%) REST
14 12 (1.09%) SAP Fiori
15 11 (1.00%) Spring Boot
15 11 (1.00%) XML
16 9 (0.82%) Middleware
16 9 (0.82%) RabbitMQ
17 8 (0.73%) OAuth
Miscellaneous
1 274 (25.00%) Cyberattack
2 197 (17.97%) Self-Motivation
3 179 (16.33%) Linux Command Line
4 112 (10.22%) e-Learning
5 59 (5.38%) Algorithms
6 48 (4.38%) Management Information System
7 37 (3.38%) Data Centre
8 30 (2.74%) MicroBlaze
9 28 (2.55%) Embedded Systems
10 26 (2.37%) RISC-V
11 24 (2.19%) Product Ownership
12 23 (2.10%) FPGA
13 21 (1.92%) Cloud Native
13 21 (1.92%) Onboarding
14 19 (1.73%) PMI
15 16 (1.46%) Security Posture
16 15 (1.37%) Distributed Systems
17 14 (1.28%) Hybrid Cloud
18 12 (1.09%) Driving Licence
18 12 (1.09%) NHS
Operating Systems
1 355 (32.39%) Linux
2 77 (7.03%) Windows
3 54 (4.93%) Android
4 33 (3.01%) Unix
5 27 (2.46%) Windows Server
6 26 (2.37%) Embedded Linux
7 22 (2.01%) Windows 10
8 10 (0.91%) Windows Server 2019
9 9 (0.82%) Rocky
10 7 (0.64%) Red Hat Enterprise Linux
11 4 (0.36%) CentOS
11 4 (0.36%) HPUX
11 4 (0.36%) Oracle Linux
11 4 (0.36%) Solaris
12 3 (0.27%) Windows Server 2016
13 2 (0.18%) Kali Linux
13 2 (0.18%) Windows Server 2003
14 1 (0.091%) Apple iOS
14 1 (0.091%) Mac OS X
Processes & Methodologies
1 419 (38.23%) Agile
2 363 (33.12%) Software Engineering
3 299 (27.28%) Mentoring
4 249 (22.72%) Microservices
5 237 (21.62%) Machine Learning
6 212 (19.34%) Cloud Security
7 208 (18.98%) Scrum
8 204 (18.61%) User Experience
9 194 (17.70%) Site Reliability Engineering
10 192 (17.52%) Data Engineering
11 164 (14.96%) Problem-Solving
12 159 (14.51%) Cybersecurity
13 147 (13.41%) DevOps
14 135 (12.32%) CI/CD
15 124 (11.31%) Mathematics
16 113 (10.31%) Innovative Thinking
17 99 (9.03%) Computer Science
18 98 (8.94%) Continuous Improvement
19 97 (8.85%) Containerisation
20 95 (8.67%) Statistics
Programming Languages
1 343 (31.30%) Python
2 316 (28.83%) Java
3 307 (28.01%) JavaScript
4 270 (24.64%) C++
5 234 (21.35%) Go
6 227 (20.71%) Rust
7 61 (5.57%) SQL
8 43 (3.92%) C
9 29 (2.65%) C#
9 29 (2.65%) TypeScript
10 25 (2.28%) PowerShell
11 24 (2.19%) Bash
12 10 (0.91%) Perl
13 8 (0.73%) PL/SQL
13 8 (0.73%) Ruby
14 7 (0.64%) Fortran
14 7 (0.64%) Shell Script
15 6 (0.55%) MATLAB
15 6 (0.55%) R
16 5 (0.46%) PHP
Qualifications
1 573 (52.28%) SC Cleared
2 463 (42.24%) DV Cleared
3 224 (20.44%) AWS Certification
4 214 (19.53%) Degree
5 194 (17.70%) AWS Certified Solutions Architect
6 178 (16.24%) AWS Certified Developer
7 60 (5.47%) Computer Science Degree
8 55 (5.02%) Cisco Certification
9 43 (3.92%) CCNP
10 42 (3.83%) CISSP
11 34 (3.10%) BPSS Clearance
12 24 (2.19%) CCNA
13 23 (2.10%) Numerate Degree
14 20 (1.82%) CISM
14 20 (1.82%) PMI Certification
15 18 (1.64%) CTC Cleared
15 18 (1.64%) RHCSA
16 17 (1.55%) TOGAF Certification
17 14 (1.28%) Azure Certification
17 14 (1.28%) Master's Degree
Quality Assurance & Compliance
1 59 (5.38%) ISO/IEC 27001
2 43 (3.92%) NIST
3 38 (3.47%) QA
4 35 (3.19%) GDPR
5 31 (2.83%) NCSC
6 27 (2.46%) SLA
7 20 (1.82%) Accessibility
8 17 (1.55%) HIPAA
9 11 (1.00%) GRC
10 10 (0.91%) JSP 440
10 10 (0.91%) WCAG
11 9 (0.82%) Data Quality
12 8 (0.73%) Def Stans
13 7 (0.64%) PCI DSS
13 7 (0.64%) SOC 2
14 6 (0.55%) ISO/IEC 27002 (supersedes ISO/IEC 17799)
15 5 (0.46%) ISO 9001
15 5 (0.46%) NIST 800
16 4 (0.36%) RMADS
17 3 (0.27%) IEC 61508
System Software
1 143 (13.05%) Docker
2 42 (3.83%) Firmware
3 31 (2.83%) Active Directory
4 30 (2.74%) Embedded Firmware
5 18 (1.64%) VMware Infrastructure
6 10 (0.91%) Hyper-V
7 8 (0.73%) Virtual Machines
8 6 (0.55%) vSphere
9 4 (0.36%) IAG
10 3 (0.27%) Virtual Desktop
10 3 (0.27%) VMware ESXi
11 1 (0.091%) Virtual Servers
11 1 (0.091%) VMware NSX
Systems Management
1 140 (12.77%) Kubernetes
2 111 (10.13%) Terraform
3 84 (7.66%) Ansible
4 23 (2.10%) Grafana
4 23 (2.10%) Prometheus
5 11 (1.00%) AWS Copilot
6 7 (0.64%) Functional Safety
7 6 (0.55%) Microsoft Intune
8 5 (0.46%) Puppet
8 5 (0.46%) SCCM
9 4 (0.36%) Argo
9 4 (0.36%) FortiGate
9 4 (0.36%) Kibana
9 4 (0.36%) SCOM
9 4 (0.36%) Single Sign-On
10 3 (0.27%) Active Directory Federation Services
10 3 (0.27%) Computer Emergency Response Teams
10 3 (0.27%) Packer
10 3 (0.27%) Progress Chef
10 3 (0.27%) vCenter Server
Vendors
1 101 (9.22%) Microsoft
2 74 (6.75%) Cisco
3 61 (5.57%) SAP
4 43 (3.92%) VMware
5 27 (2.46%) Juniper
6 26 (2.37%) Red Hat
6 26 (2.37%) Sparx
7 24 (2.19%) ServiceNow
8 21 (1.92%) Google
9 18 (1.64%) Oracle
10 11 (1.00%) Splunk
11 10 (0.91%) Adobe
11 10 (0.91%) Dell
12 8 (0.73%) Fortinet
13 7 (0.64%) Salesforce
14 6 (0.55%) Atlassian
14 6 (0.55%) Palo Alto
15 5 (0.46%) CheckPoint
15 5 (0.46%) McAfee
15 5 (0.46%) SolarWinds