Hybrid/Remote Architect Job Trends

Architect
UK > Work from Home

The median Architect salary for remote/hybrid work is £82,500 per year, according to job vacancies posted during the 6 months leading to 13 November 2025.

The table below compares current salary benchmarking and summary statistics with the previous two years.

6 months to
13 Nov 2025
Same period 2024 Same period 2023
Rank 62 32 36
Rank change year-on-year -30 +4 +22
Permanent jobs requiring an Architect 671 1,399 1,502
As % of all permanent jobs with remote/hybrid work options 4.28% 7.07% 6.95%
As % of the Job Titles category 4.55% 7.32% 7.23%
Number of salaries quoted 417 911 1,141
10th Percentile £60,875 £56,250 £62,000
25th Percentile £68,750 £67,500 £68,718
Median annual salary (50th Percentile) £82,500 £80,000 £82,500
Median % change year-on-year +3.13% -3.03% -2.94%
75th Percentile £100,000 £97,500 £97,500
90th Percentile £110,000 £118,750 £110,000
UK median annual salary £82,500 £80,000 £85,000
% change year-on-year +3.13% -5.88% -

All Permanent IT Job Vacancies
Work from Home

For comparison with the information above, the following table provides summary statistics for all permanent IT job vacancies with remote/hybrid work options. Most job vacancies include a discernible job title that can be normalized. As such, the figures in the second row provide an indication of the number of permanent jobs in our overall sample.

Permanent vacancies in Work from Home with a recognized job title 14,732 19,114 20,772
% of permanent jobs with a recognized job title 93.91% 96.64% 96.09%
Number of salaries quoted 9,120 11,911 16,927
10th Percentile £29,475 £35,000 £36,250
25th Percentile £40,000 £45,000 £46,250
Median annual salary (50th Percentile) £55,233 £60,000 £62,500
Median % change year-on-year -7.95% -4.00% +1.00%
75th Percentile £77,000 £80,000 £80,000
90th Percentile £95,275 £97,500 £97,500
UK median annual salary £52,500 £57,500 £60,000
% change year-on-year -8.70% -4.17% -

Architect
Job Vacancy Trend for Remote/Hybrid Roles

Historical trend showing the proportion of permanent IT job postings featuring 'Architect' in the job title and offering remote or hybrid work options relative to all permanent IT jobs advertised.
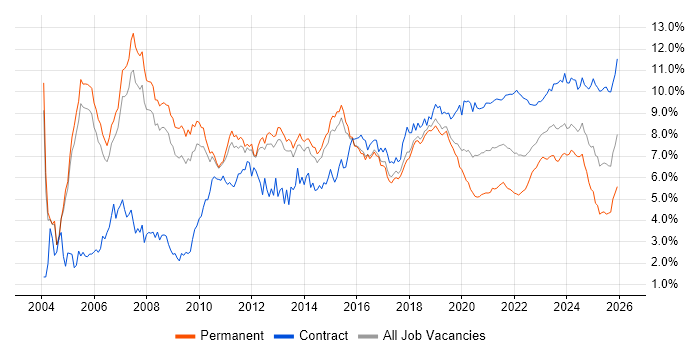
Architect job vacancy trend for remote/hybrid roles

Architect
Salary Trend for Remote/Hybrid Jobs

Salary distribution trend for remote Architect job vacancies.

Salary distribution trend for remote Architect job vacancies

Architect
Salary Histogram for Remote/Hybrid Jobs

Salary distribution for jobs with remote/hybrid work options citing Architect over the 6 months to 13 November 2025.

Architect salary histogram for jobs with remote/hybrid work options

Architect Skill Set
Top 30 Co-Occurring Skills & Capabilities in Remote/Hybrid Jobs

For the 6 months to 13 November 2025, Architect job roles required the following skills and capabilities in order of popularity. The figures indicate the absolute number of co-occurrences and as a proportion of all permanent jobs with hybrid/remote work options featuring Architect in the job title.

1 272 (40.54%) Azure
2 166 (24.74%) AWS
3 164 (24.44%) Agile
4 160 (23.85%) Roadmaps
5 124 (18.48%) Security Cleared
6 120 (17.88%) AI
6 120 (17.88%) Microsoft
7 117 (17.44%) Continuous Improvement
8 116 (17.29%) Problem-Solving
9 114 (16.99%) Enterprise Architecture
10 110 (16.39%) Data Modelling
11 108 (16.10%) TOGAF
12 106 (15.80%) Analytics
12 106 (15.80%) DevOps
13 105 (15.65%) Technical Leadership
14 91 (13.56%) SC Cleared
15 82 (12.22%) Data Architecture
16 80 (11.92%) Mentoring
16 80 (11.92%) Stakeholder Engagement
17 78 (11.62%) Degree
18 77 (11.48%) GCP
19 76 (11.33%) CI/CD
19 76 (11.33%) Python
20 75 (11.18%) Microservices
20 75 (11.18%) SaaS
21 72 (10.73%) Stakeholder Management
22 70 (10.43%) Decision-Making
23 65 (9.69%) Technical Architecture
24 63 (9.39%) Data Management
24 63 (9.39%) Presales

Architect Skill Set
Co-Occurring Skills & Capabilities in Remote/Hybrid Jobs by Category

The following tables expand on the one above by listing co-occurrences grouped by category. They cover the same employment type, locality and period, with up to 20 co-occurrences shown in each category:

Application Platforms
1 5 (0.75%) Confluence
1 5 (0.75%) JBoss
1 5 (0.75%) WebSphere
2 3 (0.45%) Apache Spark
3 2 (0.30%) Apache
3 2 (0.30%) ArcGIS
3 2 (0.30%) GeoServer
3 2 (0.30%) Oracle Spatial
4 1 (0.15%) Apache Airflow
4 1 (0.15%) CMS
4 1 (0.15%) Headless CMS
4 1 (0.15%) SharePoint
Applications
1 2 (0.30%) Microsoft Excel
1 2 (0.30%) Microsoft PowerPoint
1 2 (0.30%) MS Visio
2 1 (0.15%) PlantUML
2 1 (0.15%) Simulink
Business Applications
1 18 (2.68%) SAP S/4HANA
2 7 (1.04%) Oracle Payables
2 7 (1.04%) Oracle Receivables
3 6 (0.89%) Oracle General Ledger
4 5 (0.75%) Shopify
5 4 (0.60%) Dynamics CRM
5 4 (0.60%) Oracle Assets
6 3 (0.45%) Payment Gateway
7 2 (0.30%) Dynamics GP
7 2 (0.30%) Oracle Cash Management
7 2 (0.30%) Oracle ERP
7 2 (0.30%) SAP FI
7 2 (0.30%) SAP SCM
7 2 (0.30%) SAP SD
8 1 (0.15%) Magento
8 1 (0.15%) Oracle EBS R12
8 1 (0.15%) SAP EWM
8 1 (0.15%) SAP LE
8 1 (0.15%) SAP MM
8 1 (0.15%) SAP PP
Cloud Services
1 272 (40.54%) Azure
2 166 (24.74%) AWS
3 77 (11.48%) GCP
4 75 (11.18%) SaaS
5 37 (5.51%) Snowflake
6 32 (4.77%) Power Platform
6 32 (4.77%) Serverless
7 29 (4.32%) PaaS
8 27 (4.02%) Azure DevOps
8 27 (4.02%) IaaS
9 24 (3.58%) Azure Cosmos DB
10 22 (3.28%) OCI
11 19 (2.83%) Microsoft 365
12 14 (2.09%) Dynamics 365
13 12 (1.79%) AWS Lambda
13 12 (1.79%) GitHub
14 10 (1.49%) Microsoft Purview
15 9 (1.34%) AWS CloudFormation
15 9 (1.34%) Azure Service Bus
16 8 (1.19%) Amazon S3
Communications & Networking
1 22 (3.28%) WAN
2 21 (3.13%) Broadband
2 21 (3.13%) Firewall
3 20 (2.98%) VPN
4 19 (2.83%) LAN
5 17 (2.53%) Wi-Fi
6 13 (1.94%) Network Security
7 9 (1.34%) Junos
7 9 (1.34%) SD-WAN
8 6 (0.89%) DHCP
8 6 (0.89%) DNS
9 4 (0.60%) VoIP
10 3 (0.45%) BGP
10 3 (0.45%) DOCSIS
10 3 (0.45%) Ethernet
10 3 (0.45%) IPv4
10 3 (0.45%) IPv6
10 3 (0.45%) PPP
10 3 (0.45%) SNMP
10 3 (0.45%) TCP/IP
Database & Business Intelligence
1 62 (9.24%) Data Warehouse
2 27 (4.02%) Data Lake
3 21 (3.13%) Metadata
4 18 (2.68%) NoSQL
5 14 (2.09%) Power BI
6 13 (1.94%) Azure SQL Database
7 11 (1.64%) PostgreSQL
7 11 (1.64%) SQL Server
8 10 (1.49%) Azure SQL Data Warehouse
8 10 (1.49%) Data Vault
9 8 (1.19%) Data Mining
10 7 (1.04%) Elasticsearch
11 6 (0.89%) Metadata Repository
12 5 (0.75%) Amazon RDS
12 5 (0.75%) Amazon Redshift
12 5 (0.75%) Geospatial Data
13 4 (0.60%) BigQuery
13 4 (0.60%) MongoDB
13 4 (0.60%) Relational Database
13 4 (0.60%) Tableau
Development Applications
1 28 (4.17%) Jenkins
2 18 (2.68%) GitLab
3 16 (2.38%) JIRA
3 16 (2.38%) SonarQube
4 11 (1.64%) Git
5 7 (1.04%) MSBuild
5 7 (1.04%) Octopus Deploy
5 7 (1.04%) Team Foundation Server
5 7 (1.04%) Visual Studio
6 6 (0.89%) ER Studio
6 6 (0.89%) ERwin
7 4 (0.60%) PowerDesigner
8 1 (0.15%) MSI
General
1 220 (32.79%) Social Skills
2 146 (21.76%) Finance
3 79 (11.77%) Analytical Skills
3 79 (11.77%) Public Sector
4 72 (10.73%) Inclusion and Diversity
5 49 (7.30%) Retail
6 37 (5.51%) Presentation Skills
7 34 (5.07%) Banking
7 34 (5.07%) Marketing
8 31 (4.62%) Law
9 24 (3.58%) Legal
10 16 (2.38%) Games
10 16 (2.38%) Influencing Skills
11 15 (2.24%) Documentation Skills
11 15 (2.24%) Manufacturing
12 13 (1.94%) Back Office
13 6 (0.89%) Pharmaceutical
14 5 (0.75%) Retail Banking
15 4 (0.60%) Local Government
16 3 (0.45%) Advertising
Libraries, Frameworks & Software Standards
1 43 (6.41%) .NET
2 34 (5.07%) Node.js
3 33 (4.92%) React
4 32 (4.77%) REST
5 24 (3.58%) React Native
6 23 (3.43%) SOAP
7 20 (2.98%) Lightning Web Components
8 18 (2.68%) Visualforce
9 15 (2.24%) Middleware
10 12 (1.79%) Django
10 12 (1.79%) gRPC
11 10 (1.49%) ASP.NET
11 10 (1.49%) GraphQL
11 10 (1.49%) JSON
11 10 (1.49%) Kafka
12 9 (1.34%) SAP Fiori
13 8 (1.19%) CSS
13 8 (1.19%) HTML
13 8 (1.19%) Spring
13 8 (1.19%) Web Services
Miscellaneous
1 52 (7.75%) Data Centre
2 46 (6.86%) Cloud Native
3 37 (5.51%) Legacy Systems
4 35 (5.22%) Management Information System
5 33 (4.92%) Hybrid Cloud
6 31 (4.62%) Product Ownership
6 31 (4.62%) Self-Motivation
7 29 (4.32%) Virtual Team
8 25 (3.73%) Mobile App
8 25 (3.73%) Public Cloud
9 21 (3.13%) Enterprise Software
10 12 (1.79%) Distributed Systems
11 10 (1.49%) Greenfield Project
11 10 (1.49%) Private Cloud
12 9 (1.34%) Analytical Mindset
12 9 (1.34%) IoT
13 8 (1.19%) Operational Technology
14 7 (1.04%) CMDB
14 7 (1.04%) Reference Data
15 6 (0.89%) Augmented Reality
Operating Systems
1 12 (1.79%) Linux
2 7 (1.04%) Windows
3 3 (0.45%) OpenWrt
3 3 (0.45%) Windows Server
4 2 (0.30%) Ubuntu
5 1 (0.15%) Android
5 1 (0.15%) OpenVMS
5 1 (0.15%) Red Hat Enterprise Linux
Processes & Methodologies
1 164 (24.44%) Agile
2 160 (23.85%) Roadmaps
3 120 (17.88%) AI
4 117 (17.44%) Continuous Improvement
5 116 (17.29%) Problem-Solving
6 114 (16.99%) Enterprise Architecture
7 110 (16.39%) Data Modelling
8 108 (16.10%) TOGAF
9 106 (15.80%) Analytics
9 106 (15.80%) DevOps
10 105 (15.65%) Technical Leadership
11 82 (12.22%) Data Architecture
12 80 (11.92%) Mentoring
12 80 (11.92%) Stakeholder Engagement
13 76 (11.33%) CI/CD
14 75 (11.18%) Microservices
15 72 (10.73%) Stakeholder Management
16 70 (10.43%) Decision-Making
17 65 (9.69%) Technical Architecture
18 63 (9.39%) Data Management
Programming Languages
1 76 (11.33%) Python
2 62 (9.24%) SQL
3 58 (8.64%) C#
4 40 (5.96%) Java
5 22 (3.28%) JavaScript
6 20 (2.98%) Apex Code
7 17 (2.53%) SOQL
8 15 (2.24%) SOSL
9 13 (1.94%) TypeScript
10 7 (1.04%) C++
11 6 (0.89%) Bicep
11 6 (0.89%) PowerShell
12 4 (0.60%) C
12 4 (0.60%) Go
13 1 (0.15%) ABAP
13 1 (0.15%) Bash
13 1 (0.15%) MATLAB
13 1 (0.15%) PHP
13 1 (0.15%) PL/SQL
13 1 (0.15%) Scala
Qualifications
1 124 (18.48%) Security Cleared
2 91 (13.56%) SC Cleared
3 78 (11.62%) Degree
4 45 (6.71%) AWS Certification
4 45 (6.71%) Azure Certification
5 34 (5.07%) TOGAF Certification
6 29 (4.32%) AWS Certified Solutions Architect
6 29 (4.32%) Computer Science Degree
7 28 (4.17%) DV Cleared
8 19 (2.83%) Cisco Certification
8 19 (2.83%) Master's Degree
9 17 (2.53%) Microsoft Certification
10 14 (2.09%) CCNP
11 13 (1.94%) CISSP
12 11 (1.64%) CCNA
13 10 (1.49%) CISM
14 9 (1.34%) JNCIA
14 9 (1.34%) SAP Certification
15 4 (0.60%) BPSS Clearance
15 4 (0.60%) DBS Check
Quality Assurance & Compliance
1 35 (5.22%) GDPR
2 34 (5.07%) NIST
3 30 (4.47%) ISO/IEC 27001
4 28 (4.17%) Accessibility
5 18 (2.68%) NCSC
6 14 (2.09%) HIPAA
7 9 (1.34%) Data Quality
7 9 (1.34%) QA
8 5 (0.75%) Sarbanes-Oxley
9 4 (0.60%) PCI DSS
10 3 (0.45%) SOC 2
11 2 (0.30%) COBIT
11 2 (0.30%) ISO/IEC 20000
11 2 (0.30%) ISO/IEC 42001
12 1 (0.15%) Cyber Essentials
12 1 (0.15%) Def Stans
12 1 (0.15%) EU AI Act
12 1 (0.15%) ISO/IEC 27002 (supersedes ISO/IEC 17799)
12 1 (0.15%) JSP 440
System Software
1 37 (5.51%) Docker
2 6 (0.89%) Virtual Machines
3 5 (0.75%) Active Directory
4 3 (0.45%) Firmware
4 3 (0.45%) GPFS
4 3 (0.45%) Lustre
4 3 (0.45%) VMware NSX
Systems Management
1 38 (5.66%) Kubernetes
2 25 (3.73%) Terraform
3 18 (2.68%) Ansible
4 5 (0.75%) Microsoft Intune
5 4 (0.60%) FortiGate
6 2 (0.30%) Computer Emergency Response Teams
6 2 (0.30%) Endace
6 2 (0.30%) Grafana
7 1 (0.15%) Autotask
7 1 (0.15%) Prometheus
7 1 (0.15%) SCCM
7 1 (0.15%) Single Sign-On
Vendors
1 120 (17.88%) Microsoft
2 35 (5.22%) Google
3 31 (4.62%) Databricks
4 30 (4.47%) SAP
5 26 (3.87%) Salesforce
6 23 (3.43%) Cisco
6 23 (3.43%) Oracle
7 20 (2.98%) Palo Alto
8 18 (2.68%) Adobe
8 18 (2.68%) Apple
9 17 (2.53%) Workday
10 15 (2.24%) ServiceNow
10 15 (2.24%) Splunk
11 12 (1.79%) Juniper
12 7 (1.04%) Ariba
12 7 (1.04%) Fortinet
13 6 (0.89%) Informatica
14 5 (0.75%) IBM
14 5 (0.75%) MuleSoft
15 4 (0.60%) BiZZdesign