ITSM Contract Job Trends in the East of England

IT Service Management (ITSM)
England > East of England

The table below provides summary statistics and contractor rates for jobs advertised in the East of England requiring ITSM skills. It covers contract job vacancies from the 6 months leading up to 23 November 2025, with comparisons to the same periods in the previous two years.

6 months to
23 Nov 2025
Same period 2024 Same period 2023
Rank 35 47 58
Rank change year-on-year +12 +11 -12
Contract jobs citing ITSM 70 39 59
As % of all contract jobs in the East of England 4.58% 3.00% 3.20%
As % of the Processes & Methodologies category 5.31% 3.69% 3.63%
Number of daily rates quoted 38 10 41
10th Percentile £209 £356 £400
25th Percentile £263 £438 £470
Median daily rate (50th Percentile) £496 £538 £700
Median % change year-on-year -7.70% -23.21% +164.15%
75th Percentile £575 £597 £750
90th Percentile £600 £699 £850
England median daily rate £490 £500 £532
% change year-on-year -2.00% -6.06% +12.05%
Number of hourly rates quoted 13 5 16
10th Percentile - £15.51 £12.50
25th Percentile £6.00 £15.53 £13.11
Median hourly rate £16.92 £16.46 £14.13
Median % change year-on-year +2.79% +16.53% +3.40%
75th Percentile £17.64 £18.67 £14.75
90th Percentile £24.14 £20.17 £15.38
England median hourly rate £20.74 £29.00 £14.50
% change year-on-year -28.48% +100.00% -

All Process and Methodology Skills
East of England

ITSM falls under the Processes and Methodologies category. For comparison with the information above, the following table provides summary statistics for all contract job vacancies requiring process or methodology skills in the East of England.

Contract vacancies with a requirement for process or methodology skills 1,319 1,056 1,624
As % of all contract IT jobs advertised in the East of England 86.38% 81.29% 87.97%
Number of daily rates quoted 546 420 882
10th Percentile £185 £239 £225
25th Percentile £363 £319 £400
Median daily rate (50th Percentile) £500 £450 £500
Median % change year-on-year +11.11% -10.00% -
75th Percentile £581 £575 £600
90th Percentile £680 £675 £725
England median daily rate £505 £525 £545
% change year-on-year -3.81% -3.67% -0.91%
Number of hourly rates quoted 391 228 375
10th Percentile £14.25 £15.38 £14.16
25th Percentile £16.25 £15.62 £14.25
Median hourly rate £22.00 £28.34 £21.00
Median % change year-on-year -22.36% +34.93% -6.67%
75th Percentile £64.50 £65.00 £65.00
90th Percentile £70.00 £70.38 £76.50
England median hourly rate £25.15 £35.75 £44.50
% change year-on-year -29.65% -19.66% +25.35%

ITSM
Job Vacancy Trend in the East of England

Historical trend showing the proportion of contract IT job postings citing ITSM relative to all contract IT jobs advertised in the East of England.
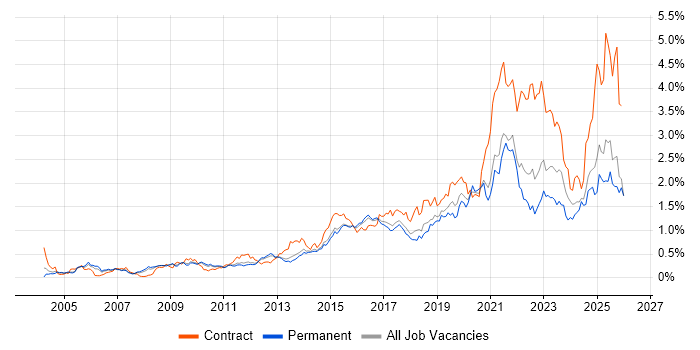
ITSM job vacancy trend in the East of England

ITSM
Daily Rate Trend in the East of England

Contractor daily rate distribution trend for jobs in the East of England citing ITSM.

Contractor daily rate distribution trend for jobs in the East of England citing ITSM

ITSM
Daily Rate Histogram in the East of England

Daily rate distribution for jobs citing ITSM in the East of England over the 6 months to 23 November 2025.

Daily rate histogram for ITSM in the East of England

ITSM
Hourly Rate Trend in the East of England

Contractor hourly rate distribution trend for jobs in the East of England citing ITSM.

Contractor hourly rate distribution trend for jobs in the East of England citing ITSM

ITSM
Hourly Rate Histogram in the East of England

Hourly rate distribution of jobs citing ITSM in the East of England over the 6 months to 23 November 2025.

Hourly rate histogram for ITSM in the East of England

ITSM
Contract Job Locations in the East of England

The table below looks at the demand and provides a guide to the median contractor rates quoted in IT jobs citing ITSM within the East of England region over the 6 months to 23 November 2025. The 'Rank Change' column provides an indication of the change in demand within each location based on the same 6 month period last year.

Location Rank Change
on Same Period
Last Year
Matching
Contract
IT Job Ads
Median
Daily Rate
Past 6 Months
Median Daily Rate
% Change
on Same Period
Last Year
Live
Jobs
Hertfordshire -2 35 £541 -1.73% 23
Cambridgeshire +8 20 £488 +14.76% 5
Norfolk -14 6 £500 - 2
Bedfordshire -5 5 £550 +4.76%
Essex 0 4 £225 -68.97% 7
ITSM
England

ITSM
Co-Occurring Skills & Capabilities in the East of England by Category

The following tables expand on the one above by listing co-occurrences grouped by category. They cover the same employment type, locality and period, with up to 20 co-occurrences shown in each category:

Application Platforms
1 6 (8.57%) WebSphere
2 5 (7.14%) Microsoft Exchange
2 5 (7.14%) SharePoint
3 3 (4.29%) Apache
3 3 (4.29%) IIS
3 3 (4.29%) WebLogic
4 1 (1.43%) Confluence
4 1 (1.43%) OpenStack
Applications
1 2 (2.86%) Microsoft Excel
2 1 (1.43%) Microsoft Office
2 1 (1.43%) Microsoft PowerPoint
Business Applications
1 7 (10.00%) OpenText VIM for SAP
1 7 (10.00%) SAP FI
1 7 (10.00%) SAP MM
1 7 (10.00%) SAP S/4HANA
2 4 (5.71%) Remedy ITSM
3 3 (4.29%) Maximo
4 1 (1.43%) Dynamics CRM
4 1 (1.43%) NetSuite
4 1 (1.43%) Oracle General Ledger
4 1 (1.43%) Oracle Payables
4 1 (1.43%) Oracle Receivables
4 1 (1.43%) SAP LE
4 1 (1.43%) SAP WM
Cloud Services
1 18 (25.71%) Microsoft 365
2 5 (7.14%) AWS
2 5 (7.14%) OneDrive
3 4 (5.71%) Azure
4 3 (4.29%) Cloud Computing
5 2 (2.86%) AWS CloudFormation
5 2 (2.86%) Power Platform
6 1 (1.43%) Azure Data Factory
6 1 (1.43%) Entra ID
6 1 (1.43%) GCP
6 1 (1.43%) Google Workspace
6 1 (1.43%) OCI
6 1 (1.43%) SaaS
Communications & Networking
1 3 (4.29%) DNS
1 3 (4.29%) LAN
1 3 (4.29%) WAN
2 2 (2.86%) Cisco IOS
3 1 (1.43%) iSCSI
3 1 (1.43%) SAN
3 1 (1.43%) VPN
3 1 (1.43%) Wi-Fi
Database & Business Intelligence
1 6 (8.57%) Metadata
2 3 (4.29%) Amazon RDS
2 3 (4.29%) DB2
2 3 (4.29%) SQL Server
3 2 (2.86%) Power BI
4 1 (1.43%) Oracle Reports
4 1 (1.43%) SAP HANA
Development Applications
1 8 (11.43%) JIRA
2 3 (4.29%) GitLab
2 3 (4.29%) TeamCity
3 1 (1.43%) Git
General
1 29 (41.43%) Social Skills
2 14 (20.00%) Finance
3 10 (14.29%) Analytical Skills
4 7 (10.00%) Public Sector
5 3 (4.29%) Organisational Skills
6 2 (2.86%) Documentation Skills
6 2 (2.86%) Legal
6 2 (2.86%) Publishing
7 1 (1.43%) Electronics
7 1 (1.43%) Games
7 1 (1.43%) Law
7 1 (1.43%) Manufacturing
7 1 (1.43%) Marketing
7 1 (1.43%) Telecoms
Job Titles
1 22 (31.43%) Consultant
2 15 (21.43%) Analyst
3 9 (12.86%) IT Support
4 7 (10.00%) SAP Consultant
5 6 (8.57%) SAP S/4HANA Consultant
5 6 (8.57%) Support Analyst
6 5 (7.14%) Developer
6 5 (7.14%) IT Analyst
6 5 (7.14%) ServiceNow Consultant
6 5 (7.14%) ServiceNow Developer
7 4 (5.71%) Administrator
7 4 (5.71%) IT Support Analyst
7 4 (5.71%) Lead
7 4 (5.71%) Service Analyst
7 4 (5.71%) Technical Support
8 3 (4.29%) IT Consultant
8 3 (4.29%) Maximo Consultant
8 3 (4.29%) Service Design Consultant
8 3 (4.29%) Service Desk Analyst
8 3 (4.29%) Technical Analyst
Libraries, Frameworks & Software Standards
1 6 (8.57%) SAP Basis
1 6 (8.57%) SAP Business Workflow
1 6 (8.57%) SAP Fiori
2 4 (5.71%) SOAP
3 3 (4.29%) .NET
3 3 (4.29%) HTML
3 3 (4.29%) Middleware
3 3 (4.29%) Node.js
3 3 (4.29%) Web Services
3 3 (4.29%) XML
4 1 (1.43%) Oracle Fusion
4 1 (1.43%) REST
4 1 (1.43%) SAP PI
Miscellaneous
1 5 (7.14%) NHS
2 3 (4.29%) Management Information System
3 2 (2.86%) CMDB
4 1 (1.43%) Data Centre
4 1 (1.43%) Driving Licence
4 1 (1.43%) e-Learning
4 1 (1.43%) Enterprise Software
4 1 (1.43%) Enterprise Storage
4 1 (1.43%) iPad
4 1 (1.43%) iPhone
4 1 (1.43%) Linux Command Line
4 1 (1.43%) Onboarding
4 1 (1.43%) Self-Motivation
4 1 (1.43%) Smartphone
4 1 (1.43%) Video Conferencing
4 1 (1.43%) Web Conferencing
Operating Systems
1 21 (30.00%) Windows
2 9 (12.86%) Windows 10
3 4 (5.71%) Windows Server
3 4 (5.71%) Windows Server 2003
3 4 (5.71%) Windows Server 2012
4 3 (4.29%) Android
5 1 (1.43%) Apple iOS
5 1 (1.43%) CentOS
5 1 (1.43%) Linux
5 1 (1.43%) Mac OS
5 1 (1.43%) Ubuntu
5 1 (1.43%) Windows Server 2016
Processes & Methodologies
1 24 (34.29%) Service Management
2 22 (31.43%) ITIL
3 16 (22.86%) Problem-Solving
4 15 (21.43%) Stakeholder Engagement
5 13 (18.57%) Customer Service
5 13 (18.57%) Workflow
6 11 (15.71%) Knowledge Transfer
7 10 (14.29%) Service Design
8 9 (12.86%) User Acceptance Testing
9 8 (11.43%) CI/CD
9 8 (11.43%) Requirements Gathering
10 7 (10.00%) Accounts Payable
10 7 (10.00%) Analytics
10 7 (10.00%) Business Continuity
10 7 (10.00%) Invoice Processing
10 7 (10.00%) OCR
10 7 (10.00%) Performance Improvement
10 7 (10.00%) Validation
11 6 (8.57%) Migration
11 6 (8.57%) Stakeholder Management
Programming Languages
1 7 (10.00%) ABAP
1 7 (10.00%) Python
2 6 (8.57%) SQL
3 5 (7.14%) JavaScript
4 3 (4.29%) C
4 3 (4.29%) C++
4 3 (4.29%) Java
4 3 (4.29%) PHP
4 3 (4.29%) Shell Script
5 1 (1.43%) PowerShell
Qualifications
1 13 (18.57%) Security Cleared
2 10 (14.29%) Degree
2 10 (14.29%) SC Cleared
3 7 (10.00%) Microsoft Certification
4 4 (5.71%) HNC
4 4 (5.71%) HND
4 4 (5.71%) ITIL Certification
4 4 (5.71%) MCP
4 4 (5.71%) MCSE
5 3 (4.29%) A+ Certification
6 2 (2.86%) BPSS Clearance
7 1 (1.43%) APMG
7 1 (1.43%) BC Cleared
7 1 (1.43%) CISA
7 1 (1.43%) CISM
7 1 (1.43%) CISSP
7 1 (1.43%) DV Cleared
7 1 (1.43%) ISTQB
7 1 (1.43%) ISTQB Advanced Certification
Quality Assurance & Compliance
1 7 (10.00%) QA
2 6 (8.57%) SLA
3 3 (4.29%) PCI DSS
4 1 (1.43%) GRC
4 1 (1.43%) ISO/IEC 27001
4 1 (1.43%) NIST
4 1 (1.43%) PMO
4 1 (1.43%) Sarbanes-Oxley
System Software
1 13 (18.57%) Active Directory
2 2 (2.86%) Hyper-V
3 1 (1.43%) VMware Infrastructure
Systems Management
1 3 (4.29%) Ansible
2 2 (2.86%) Progress Chef
2 2 (2.86%) Puppet
2 2 (2.86%) Salt
2 2 (2.86%) Terraform
3 1 (1.43%) Microsoft Intune
3 1 (1.43%) SCCM
3 1 (1.43%) SCOM
Vendors
1 47 (67.14%) ServiceNow
2 16 (22.86%) SAP
3 14 (20.00%) Microsoft
4 7 (10.00%) OpenText
5 4 (5.71%) Remedy
6 3 (4.29%) Dell
6 3 (4.29%) Dynatrace
6 3 (4.29%) HP
6 3 (4.29%) IBM
7 2 (2.86%) Cisco
7 2 (2.86%) Oracle
7 2 (2.86%) VMware
8 1 (1.43%) BeyondTrust
8 1 (1.43%) Computacenter
8 1 (1.43%) CyberArk
8 1 (1.43%) Google
8 1 (1.43%) MobileIron
8 1 (1.43%) Salesforce
8 1 (1.43%) Snow
8 1 (1.43%) Thycotic