Microsoft Power Platform Developer
UK > England
The median Microsoft Power Platform Developer daily rate in England is £500, according to job vacancies posted in the 6 months leading up to 20 May 2025.
The table below provides contractor rate benchmarking and summary statistics, comparing them to the same period in the previous two years.
| 6 months to 20 May 2025 |
Same period 2024 | Same period 2023 | |
|---|---|---|---|
| Rank | 409 | 445 | 593 |
| Rank change year-on-year | +36 | +148 | +142 |
| Contract jobs requiring a Power Platform Developer | 62 | 88 | 47 |
| As % of all contract jobs advertised in England | 0.26% | 0.24% | 0.097% |
| As % of the Job Titles category | 0.28% | 0.26% | 0.10% |
| Number of daily rates quoted | 48 | 58 | 26 |
| 10th Percentile | £420 | £308 | £413 |
| 25th Percentile | £449 | £386 | £420 |
| Median daily rate (50th Percentile) | £500 | £475 | £494 |
| Median % change year-on-year | +5.26% | -3.80% | -10.23% |
| 75th Percentile | £550 | £569 | £588 |
| 90th Percentile | £579 | £621 | £644 |
| UK median daily rate | £514 | £475 | £450 |
| % change year-on-year | +8.21% | +5.56% | -18.18% |
All Contract IT Job Vacancies
England
For comparison with the information above, the following table provides summary statistics for all contract IT job vacancies in England. Most job vacancies include a discernible job title that can be normalized. As such, the figures in the second row provide an indication of the number of contract jobs in our overall sample.
| Contract vacancies in England with a recognized job title | 22,435 | 33,769 | 45,858 |
| % of contract IT jobs with a recognized job title | 92.34% | 92.77% | 94.60% |
| Number of daily rates quoted | 14,906 | 22,420 | 32,568 |
| 10th Percentile | £295 | £282 | £313 |
| 25th Percentile | £406 | £413 | £425 |
| Median daily rate (50th Percentile) | £520 | £525 | £550 |
| Median % change year-on-year | -0.95% | -4.55% | +4.76% |
| 75th Percentile | £638 | £644 | £663 |
| 90th Percentile | £750 | £750 | £760 |
| UK median daily rate | £510 | £525 | £543 |
| % change year-on-year | -2.86% | -3.23% | +3.33% |
| Number of hourly rates quoted | 927 | 2,442 | 1,343 |
| 10th Percentile | £14.00 | £12.86 | £14.27 |
| 25th Percentile | £18.50 | £16.30 | £20.00 |
| Median hourly rate | £30.00 | £36.92 | £45.00 |
| Median % change year-on-year | -18.73% | -17.97% | +95.42% |
| 75th Percentile | £63.13 | £61.30 | £65.00 |
| 90th Percentile | £75.00 | £73.75 | £77.00 |
| UK median hourly rate | £28.00 | £36.50 | £45.00 |
| % change year-on-year | -23.29% | -18.89% | +87.50% |
Power Platform Developer
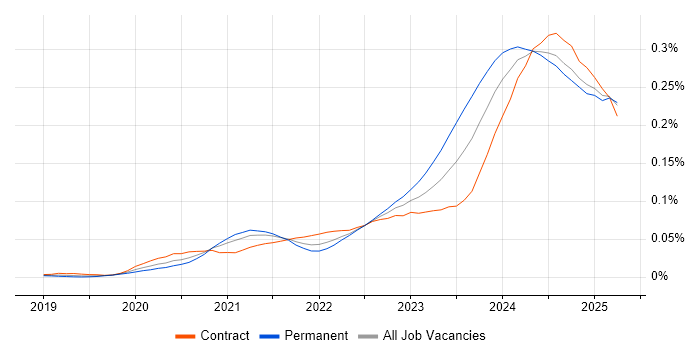
Job Vacancy Trend in England
Job postings that featured Power Platform Developer in the job title as a proportion of all IT jobs advertised in England.

Power Platform Developer
Contractor Daily Rate Trend in England
3-month moving average daily rate quoted in jobs citing Power Platform Developer in England.
Power Platform Developer
Daily Rate Histogram in England
Daily rate distribution for jobs citing Power Platform Developer in England over the 6 months to 20 May 2025.
Power Platform Developer
Contract Job Locations in England
The table below looks at the demand and provides a guide to the median contractor rates quoted in IT jobs citing Power Platform Developer within the England region over the 6 months to 20 May 2025. The 'Rank Change' column provides an indication of the change in demand within each location based on the same 6 month period last year.
| Location | Rank Change on Same Period Last Year |
Matching Contract IT Job Ads |
Median Daily Rate Past 6 Months |
Median Daily Rate % Change on Same Period Last Year |
Live Jobs |
|---|---|---|---|---|---|
| London | +42 | 36 | £495 | +16.47% | 28 |
| North of England | +18 | 10 | £525 | +31.25% | 11 |
| Yorkshire | +22 | 7 | £525 | +31.25% | 3 |
| Midlands | +11 | 6 | £453 | -2.05% | 6 |
| West Midlands | +1 | 6 | £453 | -4.63% | 4 |
| South East | +38 | 4 | £550 | +37.50% | 12 |
| North East | - | 2 | - | - | 5 |
| South West | +29 | 1 | £475 | - | 3 |
| North West | +11 | 1 | £550 | +22.22% | 4 |
| East of England | - | 1 | £525 | - | 2 |
| Power Platform Developer UK |
|||||
Power Platform Developer Skill Set
Top 30 Co-occurring Skills and Capabilities in England
For the 6 months to 20 May 2025, Power Platform Developer contract job roles required the following skills and capabilities in order of popularity. The figures indicate the absolute number co-occurrences and as a proportion of all contract job ads across the England region featuring Power Platform Developer in the job title.
|
|
Power Platform Developer Skill Set
Co-occurring Skills and Capabilities in England by Category
The follow tables expand on the table above by listing co-occurrences grouped by category. The same employment type, locality and period is covered with up to 20 co-occurrences shown in each of the following categories:
