Performance Measurement Contracts with Hybrid/Remote/WFH Options

Performance Measurement
UK > Work from Home

The table below provides summary statistics for remote or hybrid contract work requiring Performance Measurement skills. It includes a benchmarking guide to the contractor rates offered in vacancies that cited Performance Measurement over the 6 months leading up to 1 May 2025, comparing them to the same period in the previous two years.

6 months to
1 May 2025
Same period 2024 Same period 2023
Rank 287 322 443
Rank change year-on-year +35 +121 +148
Contract jobs citing Performance Measurement 17 23 34
As % of all contract jobs with a WFH option 0.17% 0.15% 0.13%
As % of the Processes & Methodologies category 0.19% 0.17% 0.15%
Number of daily rates quoted 4 10 21
10th Percentile £347 - £413
25th Percentile £516 £43 £460
Median daily rate (50th Percentile) £635 £438 £526
Median % change year-on-year +45.20% -16.83% +5.20%
75th Percentile £744 £475 £556
90th Percentile £868 £645 £588
UK median daily rate £538 £450 £475
% change year-on-year +19.44% -5.26% -3.06%
Number of hourly rates quoted 4 8 6
10th Percentile £40.76 £45.33 -
25th Percentile £50.72 £48.25 -
Median hourly rate £58.75 £56.25 £49.00
Median % change year-on-year +4.44% +14.80% +86.67%
75th Percentile £63.13 £60.31 -
90th Percentile £68.75 £61.25 -
UK median hourly rate £35.25 £50.00 £49.00
% change year-on-year -29.50% +2.04% +86.67%

All Process and Methodology Skills
Work from Home

Performance Measurement falls under the Processes and Methodologies category. For comparison with the information above, the following table provides summary statistics for all contract job vacancies with remote or hybrid options requiring process or methodology skills.

Contract vacancies with a requirement for process or methodology skills 9,021 13,483 23,229
As % of all contract jobs with a WFH option 91.08% 87.87% 89.84%
Number of daily rates quoted 6,191 8,996 16,418
10th Percentile £340 £325 £363
25th Percentile £419 £425 £450
Median daily rate (50th Percentile) £525 £525 £540
Median % change year-on-year - -2.78% +2.86%
75th Percentile £638 £638 £650
90th Percentile £763 £750 £750
UK median daily rate £520 £525 £550
% change year-on-year -0.95% -4.55% +4.76%
Number of hourly rates quoted 224 579 532
10th Percentile £14.20 £15.17 £19.00
25th Percentile £19.56 £25.25 £30.54
Median hourly rate £39.52 £43.00 £55.00
Median % change year-on-year -8.09% -21.82% +57.14%
75th Percentile £66.13 £60.00 £68.75
90th Percentile £75.00 £75.25 £80.23
UK median hourly rate £29.00 £35.65 £37.30
% change year-on-year -18.65% -4.42% +49.20%

Performance Measurement
Trend for Jobs with a WFH Option

Job vacancies with remote working options citing Performance Measurement as a proportion of all IT jobs advertised.
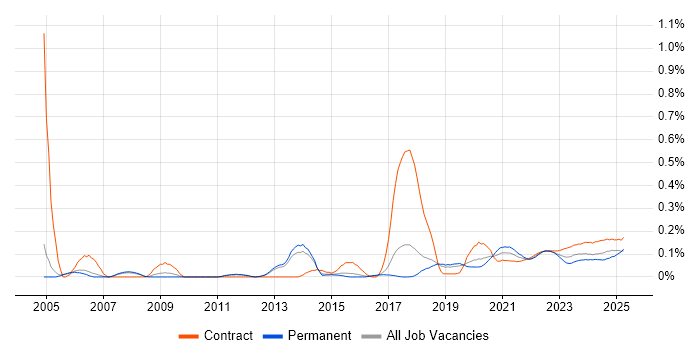
Performance Measurement trend for jobs with Hybrid/Remote/WFH options

Performance Measurement
Daily Rate Trend for Jobs with a WFH Option

3-month moving average daily rate quoted in job vacancies with remote working options citing Performance Measurement.

Performance Measurement daily rate for jobs with a WFH option

Performance Measurement
Daily Rate Histogram for Jobs with a WFH Option

Daily rate distribution for jobs with remote working options citing Performance Measurement over the 6 months to 1 May 2025.

Performance Measurement daily rate histogram for jobs with a WFH option

Performance Measurement
Hourly Rate Trend for Jobs with a WFH Option

3-month moving average hourly rate quoted in job vacancies with remote working options citing Performance Measurement.

Performance Measurement hourly rate for jobs with a WFH option

Performance Measurement
Hourly Rate Histogram for Jobs with a WFH Option

Hourly rate distribution for jobs with remote working options citing Performance Measurement over the 6 months to 1 May 2025.

Performance Measurement hourly rate histogram for jobs with a WFH option

Performance Measurement
Co-occurring Skills and Capabilities with WFH Options by Category

The follow tables expand on the table above by listing co-occurrences grouped by category. The same employment type, locality and period is covered with up to 20 co-occurrences shown in each of the following categories:

Application Platforms
1 1 (5.88%) Confluence
Applications
1 4 (23.53%) Spreadsheet
2 1 (5.88%) Microsoft Excel
Business Applications
1 3 (17.65%) Primavera
1 3 (17.65%) SAP PS
2 1 (5.88%) PeopleSoft Financials
2 1 (5.88%) SimCorp Dimension
Cloud Services
1 5 (29.41%) Azure
2 4 (23.53%) Power Platform
3 1 (5.88%) AWS
3 1 (5.88%) Cloud Computing
3 1 (5.88%) GCP
3 1 (5.88%) Google Analytics
3 1 (5.88%) Google Data Studio
3 1 (5.88%) IaaS
3 1 (5.88%) Nutanix
3 1 (5.88%) PaaS
3 1 (5.88%) Rubrik
3 1 (5.88%) SaaS
3 1 (5.88%) Snowflake
Communications & Networking
1 1 (5.88%) DHCP
1 1 (5.88%) DNS
1 1 (5.88%) Kerberos
1 1 (5.88%) NAS
1 1 (5.88%) SAN
1 1 (5.88%) TCP/IP
1 1 (5.88%) VLAN
Database & Business Intelligence
1 5 (29.41%) SQL Server
1 5 (29.41%) Tableau
2 4 (23.53%) Data Warehouse
2 4 (23.53%) Power BI
2 4 (23.53%) SQL Server Analysis Services
2 4 (23.53%) SQL Server Integration Services
2 4 (23.53%) SQL Server Reporting Services
3 1 (5.88%) MongoDB
3 1 (5.88%) Sybase ASE
Development Applications
1 1 (5.88%) Git
1 1 (5.88%) Jenkins
1 1 (5.88%) JIRA
1 1 (5.88%) TeamCity
General
1 12 (70.59%) Social Skills
2 7 (41.18%) Finance
3 4 (23.53%) Analytical Skills
3 4 (23.53%) Organisational Skills
3 4 (23.53%) Presentation Skills
4 2 (11.76%) Aerospace
4 2 (11.76%) Marketing
5 1 (5.88%) Back Office
5 1 (5.88%) Banking
5 1 (5.88%) Financial Institution
5 1 (5.88%) General Ledger
5 1 (5.88%) Investment Banking
5 1 (5.88%) Law
5 1 (5.88%) Public Sector
Job Titles
1 4 (23.53%) Head of Business Intelligence
2 3 (17.65%) Analyst
2 3 (17.65%) Project Controller
2 3 (17.65%) Project Planner
3 2 (11.76%) Business Analyst
3 2 (11.76%) Product Manager
3 2 (11.76%) SEO Manager
4 1 (5.88%) Business Data Analyst
4 1 (5.88%) Consultant
4 1 (5.88%) Data Analyst
4 1 (5.88%) PeopleSoft Consultant
4 1 (5.88%) PeopleSoft Support
4 1 (5.88%) PeopleSoft Technical Consultant
4 1 (5.88%) Performance Analyst
4 1 (5.88%) Product Analyst
4 1 (5.88%) Site Engineer
4 1 (5.88%) Technical Manager
4 1 (5.88%) Technical Product Manager
4 1 (5.88%) Technical Support Consultant
4 1 (5.88%) Windows Engineer
Libraries, Frameworks & Software Standards
1 4 (23.53%) REST
1 4 (23.53%) SOAP
2 1 (5.88%) LDAP
Miscellaneous
1 2 (11.76%) Digital Media
1 2 (11.76%) Life Science
1 2 (11.76%) Taxonomies
2 1 (5.88%) Algorithms
2 1 (5.88%) Analytical Mindset
2 1 (5.88%) Clustering
2 1 (5.88%) Data Protection Act
2 1 (5.88%) Management Information System
2 1 (5.88%) Replication
Operating Systems
1 1 (5.88%) Linux
1 1 (5.88%) Oracle Linux
1 1 (5.88%) Red Hat Enterprise Linux
1 1 (5.88%) Solaris
1 1 (5.88%) Windows
1 1 (5.88%) Windows Server
Processes & Methodologies
1 10 (58.82%) Problem-Solving
2 8 (47.06%) Decision-Making
3 7 (41.18%) Collaborative Working
4 6 (35.29%) Data Analysis
4 6 (35.29%) Visualisation
5 5 (29.41%) Analytics
5 5 (29.41%) Data Governance
5 5 (29.41%) Data Protection
5 5 (29.41%) Data Visualisation
5 5 (29.41%) Migration
6 4 (23.53%) Actionable Insight
6 4 (23.53%) Agile
6 4 (23.53%) Business Intelligence
6 4 (23.53%) Collaborative Culture
6 4 (23.53%) Data Engineering
6 4 (23.53%) Data Integration
6 4 (23.53%) Data Strategy
6 4 (23.53%) Project Management
6 4 (23.53%) SOA
6 4 (23.53%) Strategic Thinking
Programming Languages
1 6 (35.29%) SQL
2 4 (23.53%) T-SQL
3 2 (11.76%) Python
4 1 (5.88%) C#
4 1 (5.88%) PeopleCode
4 1 (5.88%) PowerShell
4 1 (5.88%) R
Qualifications
1 8 (47.06%) Degree
2 2 (11.76%) SC Cleared
2 2 (11.76%) Security Cleared
3 1 (5.88%) Master's Degree
Quality Assurance & Compliance
1 5 (29.41%) Data Quality
1 5 (29.41%) GDPR
2 4 (23.53%) Accessibility
3 2 (11.76%) Actionable Recommendations
4 1 (5.88%) MiFID
4 1 (5.88%) PMO
4 1 (5.88%) Sarbanes-Oxley
System Software
1 1 (5.88%) Active Directory
1 1 (5.88%) Docker
1 1 (5.88%) VMware ESXi
1 1 (5.88%) VMware Infrastructure
Systems Management
1 1 (5.88%) Ansible
1 1 (5.88%) EMC NetWorker
1 1 (5.88%) Kubernetes
1 1 (5.88%) Netcool
1 1 (5.88%) Terraform
1 1 (5.88%) Tivoli
1 1 (5.88%) Tivoli Storage Manager
Vendors
1 5 (29.41%) Microsoft
2 3 (17.65%) SAP
3 1 (5.88%) Cisco
3 1 (5.88%) CyberArk
3 1 (5.88%) EMC
3 1 (5.88%) Google
3 1 (5.88%) IBM
3 1 (5.88%) Isilon
3 1 (5.88%) Oracle
3 1 (5.88%) PeopleSoft
3 1 (5.88%) Qualys
3 1 (5.88%) Serena
3 1 (5.88%) ServiceNow
3 1 (5.88%) SimCorp
3 1 (5.88%) Splunk
3 1 (5.88%) Sybase
3 1 (5.88%) VMware