Cloud Computing Contracts with Hybrid/Remote/WFH Options

Cloud Computing
UK > Work from Home

The table below provides summary statistics for remote or hybrid contract work requiring Cloud Computing skills. It includes a benchmarking guide to the contractor rates offered in vacancies that cited Cloud Computing over the 6 months leading up to 1 May 2025, comparing them to the same period in the previous two years.

6 months to
1 May 2025
Same period 2024 Same period 2023
Rank 226 270 246
Rank change year-on-year +44 -24 +136
Contract jobs citing Cloud Computing 78 75 251
As % of all contract jobs with a WFH option 0.79% 0.49% 0.97%
As % of the Cloud Services category 1.98% 1.35% 2.45%
Number of daily rates quoted 45 47 178
10th Percentile £390 £363 £400
25th Percentile £463 £452 £480
Median daily rate (50th Percentile) £565 £550 £550
Median % change year-on-year +2.73% - -4.35%
75th Percentile £751 £615 £675
90th Percentile £775 £662 £747
UK median daily rate £550 £600 £565
% change year-on-year -8.33% +6.19% -
Number of hourly rates quoted 3 1 2
10th Percentile £19.85 - £19.93
25th Percentile £21.88 £18.50 £22.06
Median hourly rate £25.50 £19.00 £26.25
Median % change year-on-year +34.21% -27.62% +0.96%
75th Percentile £26.13 £19.50 £30.56
90th Percentile £26.35 - £32.78
UK median hourly rate £25.50 £18.75 £19.00
% change year-on-year +36.00% -1.32% -13.64%

All Cloud Skills
Work from Home

Cloud Computing falls under the Cloud Services category. For comparison with the information above, the following table provides summary statistics for all contract job vacancies with remote or hybrid options requiring cloud computing skills.

Contract vacancies with a requirement for cloud computing skills 3,940 5,557 10,236
As % of all contract jobs with a WFH option 39.78% 36.21% 39.59%
Number of daily rates quoted 2,887 3,982 7,514
10th Percentile £351 £350 £373
25th Percentile £425 £430 £450
Median daily rate (50th Percentile) £523 £525 £550
Median % change year-on-year -0.38% -4.55% -
75th Percentile £630 £638 £650
90th Percentile £750 £738 £743
UK median daily rate £520 £525 £550
% change year-on-year -0.95% -4.55% -
Number of hourly rates quoted 42 89 125
10th Percentile £16.00 £15.50 £16.43
25th Percentile £25.25 £17.00 £21.31
Median hourly rate £35.00 £26.00 £55.00
Median % change year-on-year +34.62% -52.73% +83.33%
75th Percentile £70.63 £50.25 £70.00
90th Percentile £92.50 £64.37 £78.40
UK median hourly rate £27.35 £21.00 £35.00
% change year-on-year +30.24% -40.00% +62.79%

Cloud Computing
Trend for Jobs with a WFH Option

Job vacancies with remote working options citing Cloud Computing as a proportion of all IT jobs advertised.
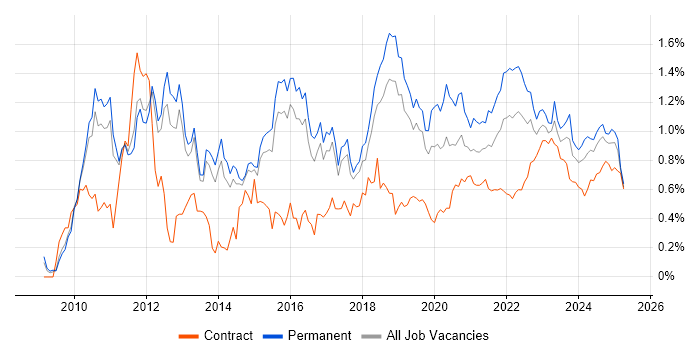
Cloud Computing trend for jobs with Hybrid/Remote/WFH options

Cloud Computing
Daily Rate Trend for Jobs with a WFH Option

3-month moving average daily rate quoted in job vacancies with remote working options citing Cloud Computing.

Cloud Computing daily rate for jobs with a WFH option

Cloud Computing
Daily Rate Histogram for Jobs with a WFH Option

Daily rate distribution for jobs with remote working options citing Cloud Computing over the 6 months to 1 May 2025.

Cloud Computing daily rate histogram for jobs with a WFH option

Cloud Computing
Hourly Rate Trend for Jobs with a WFH Option

3-month moving average hourly rate quoted in job vacancies with remote working options citing Cloud Computing.

Cloud Computing hourly rate for jobs with a WFH option

Cloud Computing
Co-occurring Skills and Capabilities with WFH Options by Category

The follow tables expand on the table above by listing co-occurrences grouped by category. The same employment type, locality and period is covered with up to 20 co-occurrences shown in each of the following categories:

Application Platforms
1 6 (7.69%) Apache
2 5 (6.41%) NetWeaver
2 5 (6.41%) OpenStack
3 4 (5.13%) Confluence
3 4 (5.13%) nginx
4 1 (1.28%) Apache Airflow
4 1 (1.28%) Apache Spark
4 1 (1.28%) CMS
4 1 (1.28%) Headless CMS
4 1 (1.28%) Microsoft Exchange
4 1 (1.28%) SharePoint
4 1 (1.28%) Umbraco
Business Applications
1 2 (2.56%) Payment Gateway
Cloud Services
1 33 (42.31%) Azure
2 23 (29.49%) AWS
3 17 (21.79%) GCP
4 8 (10.26%) SaaS
5 7 (8.97%) Azure DevOps
5 7 (8.97%) IaaS
5 7 (8.97%) PaaS
5 7 (8.97%) Serverless
6 6 (7.69%) Entra ID
7 5 (6.41%) Azure Sentinel
7 5 (6.41%) GitHub
7 5 (6.41%) Microsoft 365
8 4 (5.13%) Amazon S3
8 4 (5.13%) Azure AKS
8 4 (5.13%) Power Platform
9 3 (3.85%) Amazon EMR
9 3 (3.85%) Azure Event Grid
9 3 (3.85%) Azure Logic Apps
9 3 (3.85%) Slack
9 3 (3.85%) Snowflake
Communications & Networking
1 12 (15.38%) HTTP
2 4 (5.13%) Firewall
3 2 (2.56%) DNS
3 2 (2.56%) NAS
3 2 (2.56%) Network Security
3 2 (2.56%) SAN
3 2 (2.56%) TCP/IP
3 2 (2.56%) VPN
4 1 (1.28%) ADSL
4 1 (1.28%) Intrusion Detection
4 1 (1.28%) Kerberos
4 1 (1.28%) LAN
4 1 (1.28%) PPP
4 1 (1.28%) RIP
4 1 (1.28%) SNMP
4 1 (1.28%) Unified Communications
4 1 (1.28%) VLAN
4 1 (1.28%) VoIP
4 1 (1.28%) Wireless Security
4 1 (1.28%) xDSL
Database & Business Intelligence
1 4 (5.13%) Amazon Redshift
1 4 (5.13%) Big Data
1 4 (5.13%) Data Warehouse
1 4 (5.13%) MongoDB
1 4 (5.13%) Power BI
2 3 (3.85%) Apache Cassandra
2 3 (3.85%) Azure SQL Database
2 3 (3.85%) MySQL
2 3 (3.85%) NoSQL
2 3 (3.85%) PostgreSQL
3 2 (2.56%) Amazon RDS
3 2 (2.56%) SQL Server
4 1 (1.28%) Apache Hive
4 1 (1.28%) BigQuery
4 1 (1.28%) Flink
4 1 (1.28%) Hadoop
4 1 (1.28%) Sybase ASE
Development Applications
1 11 (14.10%) Git
1 11 (14.10%) Jenkins
2 5 (6.41%) JIRA
3 3 (3.85%) Cucumber
3 3 (3.85%) Jasmine
3 3 (3.85%) JUnit
4 2 (2.56%) TeamCity
5 1 (1.28%) GitLab
5 1 (1.28%) MLflow
5 1 (1.28%) Postman
5 1 (1.28%) Snyk
5 1 (1.28%) Subversion
General
1 30 (38.46%) Social Skills
2 19 (24.36%) Finance
3 14 (17.95%) Analytical Skills
4 11 (14.10%) Banking
5 8 (10.26%) Investment Banking
5 8 (10.26%) Public Sector
6 4 (5.13%) Back Office
7 3 (3.85%) Financial Institution
8 2 (2.56%) Presentation Skills
9 1 (1.28%) Games
9 1 (1.28%) Inclusion and Diversity
9 1 (1.28%) Influencing Skills
9 1 (1.28%) Manufacturing
9 1 (1.28%) Organisational Skills
9 1 (1.28%) Publishing
9 1 (1.28%) Telecoms
Job Titles
1 18 (23.08%) Architect
2 12 (15.38%) Senior
3 11 (14.10%) Developer
4 10 (12.82%) Artificial Intelligence Engineer
5 9 (11.54%) Lead
6 8 (10.26%) JavaScript Engineer
6 8 (10.26%) Python Engineer
7 6 (7.69%) Analyst
7 6 (7.69%) Security Architect
7 6 (7.69%) Technical Leader
8 5 (6.41%) Azure Architect
8 5 (6.41%) Integration Developer
8 5 (6.41%) SAP Developer
8 5 (6.41%) Site Reliability Engineer
9 4 (5.13%) Automation Engineer
9 4 (5.13%) Cloud Architect
9 4 (5.13%) DevOps Engineer
9 4 (5.13%) Lead Architect
9 4 (5.13%) Site Engineer
9 4 (5.13%) Unix Engineer
Libraries, Frameworks & Software Standards
1 7 (8.97%) .NET
2 6 (7.69%) EDI
3 5 (6.41%) IDoc
3 5 (6.41%) JDBC
3 5 (6.41%) JMS
3 5 (6.41%) Middleware
3 5 (6.41%) REST
3 5 (6.41%) RESTful
3 5 (6.41%) SAP PI
3 5 (6.41%) SOAP
3 5 (6.41%) XML
3 5 (6.41%) XSLT
4 4 (5.13%) Elastic Stack
4 4 (5.13%) OpenAPI
4 4 (5.13%) Swagger
5 3 (3.85%) ARM Templates
5 3 (3.85%) Azure Blueprints
5 3 (3.85%) Spring Batch
5 3 (3.85%) Spring Boot
5 3 (3.85%) Spring Security
Miscellaneous
1 15 (19.23%) Distributed Systems
2 11 (14.10%) Management Information System
3 7 (8.97%) Cloud Native
4 6 (7.69%) Product Ownership
5 5 (6.41%) Hybrid Cloud
5 5 (6.41%) Legacy Applications
5 5 (6.41%) Security Posture
5 5 (6.41%) Virtual Team
6 3 (3.85%) Distributed Denial-of-Service
6 3 (3.85%) Linux Command Line
6 3 (3.85%) Public Cloud
6 3 (3.85%) Reinsurance
7 2 (2.56%) Data Protection Act
7 2 (2.56%) IoT
7 2 (2.56%) Onboarding
7 2 (2.56%) Renewable Energy
7 2 (2.56%) Self-Motivation
8 1 (1.28%) Distributed Computing
8 1 (1.28%) Life Science
8 1 (1.28%) Replication
Operating Systems
1 18 (23.08%) Linux
2 7 (8.97%) Windows
3 6 (7.69%) Red Hat Enterprise Linux
3 6 (7.69%) Windows Server
4 5 (6.41%) Unix
5 1 (1.28%) Oracle Linux
5 1 (1.28%) Solaris
5 1 (1.28%) SUSE
Processes & Methodologies
1 27 (34.62%) CI/CD
1 27 (34.62%) DevOps
2 26 (33.33%) Problem-Solving
3 20 (25.64%) Agile
4 18 (23.08%) Artificial Intelligence
4 18 (23.08%) Machine Learning
5 15 (19.23%) Migration
6 14 (17.95%) Data Security
7 13 (16.67%) Data Science
7 13 (16.67%) High Availability
8 12 (15.38%) Cybersecurity
8 12 (15.38%) Software Engineering
9 11 (14.10%) Decision-Making
10 10 (12.82%) Containerisation
10 10 (12.82%) Infrastructure as Code
10 10 (12.82%) Natural Language Processing
10 10 (12.82%) Risk Management
10 10 (12.82%) SDLC
10 10 (12.82%) Task Automation
11 9 (11.54%) Critical Thinking
Programming Languages
1 32 (41.03%) Python
2 24 (30.77%) Java
3 16 (20.51%) SQL
4 14 (17.95%) JavaScript
5 11 (14.10%) PowerShell
6 8 (10.26%) C#
6 8 (10.26%) TypeScript
7 5 (6.41%) ABAP
7 5 (6.41%) Bash
7 5 (6.41%) Shell Script
8 4 (5.13%) Groovy
9 3 (3.85%) Bicep
9 3 (3.85%) Scala
10 2 (2.56%) Go
11 1 (1.28%) Clojure
11 1 (1.28%) Elixir
11 1 (1.28%) Haskell
11 1 (1.28%) Kotlin
11 1 (1.28%) R
11 1 (1.28%) Rust
Qualifications
1 9 (11.54%) Security Cleared
2 8 (10.26%) SC Cleared
3 6 (7.69%) AWS Certification
3 6 (7.69%) Cisco Certification
3 6 (7.69%) Degree
4 5 (6.41%) Computer Science Degree
5 4 (5.13%) AWS Certified Solutions Architect
5 4 (5.13%) Azure Certification
5 4 (5.13%) BPSS Clearance
6 3 (3.85%) CCNP
7 2 (2.56%) (ISC)2 CCSP
7 2 (2.56%) AWS Certified Cloud Practitioner
7 2 (2.56%) CCNA
7 2 (2.56%) CISSP
8 1 (1.28%) CESG Certified Professional
8 1 (1.28%) CompTIA CySA+
8 1 (1.28%) CompTIA Security+
8 1 (1.28%) ISO 27001 Lead Auditor
8 1 (1.28%) ISO 27001 Lead Implementer
8 1 (1.28%) Microsoft Certification
Quality Assurance & Compliance
1 6 (7.69%) GDPR
2 3 (3.85%) Data Quality
2 3 (3.85%) PCI DSS
2 3 (3.85%) QA
2 3 (3.85%) SOC 2
3 2 (2.56%) California Consumer Privacy Act
3 2 (2.56%) ISO/IEC 27001
3 2 (2.56%) SLA
4 1 (1.28%) Accessibility
4 1 (1.28%) Cyber Essentials
4 1 (1.28%) Cyber Essentials PLUS
4 1 (1.28%) NCSC
4 1 (1.28%) Sarbanes-Oxley
4 1 (1.28%) Software Quality Assurance
System Software
1 17 (21.79%) Docker
2 6 (7.69%) Active Directory
3 3 (3.85%) Virtual Machines
4 2 (2.56%) Virtual Desktop
4 2 (2.56%) VMware Infrastructure
4 2 (2.56%) vSphere
5 1 (1.28%) Ceph
5 1 (1.28%) Veritas Cluster Server
5 1 (1.28%) VMware ESXi
Systems Management
1 21 (26.92%) Kubernetes
2 15 (19.23%) Terraform
3 8 (10.26%) Ansible
4 2 (2.56%) Prometheus
5 1 (1.28%) Argo
5 1 (1.28%) CASB
5 1 (1.28%) EMC NetWorker
5 1 (1.28%) Grafana
5 1 (1.28%) Nagios
5 1 (1.28%) Nessus
5 1 (1.28%) NetBackup
5 1 (1.28%) Netcool
5 1 (1.28%) Oracle RMAN
5 1 (1.28%) QRadar
5 1 (1.28%) Tivoli
5 1 (1.28%) Tivoli Storage Manager
5 1 (1.28%) ZABBIX
Vendors
1 18 (23.08%) Microsoft
2 8 (10.26%) Google
3 6 (7.69%) SAP
4 5 (6.41%) Splunk
5 4 (5.13%) AppDynamics
5 4 (5.13%) Cisco
5 4 (5.13%) Dynatrace
5 4 (5.13%) VMware
6 3 (3.85%) Red Hat
7 2 (2.56%) IBM
8 1 (1.28%) Alcatel-Lucent
8 1 (1.28%) EMC
8 1 (1.28%) Forcepoint
8 1 (1.28%) Juniper
8 1 (1.28%) Murex
8 1 (1.28%) Oracle
8 1 (1.28%) Perforce
8 1 (1.28%) Serena
8 1 (1.28%) Sybase
8 1 (1.28%) Veritas