Data Protection Contracts with Hybrid/Remote/WFH Options

Data Protection
UK > Work from Home

The table below provides summary statistics for remote or hybrid contract work requiring Data Protection skills. It includes a benchmarking guide to the contractor rates offered in vacancies that cited Data Protection over the 6 months leading up to 30 April 2025, comparing them to the same period in the previous two years.

6 months to
30 Apr 2025
Same period 2024 Same period 2023
Rank 108 112 126
Rank change year-on-year +4 +14 -5
Contract jobs citing Data Protection 238 318 496
As % of all contract jobs with a WFH option 2.40% 2.07% 1.92%
As % of the Processes & Methodologies category 2.64% 2.35% 2.13%
Number of daily rates quoted 118 186 300
10th Percentile £293 £270 £269
25th Percentile £361 £413 £407
Median daily rate (50th Percentile) £489 £520 £513
Median % change year-on-year -6.01% +1.46% -2.38%
75th Percentile £609 £619 £631
90th Percentile £738 £725 £740
UK median daily rate £500 £500 £525
% change year-on-year - -4.76% -
Number of hourly rates quoted 6 19 8
10th Percentile £26.88 £18.29 £41.49
25th Percentile £27.68 £19.25 £51.25
Median hourly rate £31.28 £25.00 £52.50
Median % change year-on-year +25.13% -52.38% +50.00%
75th Percentile £32.32 £33.92 £66.00
90th Percentile £32.95 £43.75 -
UK median hourly rate £27.64 £20.25 £52.50
% change year-on-year +36.49% -61.43% +162.50%

All Process and Methodology Skills
Work from Home

Data Protection falls under the Processes and Methodologies category. For comparison with the information above, the following table provides summary statistics for all contract job vacancies with remote or hybrid options requiring process or methodology skills.

Contract vacancies with a requirement for process or methodology skills 9,023 13,505 23,232
As % of all contract jobs with a WFH option 91.03% 87.83% 89.84%
Number of daily rates quoted 6,195 9,015 16,421
10th Percentile £340 £325 £363
25th Percentile £419 £425 £450
Median daily rate (50th Percentile) £525 £525 £540
Median % change year-on-year - -2.78% +2.86%
75th Percentile £638 £638 £650
90th Percentile £763 £750 £750
UK median daily rate £521 £525 £550
% change year-on-year -0.86% -4.55% +4.76%
Number of hourly rates quoted 225 573 532
10th Percentile £14.20 £15.17 £19.00
25th Percentile £19.75 £24.25 £30.54
Median hourly rate £40.00 £42.50 £55.00
Median % change year-on-year -5.88% -22.73% +57.14%
75th Percentile £67.50 £60.00 £68.75
90th Percentile £75.00 £75.25 £80.23
UK median hourly rate £29.00 £35.50 £37.30
% change year-on-year -18.31% -4.83% +49.20%

Data Protection
Trend for Jobs with a WFH Option

Job vacancies with remote working options citing Data Protection as a proportion of all IT jobs advertised.
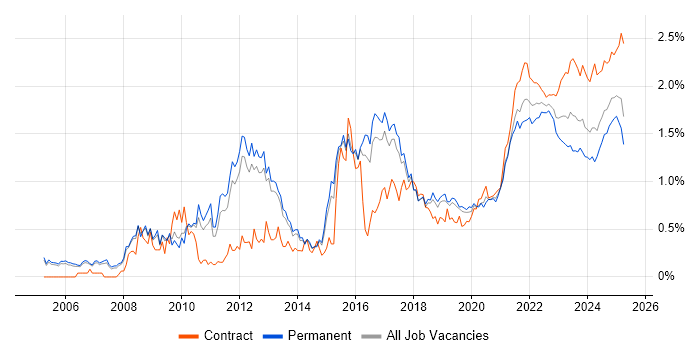
Data Protection trend for jobs with Hybrid/Remote/WFH options

Data Protection
Daily Rate Trend for Jobs with a WFH Option

3-month moving average daily rate quoted in job vacancies with remote working options citing Data Protection.

Data Protection daily rate for jobs with a WFH option

Data Protection
Daily Rate Histogram for Jobs with a WFH Option

Daily rate distribution for jobs with remote working options citing Data Protection over the 6 months to 30 April 2025.

Data Protection daily rate histogram for jobs with a WFH option

Data Protection
Hourly Rate Trend for Jobs with a WFH Option

3-month moving average hourly rate quoted in job vacancies with remote working options citing Data Protection.

Data Protection hourly rate for jobs with a WFH option

Data Protection
Co-occurring Skills and Capabilities with WFH Options by Category

The follow tables expand on the table above by listing co-occurrences grouped by category. The same employment type, locality and period is covered with up to 20 co-occurrences shown in each of the following categories:

Application Platforms
1 10 (4.20%) SharePoint
2 5 (2.10%) Confluence
3 2 (0.84%) Anypoint
3 2 (0.84%) Apache Spark
3 2 (0.84%) CMS
3 2 (0.84%) Drupal
3 2 (0.84%) JBoss
3 2 (0.84%) WebSphere
3 2 (0.84%) WebSphere Application Server
4 1 (0.42%) BizTalk Server
4 1 (0.42%) IIS
4 1 (0.42%) Microsoft Exchange
4 1 (0.42%) OpenEdge
4 1 (0.42%) OpenStack
4 1 (0.42%) SAS
Applications
1 6 (2.52%) Microsoft Office
2 3 (1.26%) Microsoft Excel
2 3 (1.26%) Spreadsheet
3 2 (0.84%) Adobe Captivate
3 2 (0.84%) Trello
4 1 (0.42%) Chatbot
4 1 (0.42%) MadCap Flare
4 1 (0.42%) Microsoft PowerPoint
Business Applications
1 5 (2.10%) SAP S/4HANA
2 3 (1.26%) Aladdin
2 3 (1.26%) SAP PM
2 3 (1.26%) SAP SD
3 2 (0.84%) CiviCRM
3 2 (0.84%) Dynamics CRM
4 1 (0.42%) BASE24
4 1 (0.42%) OpenText VIM for SAP
4 1 (0.42%) Oracle ERP
Cloud Services
1 45 (18.91%) Azure
2 34 (14.29%) AWS
3 16 (6.72%) Microsoft 365
4 13 (5.46%) SaaS
5 11 (4.62%) GCP
6 9 (3.78%) Power Platform
7 7 (2.94%) Entra ID
7 7 (2.94%) GitHub
7 7 (2.94%) PaaS
7 7 (2.94%) Serverless
7 7 (2.94%) Snowflake
8 6 (2.52%) Azure DevOps
8 6 (2.52%) Cloud Computing
8 6 (2.52%) IaaS
9 5 (2.10%) Amazon S3
9 5 (2.10%) Azure AKS
9 5 (2.10%) Azure Logic Apps
10 4 (1.68%) Amazon EC2
10 4 (1.68%) Dynamics 365
10 4 (1.68%) OneDrive
Communications & Networking
1 9 (3.78%) Firewall
2 6 (2.52%) Network Security
2 6 (2.52%) SD-WAN
3 4 (1.68%) SSL
4 3 (1.26%) DNS
4 3 (1.26%) VPN
4 3 (1.26%) WAN
5 2 (0.84%) BGP
5 2 (0.84%) DHCP
5 2 (0.84%) HTTPS
5 2 (0.84%) NAS
5 2 (0.84%) SAN
5 2 (0.84%) Software-Defined Networking
5 2 (0.84%) SSH
5 2 (0.84%) Unified Communications
5 2 (0.84%) Wireless
5 2 (0.84%) X.509
6 1 (0.42%) 5G
6 1 (0.42%) Cisco ASA
6 1 (0.42%) Cisco ISE
Database & Business Intelligence
1 8 (3.36%) Data Warehouse
1 8 (3.36%) Power BI
1 8 (3.36%) SQL Server
2 7 (2.94%) Tableau
3 5 (2.10%) SQL Server Integration Services
3 5 (2.10%) SQL Server Reporting Services
4 4 (1.68%) Azure SQL Database
4 4 (1.68%) Oracle Database
4 4 (1.68%) SQL Server Analysis Services
5 3 (1.26%) MongoDB
6 2 (0.84%) Data Lake
6 2 (0.84%) DB2
6 2 (0.84%) DynamoDB
6 2 (0.84%) IMS/DB
6 2 (0.84%) Redis
7 1 (0.42%) Flink
7 1 (0.42%) RDBMS
7 1 (0.42%) Relational Database
7 1 (0.42%) Sybase ASE
7 1 (0.42%) UniData
Development Applications
1 11 (4.62%) JIRA
2 7 (2.94%) Git
2 7 (2.94%) Jenkins
3 4 (1.68%) Maven
4 3 (1.26%) Snyk
5 2 (0.84%) GitLab
5 2 (0.84%) Octopus Deploy
5 2 (0.84%) TeamCity
5 2 (0.84%) Visual Studio
5 2 (0.84%) Visual Studio Code
6 1 (0.42%) Bitbucket
6 1 (0.42%) Burp Suite
6 1 (0.42%) Cucumber
6 1 (0.42%) Cypress.io
6 1 (0.42%) Gatling
6 1 (0.42%) JMeter
6 1 (0.42%) Metasploit
6 1 (0.42%) MSI
6 1 (0.42%) Selenium
6 1 (0.42%) SpecFlow
General
1 83 (34.87%) Social Skills
2 59 (24.79%) Finance
3 34 (14.29%) Analytical Skills
4 13 (5.46%) Banking
5 10 (4.20%) Legal
5 10 (4.20%) Public Sector
6 9 (3.78%) Law
6 9 (3.78%) Marketing
6 9 (3.78%) Organisational Skills
7 7 (2.94%) Telecoms
8 6 (2.52%) Advertising
9 5 (2.10%) Aerospace
9 5 (2.10%) Back Office
9 5 (2.10%) Inclusion and Diversity
10 4 (1.68%) Police
11 3 (1.26%) Front Office
11 3 (1.26%) Presentation Skills
12 2 (0.84%) Manufacturing
12 2 (0.84%) Pharmaceutical
12 2 (0.84%) Retail
Job Titles
1 40 (16.81%) Architect
2 19 (7.98%) Consultant
3 17 (7.14%) Senior
4 15 (6.30%) Project Manager
5 14 (5.88%) Analyst
5 14 (5.88%) Lead
6 13 (5.46%) Developer
7 11 (4.62%) Support Engineer
8 9 (3.78%) Data Engineer
9 7 (2.94%) Data Manager
10 6 (2.52%) AWS Engineer
10 6 (2.52%) Azure Architect
10 6 (2.52%) Security Architect
10 6 (2.52%) Security Engineer
11 5 (2.10%) Build Engineer
11 5 (2.10%) Cloud Architect
11 5 (2.10%) Data Analyst
11 5 (2.10%) Data Protection Engineer
11 5 (2.10%) Infrastructure Engineer
11 5 (2.10%) SAP Consultant
Libraries, Frameworks & Software Standards
1 8 (3.36%) React
2 7 (2.94%) SOAP
3 6 (2.52%) REST
3 6 (2.52%) RESTful
4 4 (1.68%) ARM Templates
4 4 (1.68%) CSS
4 4 (1.68%) HTML
4 4 (1.68%) Kafka
4 4 (1.68%) Middleware
4 4 (1.68%) XML
5 3 (1.26%) .NET
5 3 (1.26%) Azure Blueprints
5 3 (1.26%) LDAP
5 3 (1.26%) Spring
6 2 (0.84%) EJB
6 2 (0.84%) J2EE
6 2 (0.84%) JDBC
6 2 (0.84%) Murex MxML
6 2 (0.84%) Web Services
6 2 (0.84%) XSLT
Miscellaneous
1 130 (54.62%) Data Protection Act
2 11 (4.62%) Data Centre
2 11 (4.62%) Onboarding
3 9 (3.78%) Hybrid Cloud
3 9 (3.78%) Management Information System
4 6 (2.52%) Cloud Native
5 5 (2.10%) Self-Motivation
6 4 (1.68%) Linux Command Line
7 3 (1.26%) Algorithms
7 3 (1.26%) Enterprise Software
7 3 (1.26%) Product Ownership
7 3 (1.26%) Reinsurance
7 3 (1.26%) Replication
7 3 (1.26%) Social Media
8 2 (0.84%) Derivative
8 2 (0.84%) Fixed Income
8 2 (0.84%) FMCG
8 2 (0.84%) Interest Rate Derivative
8 2 (0.84%) Learning Management System
8 2 (0.84%) PKI
Operating Systems
1 26 (10.92%) Linux
2 21 (8.82%) Windows
3 9 (3.78%) Windows Server
4 7 (2.94%) Unix
5 5 (2.10%) Red Hat Enterprise Linux
6 2 (0.84%) Android
7 1 (0.42%) Apple iOS
7 1 (0.42%) Oracle Linux
7 1 (0.42%) Solaris
7 1 (0.42%) Ubuntu
7 1 (0.42%) Windows 7
7 1 (0.42%) Windows Server 2016
7 1 (0.42%) Windows Server 2019
Processes & Methodologies
1 63 (26.47%) Problem-Solving
2 43 (18.07%) Agile
3 40 (16.81%) Stakeholder Management
4 38 (15.97%) Project Management
5 26 (10.92%) Migration
6 20 (8.40%) CI/CD
6 20 (8.40%) DevOps
7 17 (7.14%) Continuous Improvement
8 16 (6.72%) Roadmaps
9 14 (5.88%) Analytics
9 14 (5.88%) Cloud Security
9 14 (5.88%) Computer Science
9 14 (5.88%) Data Analysis
9 14 (5.88%) Information Security
10 13 (5.46%) Business Intelligence
10 13 (5.46%) Data Governance
10 13 (5.46%) Data Management
11 12 (5.04%) Change Management
12 11 (4.62%) Cybersecurity
12 11 (4.62%) Machine Learning
Programming Languages
1 30 (12.61%) SQL
2 25 (10.50%) Python
3 13 (5.46%) Java
4 11 (4.62%) JavaScript
5 10 (4.20%) PowerShell
6 6 (2.52%) PHP
6 6 (2.52%) Shell Script
7 4 (1.68%) Bicep
7 4 (1.68%) C#
7 4 (1.68%) T-SQL
7 4 (1.68%) TypeScript
8 3 (1.26%) PL/SQL
9 2 (0.84%) ActionScript
9 2 (0.84%) ActionScript 2.0
9 2 (0.84%) C
9 2 (0.84%) C++
9 2 (0.84%) Perl
9 2 (0.84%) REXX
10 1 (0.42%) R
10 1 (0.42%) Ruby
Qualifications
1 26 (10.92%) Security Cleared
2 23 (9.66%) Degree
3 19 (7.98%) SC Cleared
4 13 (5.46%) Computer Science Degree
5 8 (3.36%) AWS Certification
6 7 (2.94%) CISSP
7 6 (2.52%) CISM
8 5 (2.10%) Master's Degree
9 4 (1.68%) BPSS Clearance
9 4 (1.68%) Cisco Certification
10 3 (1.26%) Azure Certification
10 3 (1.26%) CCNA
10 3 (1.26%) CCNP
10 3 (1.26%) CEH
10 3 (1.26%) CISA
10 3 (1.26%) OSCP
11 2 (0.84%) CompTIA Security+
11 2 (0.84%) DBS Check
11 2 (0.84%) DV Cleared
11 2 (0.84%) SANS
Quality Assurance & Compliance
1 30 (12.61%) GDPR
2 11 (4.62%) NIST
3 10 (4.20%) Accessibility
3 10 (4.20%) Data Quality
4 8 (3.36%) ISO/IEC 27001
4 8 (3.36%) PMO
5 6 (2.52%) SOC 2
6 5 (2.10%) QA
7 3 (1.26%) GRC
7 3 (1.26%) NIST 800
7 3 (1.26%) PCI DSS
7 3 (1.26%) Sarbanes-Oxley
8 2 (0.84%) FIPS 140-2
8 2 (0.84%) HIPAA
9 1 (0.42%) Actionable Recommendations
9 1 (0.42%) EU AI Act
9 1 (0.42%) ISO 8583
9 1 (0.42%) ISO 9001
System Software
1 13 (5.46%) VMware Infrastructure
2 12 (5.04%) Active Directory
3 7 (2.94%) Virtual Machines
4 3 (1.26%) Docker
5 2 (0.84%) Virtual Servers
6 1 (0.42%) BitLocker
6 1 (0.42%) Firmware
6 1 (0.42%) Veritas Cluster Server
6 1 (0.42%) VMware ESXi
6 1 (0.42%) VMware NSX
Systems Management
1 12 (5.04%) Terraform
2 11 (4.62%) Kubernetes
3 5 (2.10%) Ansible
4 3 (1.26%) NetBackup
4 3 (1.26%) Single Sign-On
4 3 (1.26%) WSUS
5 2 (0.84%) EMC NetWorker
5 2 (0.84%) Microsoft Intune
5 2 (0.84%) QRadar
5 2 (0.84%) SCCM
6 1 (0.42%) Avamar
6 1 (0.42%) FortiGate
6 1 (0.42%) Netcool
6 1 (0.42%) Oracle RMAN
6 1 (0.42%) Puppet
6 1 (0.42%) Tivoli
6 1 (0.42%) Tivoli Storage Manager
Vendors
1 37 (15.55%) Microsoft
2 14 (5.88%) VMware
3 11 (4.62%) Cisco
3 11 (4.62%) SAP
4 10 (4.20%) Google
5 9 (3.78%) Oracle
6 7 (2.94%) ServiceNow
7 6 (2.52%) Commvault
8 5 (2.10%) IBM
8 5 (2.10%) Red Hat
9 4 (1.68%) Informatica
9 4 (1.68%) MuleSoft
9 4 (1.68%) Salesforce
9 4 (1.68%) Splunk
10 3 (1.26%) CyberArk
10 3 (1.26%) Fortinet
10 3 (1.26%) Murex
10 3 (1.26%) New Relic
10 3 (1.26%) Veeam
10 3 (1.26%) Workday