Target Operating Model Contracts with Work from Home Options

Target Operating Model (TOM)
UK > Work from Home

The table below provides summary statistics for contract job vacancies with an option to work from home (WFH) and a requirement for Target Operating Model skills. Included is a benchmarking guide to the contractor rates offered in vacancies that have cited Target Operating Model over the 6 months to 28 April 2024 with a comparison to the same period in the previous 2 years.

6 months to
28 Apr 2024
Same period 2023 Same period 2022
Rank 260 322 404
Rank change year-on-year +62 +82 -74
Contract jobs citing Target Operating Model 86 151 230
As % of all contract jobs with a WFH option 0.56% 0.58% 0.52%
As % of the Processes & Methodologies category 0.64% 0.65% 0.57%
Number of daily rates quoted 67 98 185
10th Percentile £413 £421 £413
25th Percentile £511 £513 £475
Median daily rate (50th Percentile) £575 £600 £550
Median % change year-on-year -4.17% +9.09% +4.76%
75th Percentile £638 £775 £688
90th Percentile £712 £800 £795
UK median daily rate £575 £575 £562
% change year-on-year - +2.40% +2.09%

All Process and Methodology Skills
Work from Home

Target Operating Model is in the Processes and Methodologies category. The following table is for comparison with the above and provides summary statistics for all contract job vacancies with a WFH option and a requirement for process or methodology skills.

Contract vacancies with a requirement for process or methodology skills 13,424 23,231 40,628
As % of all contract jobs with a WFH option 87.86% 89.84% 91.13%
Number of daily rates quoted 8,959 16,419 29,475
10th Percentile £325 £363 £360
25th Percentile £425 £450 £431
Median daily rate (50th Percentile) £525 £540 £525
Median % change year-on-year -2.78% +2.86% +9.38%
75th Percentile £638 £650 £625
90th Percentile £750 £750 £715
UK median daily rate £525 £550 £525
% change year-on-year -4.55% +4.76% +8.25%
Number of hourly rates quoted 568 532 547
10th Percentile £15.12 £19.00 £13.50
25th Percentile £24.25 £30.54 £19.89
Median hourly rate £40.28 £55.00 £35.00
Median % change year-on-year -26.76% +57.14% +34.62%
75th Percentile £60.00 £68.75 £55.00
90th Percentile £75.25 £80.23 £67.20
UK median hourly rate £35.00 £37.30 £25.00
% change year-on-year -6.17% +49.20% -

Target Operating Model
Trend for Jobs with a WFH Option

Job vacancies with a work from home option citing Target Operating Model as a proportion of all IT jobs advertised.
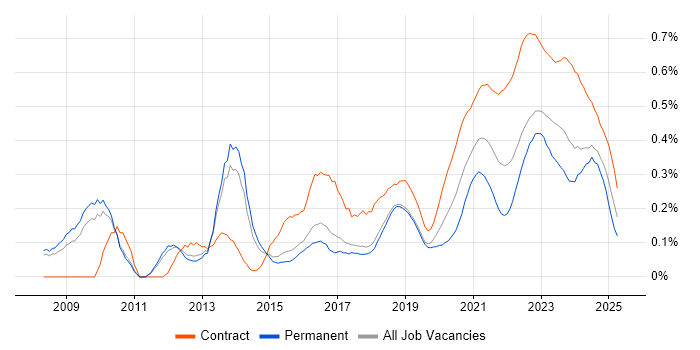
Target Operating Model trend for jobs with a WFH option

Target Operating Model
Daily Rate Trend for Jobs with a WFH Option

3-month moving average daily rate quoted in job vacancies with a work from home option citing Target Operating Model.

Target Operating Model daily rate for jobs with a WFH option

Target Operating Model
Daily Rate Histogram for Jobs with a WFH Option

Daily rate distribution for jobs with a work from home option citing Target Operating Model over the 6 months to 28 April 2024.

Target Operating Model daily rate histogram for jobs with a WFH option

Target Operating Model
Co-occurring Skills and Capabilities with WFH Options by Category

The follow tables expand on the table above by listing co-occurrences grouped by category. The same employment type, locality and period is covered with up to 20 co-occurrences shown in each of the following categories:

Application Platforms
1 4 (4.65%) Confluence
2 2 (2.33%) Adobe Experience Manager
3 1 (1.16%) SharePoint
Applications
1 5 (5.81%) Microsoft Excel
2 4 (4.65%) Microsoft Office
2 4 (4.65%) Microsoft PowerPoint
2 4 (4.65%) Microsoft Project
3 1 (1.16%) MS Visio
Business Applications
1 4 (4.65%) Loan IQ
2 1 (1.16%) Dynamics CRM
2 1 (1.16%) Sparx Enterprise Architect
Cloud Services
1 7 (8.14%) Azure
2 4 (4.65%) Azure DevOps
3 3 (3.49%) Cloud Computing
3 3 (3.49%) Dynamics 365
4 2 (2.33%) Microsoft 365
4 2 (2.33%) Power Platform
4 2 (2.33%) SaaS
5 1 (1.16%) AWS
5 1 (1.16%) Azure API Management
5 1 (1.16%) Azure Event Grid
5 1 (1.16%) Azure Logic Apps
5 1 (1.16%) Entra ID
5 1 (1.16%) IaaS
5 1 (1.16%) PaaS
Communications & Networking
1 2 (2.33%) Cisco IOS
1 2 (2.33%) LAN
1 2 (2.33%) Network Security
2 1 (1.16%) Firewall
2 1 (1.16%) VPN
Database & Business Intelligence
1 3 (3.49%) Big Data
Development Applications
1 4 (4.65%) JIRA
2 1 (1.16%) Visual Studio
General
1 34 (39.53%) Social Skills
2 23 (26.74%) Finance
3 16 (18.60%) Public Sector
4 10 (11.63%) Banking
5 8 (9.30%) Inclusion and Diversity
6 7 (8.14%) Analytical Skills
7 5 (5.81%) Investment Banking
8 4 (4.65%) Financial Institution
9 3 (3.49%) Front Office
10 2 (2.33%) Influencing Skills
10 2 (2.33%) Presentation Skills
10 2 (2.33%) Private Banking
11 1 (1.16%) Advertising
11 1 (1.16%) Back Office
Job Titles
1 33 (38.37%) Analyst
2 32 (37.21%) Business Analyst
3 13 (15.12%) Project Manager
4 12 (13.95%) Consultant
5 10 (11.63%) Senior
6 6 (6.98%) Architect
7 5 (5.81%) Insurance Business Analyst
7 5 (5.81%) Programme Manager
7 5 (5.81%) Senior Manager
7 5 (5.81%) Senior Project Manager
8 4 (4.65%) Asset Management Analyst
8 4 (4.65%) Asset Management Business Analyst
8 4 (4.65%) Business Manager
8 4 (4.65%) Change Manager
8 4 (4.65%) Senior Analyst
8 4 (4.65%) Senior Business Analyst
9 3 (3.49%) HR Consultant
9 3 (3.49%) Information Systems Manager
9 3 (3.49%) Programme Delivery Manager
9 3 (3.49%) Scrum Master
Libraries, Frameworks & Software Standards
1 3 (3.49%) EDI
2 2 (2.33%) Web Services
3 1 (1.16%) .NET
3 1 (1.16%) LDAP
3 1 (1.16%) Middleware
3 1 (1.16%) SAML
Miscellaneous
1 7 (8.14%) Product Ownership
2 5 (5.81%) Fixed Income
3 4 (4.65%) Derivative
4 3 (3.49%) Management Information System
4 3 (3.49%) Onboarding
5 2 (2.33%) Wiki
6 1 (1.16%) Data Protection Act
6 1 (1.16%) Equities
6 1 (1.16%) Freedom of Information
6 1 (1.16%) Freedom of Information Act
6 1 (1.16%) Housing Association
6 1 (1.16%) Public Cloud
6 1 (1.16%) Reference Data
6 1 (1.16%) Self-Motivation
6 1 (1.16%) Smart Meter
Processes & Methodologies
1 27 (31.40%) Agile
2 26 (30.23%) Stakeholder Management
3 20 (23.26%) Change Management
4 13 (15.12%) Business Analysis
5 12 (13.95%) Project Management
5 12 (13.95%) User Stories
6 10 (11.63%) PRINCE2
6 10 (11.63%) Problem-Solving
6 10 (11.63%) Requirements Gathering
7 9 (10.47%) Decision-Making
7 9 (10.47%) Project Delivery
7 9 (10.47%) Project Governance
7 9 (10.47%) Roadmaps
7 9 (10.47%) Scrum
7 9 (10.47%) Stakeholder Engagement
7 9 (10.47%) Waterfall
8 8 (9.30%) Business Case
8 8 (9.30%) Business Strategy
9 7 (8.14%) Impact Assessments
9 7 (8.14%) Migration
Programming Languages
1 1 (1.16%) C#
1 1 (1.16%) Java
1 1 (1.16%) JavaScript
1 1 (1.16%) PHP
1 1 (1.16%) Python
1 1 (1.16%) Ruby
Qualifications
1 11 (12.79%) Degree
2 6 (6.98%) Security Cleared
3 4 (4.65%) APMP
3 4 (4.65%) Numerate Degree
3 4 (4.65%) SC Cleared
4 3 (3.49%) DV Cleared
4 3 (3.49%) PRINCE2 Practitioner
5 1 (1.16%) Azure Certification
5 1 (1.16%) Master's Degree
5 1 (1.16%) MBA
5 1 (1.16%) TOGAF Certification
Quality Assurance & Compliance
1 7 (8.14%) PMO
2 4 (4.65%) Data Quality
3 1 (1.16%) Actionable Recommendations
3 1 (1.16%) ISO/IEC 27001
3 1 (1.16%) QA
3 1 (1.16%) SLA
System Software
1 1 (1.16%) Active Directory
1 1 (1.16%) Docker
1 1 (1.16%) Hyper-V
1 1 (1.16%) Virtual Machines
1 1 (1.16%) VMware Infrastructure
Systems Management
1 2 (2.33%) SolarWinds Orion
2 1 (1.16%) Kubernetes
2 1 (1.16%) Single Sign-On
Vendors
1 8 (9.30%) Microsoft
2 6 (6.98%) ServiceNow
3 3 (3.49%) Phenom
4 2 (2.33%) Adobe
4 2 (2.33%) Cisco
4 2 (2.33%) MuleSoft
5 1 (1.16%) Salesforce
5 1 (1.16%) SAP
5 1 (1.16%) Sparx
5 1 (1.16%) VMware
5 1 (1.16%) Workday