Electronics Contracts with Work from Home Options

Electronics
UK > Work from Home

The table below looks at the prevalence of the term Electronics in contract job vacancies with an option to work from home (WFH). Included is a benchmarking guide to the contractor rates offered in vacancies that have cited Electronics over the 6 months to 8 May 2024 with a comparison to the same period over the previous 2 years.

6 months to
8 May 2024
Same period 2023 Same period 2022
Rank 196 244 309
Rank change year-on-year +48 +65 -78
Contract jobs citing Electronics 156 241 359
As % of all contract jobs with a WFH option 1.03% 0.96% 0.81%
As % of the General category 1.76% 1.64% 1.49%
Number of daily rates quoted 70 145 325
10th Percentile £280 £210 £410
25th Percentile £413 £425 £475
Median daily rate (50th Percentile) £533 £525 £550
Median % change year-on-year +1.43% -4.55% +10.00%
75th Percentile £738 £625 £660
90th Percentile £788 £688 £750
UK median daily rate £563 £538 £525
% change year-on-year +4.65% +2.38% -
Number of hourly rates quoted 46 31 10
10th Percentile £40.00 - -
25th Percentile £46.25 £42.50 £42.50
Median hourly rate £47.50 £45.00 £47.50
Median % change year-on-year +5.56% -5.26% +9.83%
75th Percentile £60.00 £58.75 £50.96
90th Percentile - - £51.40
UK median hourly rate £59.50 £57.50 £52.50
% change year-on-year +3.48% +9.52% +21.39%

All General Skills
Work from Home

Electronics is in the General Skills category. The following table is for comparison with the above and provides summary statistics for all contract job vacancies with a WFH option and a requirement for common skills.

Contract vacancies with a requirement for common skills 8,875 14,682 24,035
As % of all contract jobs with a WFH option 58.79% 58.44% 54.36%
Number of daily rates quoted 5,816 10,345 17,442
10th Percentile £325 £363 £350
25th Percentile £425 £450 £431
Median daily rate (50th Percentile) £538 £550 £525
Median % change year-on-year -2.27% +4.76% +6.06%
75th Percentile £650 £675 £638
90th Percentile £775 £775 £738
UK median daily rate £525 £550 £538
% change year-on-year -4.55% +2.33% +7.50%
Number of hourly rates quoted 471 336 345
10th Percentile £14.00 £19.00 £13.50
25th Percentile £22.61 £25.99 £19.35
Median hourly rate £38.12 £50.00 £32.50
Median % change year-on-year -23.76% +53.85% +38.52%
75th Percentile £53.00 £67.50 £49.25
90th Percentile £72.50 £80.25 £64.90
UK median hourly rate £30.16 £33.60 £21.92
% change year-on-year -10.24% +53.33% -2.60%

Electronics
Trend for Jobs with a WFH Option

Job vacancies with a work from home option citing Electronics as a proportion of all IT jobs advertised.
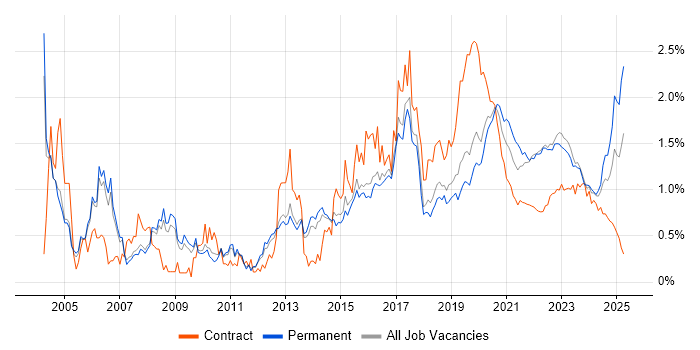
Electronics trend for jobs with a WFH option

Electronics
Daily Rate Trend for Jobs with a WFH Option

3-month moving average daily rate quoted in job vacancies with a work from home option citing Electronics.

Electronics daily rate for jobs with a WFH option

Electronics
Daily Rate Histogram for Jobs with a WFH Option

Daily rate distribution for jobs with a work from home option citing Electronics over the 6 months to 8 May 2024.

Electronics daily rate histogram for jobs with a WFH option

Electronics
Hourly Rate Trend for Jobs with a WFH Option

3-month moving average hourly rate quoted in job vacancies with a work from home option citing Electronics.

Electronics hourly rate for jobs with a WFH option

Electronics
Hourly Rate Histogram for Jobs with a WFH Option

Hourly rate distribution for jobs with a work from home option citing Electronics over the 6 months to 8 May 2024.

Electronics hourly rate histogram for jobs with a WFH option

Electronics
Co-occurring Skills and Capabilities with WFH Options by Category

The follow tables expand on the table above by listing co-occurrences grouped by category. The same employment type, locality and period is covered with up to 20 co-occurrences shown in each of the following categories:

Application Platforms
1 3 (1.92%) Confluence
2 2 (1.28%) CMS
2 2 (1.28%) OpenStack
2 2 (1.28%) SharePoint
3 1 (0.64%) ArcGIS
3 1 (0.64%) SAS
Applications
1 7 (4.49%) Microsoft Office
2 2 (1.28%) Microsoft Excel
3 1 (0.64%) Microsoft PowerPoint
3 1 (0.64%) Simulink
3 1 (0.64%) Spreadsheet
3 1 (0.64%) Stateflow
Business Applications
1 1 (0.64%) Sparx Enterprise Architect
Cloud Services
1 21 (13.46%) Azure
2 15 (9.62%) Azure DevOps
3 7 (4.49%) AWS
3 7 (4.49%) PaaS
4 6 (3.85%) Microsoft 365
5 5 (3.21%) Cloud Computing
5 5 (3.21%) IaaS
6 4 (2.56%) Amazon EC2
6 4 (2.56%) Virtual Private Cloud
7 3 (1.92%) Serverless
8 2 (1.28%) Azure App Service
8 2 (1.28%) Azure Cognitive Services
8 2 (1.28%) Azure Event Grid
8 2 (1.28%) Azure Functions
8 2 (1.28%) ChatGPT
8 2 (1.28%) Google Docs
8 2 (1.28%) Google Sheets
8 2 (1.28%) Power Platform
9 1 (0.64%) Dynamics 365
9 1 (0.64%) Microsoft Purview
Communications & Networking
1 7 (4.49%) 3G
1 7 (4.49%) 4G
2 5 (3.21%) J1939
3 4 (2.56%) VPN
4 2 (1.28%) FTP
5 1 (0.64%) Cisco ISE
5 1 (0.64%) DNS
5 1 (0.64%) GPRS
5 1 (0.64%) HTTP
5 1 (0.64%) InfiniBand
5 1 (0.64%) LAN
5 1 (0.64%) LTE
5 1 (0.64%) Network Security
5 1 (0.64%) SDH
5 1 (0.64%) TCP/IP
5 1 (0.64%) VSAT
5 1 (0.64%) WAN
5 1 (0.64%) Wireless
Database & Business Intelligence
1 12 (7.69%) Metadata
2 7 (4.49%) SQL Server
3 6 (3.85%) Ingres
4 4 (2.56%) Amazon RDS
5 3 (1.92%) Data Lake
6 2 (1.28%) Power BI
7 1 (0.64%) Geospatial Data
7 1 (0.64%) GIS
7 1 (0.64%) Microsoft Analysis Services
7 1 (0.64%) Power Query
7 1 (0.64%) Sisense
7 1 (0.64%) SQL Server Analysis Services
7 1 (0.64%) SQL Server Reporting Services
7 1 (0.64%) Tableau
Development Applications
1 11 (7.05%) ERwin
2 7 (4.49%) Git
3 4 (2.56%) Cypress.io
3 4 (2.56%) Jenkins
3 4 (2.56%) JIRA
4 3 (1.92%) NUnit
4 3 (1.92%) Postman
4 3 (1.92%) Visual Studio
5 2 (1.28%) Rational DOORS
General
1 104 (66.67%) Marketing
2 102 (65.38%) Telecoms
3 100 (64.10%) Finance
3 100 (64.10%) Manufacturing
4 99 (63.46%) Public Sector
5 30 (19.23%) Social Skills
6 27 (17.31%) Automotive
7 15 (9.62%) Analytical Skills
7 15 (9.62%) Retail
8 9 (5.77%) Aerospace
9 7 (4.49%) Pharmaceutical
10 3 (1.92%) German Language
10 3 (1.92%) Legal
11 2 (1.28%) French Language
11 2 (1.28%) Italian Language
11 2 (1.28%) Spanish Language
12 1 (0.64%) Arabic Language
12 1 (0.64%) Fire and Rescue
12 1 (0.64%) Organisational Skills
12 1 (0.64%) Presentation Skills
Job Titles
1 27 (17.31%) Architect
2 19 (12.18%) Lead
3 18 (11.54%) Project Manager
4 16 (10.26%) Software Engineer
5 14 (8.97%) Embedded Engineer
5 14 (8.97%) Embedded Software Engineer
6 13 (8.33%) Data Architect
7 11 (7.05%) Azure Engineer
7 11 (7.05%) Enterprise Architect
7 11 (7.05%) Enterprise Data Architect
8 9 (5.77%) DBA
9 8 (5.13%) Author
9 8 (5.13%) Support Engineer
9 8 (5.13%) Technical Author
10 7 (4.49%) Analyst
10 7 (4.49%) Developer
10 7 (4.49%) Systems Engineer
10 7 (4.49%) Technical Architect
10 7 (4.49%) Test Engineer
11 6 (3.85%) C# Developer
Libraries, Frameworks & Software Standards
1 8 (5.13%) .NET
2 7 (4.49%) AngularJS
3 5 (3.21%) GraphQL
4 4 (2.56%) RESTful
5 3 (1.92%) Playwright
5 3 (1.92%) PyTorch
6 2 (1.28%) .NET Framework
6 2 (1.28%) CSS
6 2 (1.28%) Entity Framework
6 2 (1.28%) Hugging Face
6 2 (1.28%) LangChain
6 2 (1.28%) Swagger
6 2 (1.28%) YAML
7 1 (0.64%) ASP.NET
7 1 (0.64%) Elastic Stack
7 1 (0.64%) MDX
7 1 (0.64%) TensorFlow
7 1 (0.64%) Vue
7 1 (0.64%) Web Services
7 1 (0.64%) XML
Miscellaneous
1 11 (7.05%) Data Protection Act
1 11 (7.05%) Wiki
2 5 (3.21%) Analytical Mindset
2 5 (3.21%) CAN bus
2 5 (3.21%) Management Information System
3 4 (2.56%) Cyber Threat
3 4 (2.56%) NHS
3 4 (2.56%) Product Ownership
4 3 (1.92%) Onboarding
5 2 (1.28%) Cloud Native
5 2 (1.28%) Public Cloud
6 1 (0.64%) Digital Media
6 1 (0.64%) Mobile App
6 1 (0.64%) Operational Technology
6 1 (0.64%) Photography
6 1 (0.64%) SCADA
6 1 (0.64%) Smartcard
6 1 (0.64%) Social Media
6 1 (0.64%) Team-Oriented Environment
Operating Systems
1 9 (5.77%) Linux
2 8 (5.13%) Windows
3 4 (2.56%) Windows 7
4 3 (1.92%) Windows Server
5 2 (1.28%) Android
6 1 (0.64%) Apple iOS
6 1 (0.64%) Windows Server 2008
6 1 (0.64%) Windows Server 2012
Processes & Methodologies
1 100 (64.10%) Programme Management
2 99 (63.46%) Business Intelligence
2 99 (63.46%) Digital Marketing
3 34 (21.79%) Agile
4 32 (20.51%) Software Engineering
5 24 (15.38%) Project Management
6 19 (12.18%) Stakeholder Management
7 17 (10.90%) Continuous Improvement
8 16 (10.26%) DevOps
9 15 (9.62%) Waterfall
10 13 (8.33%) Data Governance
10 13 (8.33%) Data Management
10 13 (8.33%) Data Modelling
11 12 (7.69%) Data Architecture
11 12 (7.69%) Data Strategy
11 12 (7.69%) Problem-Solving
12 11 (7.05%) Data Flow Diagram
12 11 (7.05%) Data Protection
12 11 (7.05%) Domain Models
12 11 (7.05%) Master Data Management
Programming Languages
1 16 (10.26%) SQL
2 14 (8.97%) C
2 14 (8.97%) Embedded C
3 9 (5.77%) Python
4 8 (5.13%) PowerShell
5 7 (4.49%) C#
6 6 (3.85%) Kusto Query Language
7 3 (1.92%) Java
7 3 (1.92%) JavaScript
7 3 (1.92%) TypeScript
8 2 (1.28%) MATLAB
9 1 (0.64%) Bash
9 1 (0.64%) Bicep
9 1 (0.64%) C++
9 1 (0.64%) Data Analysis Expressions
9 1 (0.64%) T-SQL
9 1 (0.64%) VBA
Qualifications
1 41 (26.28%) Security Cleared
2 29 (18.59%) SC Cleared
3 17 (10.90%) DV Cleared
4 8 (5.13%) Degree
5 5 (3.21%) AWS Certification
6 4 (2.56%) ISTQB
7 3 (1.92%) Azure Certification
7 3 (1.92%) Master's Degree
8 2 (1.28%) Computer Science Degree
9 1 (0.64%) BPSS Clearance
9 1 (0.64%) ITIL Certification
9 1 (0.64%) MCSE
9 1 (0.64%) Microsoft Certification
9 1 (0.64%) PRINCE2 Practitioner
Quality Assurance & Compliance
1 13 (8.33%) GDPR
2 11 (7.05%) Data Quality
3 9 (5.77%) AUTOSAR
4 4 (2.56%) Automotive SPICE
4 4 (2.56%) QA
4 4 (2.56%) SLA
5 3 (1.92%) Accessibility
6 2 (1.28%) California Consumer Privacy Act
7 1 (0.64%) PCI DSS
7 1 (0.64%) PMO
System Software
1 5 (3.21%) Active Directory
1 5 (3.21%) Docker
2 2 (1.28%) Firmware
3 1 (0.64%) Hyper-V
3 1 (0.64%) Virtual Machines
3 1 (0.64%) VMware Infrastructure
Systems Management
1 9 (5.77%) Terraform
2 5 (3.21%) Functional Safety
3 2 (1.28%) Kubernetes
4 1 (0.64%) Ansible
4 1 (0.64%) AppManager
4 1 (0.64%) Dell DRAC
4 1 (0.64%) Grafana
4 1 (0.64%) Prometheus
4 1 (0.64%) Puppet
Vendors
1 99 (63.46%) SAP
2 16 (10.26%) Microsoft
3 12 (7.69%) Sparx
4 5 (3.21%) Mentor Graphics
5 4 (2.56%) Computacenter
6 3 (1.92%) Dell
6 3 (1.92%) Google
7 2 (1.28%) Actian
7 2 (1.28%) Cisco
7 2 (1.28%) EMC
7 2 (1.28%) VMware
8 1 (0.64%) Facebook
8 1 (0.64%) ForeScout
8 1 (0.64%) Instagram
8 1 (0.64%) Isilon
8 1 (0.64%) Oracle
8 1 (0.64%) Samsung
8 1 (0.64%) ServiceNow
8 1 (0.64%) Twitter
8 1 (0.64%) YouTube