Retail Contracts with Hybrid/Remote/WFH Options

Retailing
UK > Work from Home

The table below looks at the prevalence of the term Retail in remote or hybrid contract work. Included is a benchmarking guide to the contractor rates offered in vacancies that cited Retail over the 6 months leading up to 1 May 2025, comparing them to the same period in the previous two years.

6 months to
1 May 2025
Same period 2024 Same period 2023
Rank 84 78 92
Rank change year-on-year -6 +14 -31
Contract jobs citing Retail 289 397 655
As % of all contract jobs with a WFH option 2.92% 2.59% 2.53%
As % of the General category 4.68% 4.39% 4.34%
Number of daily rates quoted 164 232 418
10th Percentile £284 £307 £363
25th Percentile £401 £400 £425
Median daily rate (50th Percentile) £500 £500 £525
Median % change year-on-year - -4.76% -
75th Percentile £613 £650 £600
90th Percentile £753 £725 £750
UK median daily rate £523 £505 £525
% change year-on-year +3.47% -3.81% -2.78%
Number of hourly rates quoted 2 3 7
10th Percentile £15.85 £24.22 -
25th Percentile £16.75 £26.44 -
Median hourly rate £19.00 £30.12 £22.16
Median % change year-on-year -36.92% +35.92% +3.07%
75th Percentile £21.75 £36.31 £27.42
90th Percentile £22.95 £40.02 £32.67
UK median hourly rate £32.00 £16.00 £19.81
% change year-on-year +100.00% -19.23% +20.06%

All General Skills
Work from Home

Retail falls under the General Skills category. For comparison with the information above, the following table provides summary statistics for all contract job vacancies with remote or hybrid options requiring common skills.

Contract vacancies with a requirement for common skills 6,176 9,033 15,091
As % of all contract jobs with a WFH option 62.35% 58.87% 58.36%
Number of daily rates quoted 4,155 5,908 10,633
10th Percentile £325 £331 £363
25th Percentile £419 £425 £450
Median daily rate (50th Percentile) £525 £538 £550
Median % change year-on-year -2.33% -2.27% +4.76%
75th Percentile £650 £650 £675
90th Percentile £800 £775 £775
UK median daily rate £525 £525 £550
% change year-on-year - -4.55% +2.80%
Number of hourly rates quoted 182 477 347
10th Percentile £14.00 £14.03 £19.04
25th Percentile £18.50 £22.61 £29.31
Median hourly rate £32.05 £38.12 £50.00
Median % change year-on-year -15.92% -23.76% +61.29%
75th Percentile £64.69 £53.00 £67.50
90th Percentile £85.93 £72.50 £80.25
UK median hourly rate £27.50 £30.00 £35.00
% change year-on-year -8.33% -14.29% +59.31%

Retail
Trend for Jobs with a WFH Option

Job vacancies with remote working options citing Retail as a proportion of all IT jobs advertised.
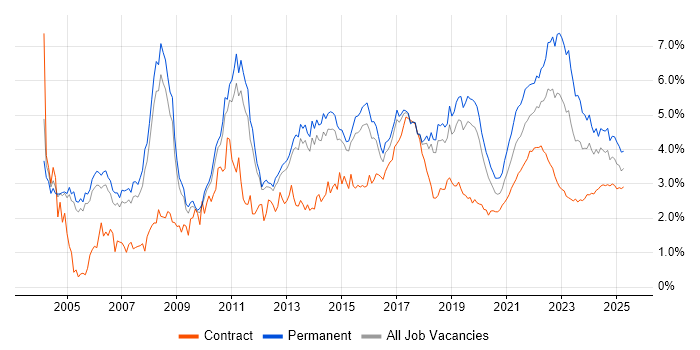
Retail trend for jobs with Hybrid/Remote/WFH options

Retail
Daily Rate Trend for Jobs with a WFH Option

3-month moving average daily rate quoted in job vacancies with remote working options citing Retail.

Retail daily rate for jobs with a WFH option

Retail
Daily Rate Histogram for Jobs with a WFH Option

Daily rate distribution for jobs with remote working options citing Retail over the 6 months to 1 May 2025.

Retail daily rate histogram for jobs with a WFH option

Retail
Hourly Rate Trend for Jobs with a WFH Option

3-month moving average hourly rate quoted in job vacancies with remote working options citing Retail.

Retail hourly rate for jobs with a WFH option

Retail
Co-occurring Skills and Capabilities with WFH Options by Category

The follow tables expand on the table above by listing co-occurrences grouped by category. The same employment type, locality and period is covered with up to 20 co-occurrences shown in each of the following categories:

Application Platforms
1 5 (1.73%) SharePoint
2 2 (0.69%) Apache Airflow
2 2 (0.69%) Apache Spark
2 2 (0.69%) CMS
2 2 (0.69%) Confluence
2 2 (0.69%) Jupyter
3 1 (0.35%) Headless CMS
3 1 (0.35%) SAS
Applications
1 15 (5.19%) Microsoft Excel
2 7 (2.42%) Microsoft PowerPoint
3 6 (2.08%) Microsoft Office
4 3 (1.04%) MS Visio
5 1 (0.35%) Adobe After Effects
5 1 (0.35%) Adobe Illustrator
5 1 (0.35%) Microsoft Project
5 1 (0.35%) Photoshop
Business Applications
1 18 (6.23%) SAP S/4HANA
2 8 (2.77%) SAP MDG
2 8 (2.77%) SAP Retail
3 5 (1.73%) SAP CAR
4 2 (0.69%) Payment Gateway
4 2 (0.69%) SAP FI
5 1 (0.35%) Demantra
5 1 (0.35%) Dynamics CRM
5 1 (0.35%) Dynamics NAV
5 1 (0.35%) Remedy ITSM
5 1 (0.35%) SAP CO
5 1 (0.35%) SAP EWM
5 1 (0.35%) SAP FI/CO
5 1 (0.35%) SAP Forecasting and Replenishment
5 1 (0.35%) SAP FSCM
5 1 (0.35%) SAP GTS
5 1 (0.35%) SAP MM
5 1 (0.35%) SAP POS DM
5 1 (0.35%) SAP SD
5 1 (0.35%) Shopify
Cloud Services
1 45 (15.57%) Azure
2 30 (10.38%) AWS
3 18 (6.23%) Dynamics 365
4 17 (5.88%) Azure DevOps
5 10 (3.46%) Power Platform
6 5 (1.73%) GitHub
6 5 (1.73%) PowerApps
6 5 (1.73%) SaaS
7 4 (1.38%) GCP
7 4 (1.38%) Power Automate
7 4 (1.38%) Snowflake
7 4 (1.38%) WhatsApp
8 3 (1.04%) Azure Cosmos DB
8 3 (1.04%) Azure Synapse Analytics
8 3 (1.04%) dbt
8 3 (1.04%) IBM Blueworks
9 2 (0.69%) Azure Data Factory
9 2 (0.69%) Azure Logic Apps
9 2 (0.69%) Serverless
9 2 (0.69%) SuccessFactors
Communications & Networking
1 7 (2.42%) WAN
2 5 (1.73%) DHCP
2 5 (1.73%) DNS
2 5 (1.73%) LAN
3 3 (1.04%) Firewall
3 3 (1.04%) SD-WAN
4 2 (0.69%) BGP
4 2 (0.69%) Internet
4 2 (0.69%) OSPF
4 2 (0.69%) VPN
4 2 (0.69%) Wi-Fi
5 1 (0.35%) DWDM
5 1 (0.35%) HTTP
5 1 (0.35%) HTTPS
5 1 (0.35%) IGRP
5 1 (0.35%) IPsec
5 1 (0.35%) MPLS
5 1 (0.35%) SNMP
5 1 (0.35%) SSL
5 1 (0.35%) VRRP
Database & Business Intelligence
1 12 (4.15%) Data Warehouse
2 8 (2.77%) Data Lake
2 8 (2.77%) Tableau
3 5 (1.73%) Power BI
4 3 (1.04%) Azure SQL Database
4 3 (1.04%) Data Mining
4 3 (1.04%) Data Vault
4 3 (1.04%) Relational Database
4 3 (1.04%) SAP BW
5 2 (0.69%) Azure SQL Data Warehouse
5 2 (0.69%) MySQL
5 2 (0.69%) PostgreSQL
5 2 (0.69%) SQL Server Integration Services
6 1 (0.35%) Big Data
6 1 (0.35%) BigQuery
6 1 (0.35%) DynamoDB
6 1 (0.35%) Elasticsearch
6 1 (0.35%) Metadata
6 1 (0.35%) NoSQL
6 1 (0.35%) Power Query
Development Applications
1 6 (2.08%) JIRA
2 5 (1.73%) Git
3 4 (1.38%) Oracle APEX
4 2 (0.69%) Bitbucket
4 2 (0.69%) SpecFlow
4 2 (0.69%) Team Foundation Server
5 1 (0.35%) Cypress.io
5 1 (0.35%) Jenkins
5 1 (0.35%) Spock
5 1 (0.35%) TestComplete
General
1 75 (25.95%) Social Skills
2 63 (21.80%) Finance
3 54 (18.69%) Analytical Skills
4 29 (10.03%) Banking
5 25 (8.65%) Marketing
6 18 (6.23%) Corporate Banking
6 18 (6.23%) Investment Banking
6 18 (6.23%) Retail Banking
7 13 (4.50%) Telecoms
8 11 (3.81%) Manufacturing
9 7 (2.42%) Billing
9 7 (2.42%) Presentation Skills
10 6 (2.08%) Back Office
11 5 (1.73%) Inclusion and Diversity
12 4 (1.38%) Automotive
12 4 (1.38%) Influencing Skills
13 3 (1.04%) Legal
13 3 (1.04%) Pharmaceutical
14 2 (0.69%) Advertising
14 2 (0.69%) Law
Job Titles
1 42 (14.53%) Consultant
2 36 (12.46%) Analyst
3 28 (9.69%) Developer
4 26 (9.00%) Architect
4 26 (9.00%) Senior
5 22 (7.61%) Project Manager
6 17 (5.88%) Lead
7 14 (4.84%) Solutions Architect
8 13 (4.50%) Business Analyst
9 12 (4.15%) SAP Consultant
10 10 (3.46%) Dynamics 365 Consultant
11 9 (3.11%) IT Manager
12 8 (2.77%) Data Engineer
12 8 (2.77%) Delivery Manager
13 7 (2.42%) Data Analyst
13 7 (2.42%) Functional Consultant
13 7 (2.42%) IT Operations Manager
13 7 (2.42%) Operations Manager
13 7 (2.42%) Performance Manager
14 6 (2.08%) Data Steward
Libraries, Frameworks & Software Standards
1 9 (3.11%) Kafka
2 8 (2.77%) Spring
2 8 (2.77%) Spring Boot
3 7 (2.42%) Micronaut
4 6 (2.08%) .NET
4 6 (2.08%) Node.js
4 6 (2.08%) PySpark
4 6 (2.08%) React
5 5 (1.73%) HTML
5 5 (1.73%) LDAP
6 4 (1.38%) AWS CDK
7 3 (1.04%) CSS
7 3 (1.04%) Web Services
8 2 (0.69%) Matplotlib
8 2 (0.69%) Middleware
8 2 (0.69%) OAuth
8 2 (0.69%) OpenID
8 2 (0.69%) SAP Fiori
8 2 (0.69%) scikit-learn
8 2 (0.69%) Vue
Miscellaneous
1 10 (3.46%) EPoS
2 9 (3.11%) FMCG
2 9 (3.11%) Product Ownership
3 6 (2.08%) Onboarding
4 5 (1.73%) Digital Media
5 4 (1.38%) Data Centre
5 4 (1.38%) Greenfield Project
5 4 (1.38%) Legacy Systems
6 3 (1.04%) Algorithms
6 3 (1.04%) Cloud Native
6 3 (1.04%) Enterprise Software
6 3 (1.04%) Social Media
7 2 (0.69%) Blog
7 2 (0.69%) Data Structures
7 2 (0.69%) Digital Signage
7 2 (0.69%) Management Information System
7 2 (0.69%) Mobile App
7 2 (0.69%) PMI
7 2 (0.69%) Replication
8 1 (0.35%) Renewable Energy
Operating Systems
1 8 (2.77%) Windows
2 3 (1.04%) Linux
3 2 (0.69%) Android
3 2 (0.69%) Windows Server
4 1 (0.35%) Apple iOS
4 1 (0.35%) Red Hat Enterprise Linux
4 1 (0.35%) Windows Server 2012
4 1 (0.35%) Windows Server 2019
Processes & Methodologies
1 50 (17.30%) Agile
2 42 (14.53%) Problem-Solving
2 42 (14.53%) Stakeholder Management
3 29 (10.03%) E-Commerce
3 29 (10.03%) Migration
4 25 (8.65%) Analytics
4 25 (8.65%) Project Management
5 24 (8.30%) DevOps
6 23 (7.96%) User Experience
7 22 (7.61%) Roadmaps
8 21 (7.27%) ERP
9 20 (6.92%) Data Modelling
9 20 (6.92%) Stakeholder Engagement
9 20 (6.92%) Workshop Facilitation
10 19 (6.57%) Wealth Management
11 18 (6.23%) Decision-Making
11 18 (6.23%) Requirements Gathering
12 17 (5.88%) Data Analysis
13 16 (5.54%) ETL
14 13 (4.50%) Data Migration
Programming Languages
1 31 (10.73%) SQL
2 20 (6.92%) Python
3 11 (3.81%) Java
4 5 (1.73%) JavaScript
5 4 (1.38%) PL/SQL
5 4 (1.38%) TypeScript
6 3 (1.04%) Go
6 3 (1.04%) PHP
6 3 (1.04%) PowerShell
7 2 (0.69%) ABAP
7 2 (0.69%) C#
7 2 (0.69%) Perl
7 2 (0.69%) Scala
8 1 (0.35%) Apex Code
8 1 (0.35%) Data Analysis Expressions
8 1 (0.35%) Groovy
8 1 (0.35%) R
8 1 (0.35%) SOQL
8 1 (0.35%) SOSL
8 1 (0.35%) T-SQL
Qualifications
1 10 (3.46%) Degree
2 5 (1.73%) CISM
2 5 (1.73%) CISSP
3 4 (1.38%) PMI Certification
4 3 (1.04%) ITIL Certification
4 3 (1.04%) TOGAF Certification
5 2 (0.69%) CEH
5 2 (0.69%) Cisco Certification
5 2 (0.69%) Computer Science Degree
5 2 (0.69%) PCI QSA
5 2 (0.69%) PMP
5 2 (0.69%) SAP Certification
6 1 (0.35%) AAT
6 1 (0.35%) ACCA
6 1 (0.35%) AWS Certification
6 1 (0.35%) CCDP
6 1 (0.35%) CCIE
6 1 (0.35%) CCNP
6 1 (0.35%) CIMA
6 1 (0.35%) ISTQB
Quality Assurance & Compliance
1 8 (2.77%) PMO
1 8 (2.77%) QA
2 7 (2.42%) Data Quality
2 7 (2.42%) GDPR
3 6 (2.08%) NIST
4 5 (1.73%) ISO/IEC 27001
4 5 (1.73%) PCI DSS
5 4 (1.38%) SLA
6 3 (1.04%) GAAP
6 3 (1.04%) IFRS
7 2 (0.69%) Accessibility
7 2 (0.69%) NIST 800
7 2 (0.69%) P3O
7 2 (0.69%) Sarbanes-Oxley
8 1 (0.35%) Basel III
8 1 (0.35%) California Consumer Privacy Act
8 1 (0.35%) EU AI Act
8 1 (0.35%) GRC
System Software
1 7 (2.42%) Active Directory
2 6 (2.08%) Docker
3 2 (0.69%) Hyper-V
4 1 (0.35%) Firmware
4 1 (0.35%) Gluster
4 1 (0.35%) GlusterFS
4 1 (0.35%) Virtual Machines
4 1 (0.35%) VMware ESXi
4 1 (0.35%) VMware Infrastructure
4 1 (0.35%) VMware NSX
Systems Management
1 7 (2.42%) Kubernetes
2 4 (1.38%) Terraform
3 1 (0.35%) Ansible
3 1 (0.35%) Single Sign-On
Vendors
1 39 (13.49%) SAP
2 26 (9.00%) Microsoft
3 17 (5.88%) Ariba
4 12 (4.15%) Oracle
5 8 (2.77%) Databricks
5 8 (2.77%) Splunk
6 6 (2.08%) Salesforce
7 4 (1.38%) Dynatrace
7 4 (1.38%) Planview
7 4 (1.38%) ServiceNow
8 3 (1.04%) Fujitsu
8 3 (1.04%) Google
8 3 (1.04%) Workday
9 2 (0.69%) Adobe
9 2 (0.69%) Cisco
9 2 (0.69%) CyberArk
9 2 (0.69%) Facebook
9 2 (0.69%) Palo Alto
9 2 (0.69%) VMware
9 2 (0.69%) Zscaler