Test Automation Jobs in the City of London

Automated Testing
Central London > City of London

The following table provides summary statistics for permanent job vacancies advertised in the City of London with a requirement for Test Automation skills. Included is a benchmarking guide to the salaries offered in vacancies that have cited Test Automation over the 6 months to 10 May 2024 with a comparison to the same period in the previous 2 years.

6 months to
10 May 2024
Same period 2023 Same period 2022
Rank 75 64 36
Rank change year-on-year -11 -28 -10
Permanent jobs citing Test Automation 115 199 512
As % of all permanent jobs advertised in the City of London 3.42% 4.30% 7.20%
As % of the Processes & Methodologies category 3.72% 4.51% 7.55%
Number of salaries quoted 84 177 419
10th Percentile £46,250 £47,500 £45,000
25th Percentile £64,688 £62,500 £57,500
Median annual salary (50th Percentile) £80,000 £77,500 £70,000
Median % change year-on-year +3.23% +10.71% -6.67%
75th Percentile £102,500 £95,000 £90,000
90th Percentile £114,250 £110,500 £101,250
Central London median annual salary £80,000 £77,500 £70,000
% change year-on-year +3.23% +10.71% -6.67%

All Process and Methodology Skills
City of London

Test Automation is in the Processes and Methodologies category. The following table is for comparison with the above and provides summary statistics for all permanent job vacancies advertised in the City of London with a requirement for process or methodology skills.

Permanent vacancies with a requirement for process or methodology skills 3,092 4,410 6,783
As % of all permanent jobs advertised in the City of London 92.08% 95.27% 95.43%
Number of salaries quoted 2,446 3,687 5,564
10th Percentile £41,250 £43,750 £45,500
25th Percentile £55,000 £56,250 £57,239
Median annual salary (50th Percentile) £75,000 £75,000 £72,500
Median % change year-on-year - +3.45% -
75th Percentile £95,000 £97,500 £93,750
90th Percentile £112,500 £112,500 £110,000
Central London median annual salary £72,500 £75,000 £72,500
% change year-on-year -3.33% +3.45% +3.57%

Test Automation
Job Vacancy Trend in the City of London

Job postings citing Test Automation as a proportion of all IT jobs advertised in the City of London.
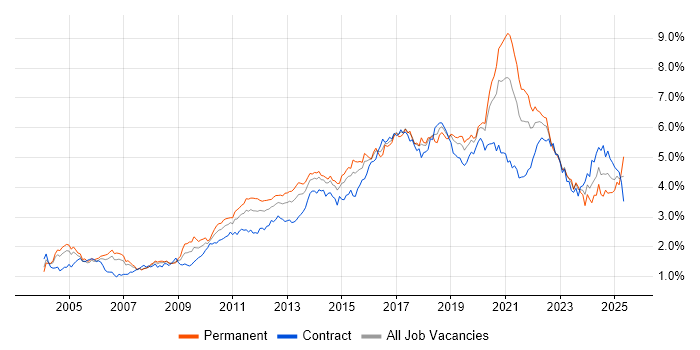
Job vacancy trend for Test Automation in the City of London

Test Automation
Salary Trend in the City of London

3-month moving average salary quoted in jobs citing Test Automation in the City of London.

Salary trend for Test Automation in the City of London

Test Automation
Salary Histogram in the City of London

Salary distribution for jobs citing Test Automation in the City of London over the 6 months to 10 May 2024.

Salary histogram for Test Automation in the City of London

Test Automation
Co-occurring Skills and Capabilities in the City of London by Category

The follow tables expand on the table above by listing co-occurrences grouped by category. The same employment type, locality and period is covered with up to 20 co-occurrences shown in each of the following categories:

Application Platforms
1 5 (4.35%) Confluence
2 4 (3.48%) SharePoint
3 2 (1.74%) Moodle
4 1 (0.87%) Apache Airflow
4 1 (0.87%) IIS
4 1 (0.87%) MQSeries
4 1 (0.87%) WordPress
Applications
1 1 (0.87%) Microsoft Excel
1 1 (0.87%) Microsoft PowerPoint
Business Applications
1 2 (1.74%) Teamcenter
2 1 (0.87%) Dynamics CRM
Cloud Services
1 39 (33.91%) AWS
2 25 (21.74%) Azure
3 18 (15.65%) Azure DevOps
4 13 (11.30%) SaaS
5 11 (9.57%) PaaS
6 10 (8.70%) GCP
6 10 (8.70%) Power Platform
7 8 (6.96%) Serverless
8 7 (6.09%) AWS Lambda
9 6 (5.22%) Amazon EKS
9 6 (5.22%) Amazon S3
9 6 (5.22%) Azure AKS
9 6 (5.22%) Entra ID
9 6 (5.22%) IaaS
10 5 (4.35%) Azure Cognitive Services
10 5 (4.35%) Snowflake
11 4 (3.48%) Amazon EC2
11 4 (3.48%) Amazon ECS
12 3 (2.61%) Azure Logic Apps
12 3 (2.61%) Microsoft 365
Communications & Networking
1 6 (5.22%) DNS
2 1 (0.87%) Firewall
2 1 (0.87%) Intrusion Detection
2 1 (0.87%) Network Security
Database & Business Intelligence
1 11 (9.57%) MongoDB
2 8 (6.96%) Data Warehouse
3 7 (6.09%) NoSQL
4 6 (5.22%) Relational Database
5 5 (4.35%) SQL Server
6 4 (3.48%) Amazon RDS
6 4 (3.48%) Big Data
6 4 (3.48%) DynamoDB
6 4 (3.48%) PostgreSQL
6 4 (3.48%) Power BI
6 4 (3.48%) Semantic Layer
7 3 (2.61%) Metadata
7 3 (2.61%) MySQL
8 2 (1.74%) Data Vault
9 1 (0.87%) Azure SQL Database
9 1 (0.87%) BigQuery
9 1 (0.87%) Data Lake
9 1 (0.87%) Delta Lake
9 1 (0.87%) Oracle Reports
9 1 (0.87%) SQL Server Integration Services
Development Applications
1 17 (14.78%) Git
1 17 (14.78%) JUnit
2 13 (11.30%) Selenium
3 11 (9.57%) Jenkins
4 9 (7.83%) JIRA
4 9 (7.83%) JMeter
5 6 (5.22%) Cypress.io
6 4 (3.48%) Cucumber
6 4 (3.48%) WebDriver
7 3 (2.61%) Atlassian Bamboo
7 3 (2.61%) GitLab
7 3 (2.61%) Postman
7 3 (2.61%) SoapUI
7 3 (2.61%) SpecFlow
8 2 (1.74%) JBehave
8 2 (1.74%) TeamCity
8 2 (1.74%) Visual Studio
9 1 (0.87%) Bitbucket
9 1 (0.87%) Bugzilla
9 1 (0.87%) NUnit
General
1 33 (28.70%) Social Skills
2 28 (24.35%) Finance
3 15 (13.04%) Analytical Skills
4 9 (7.83%) Law
5 8 (6.96%) Marketing
6 7 (6.09%) Inclusion and Diversity
7 5 (4.35%) Banking
8 3 (2.61%) Billing
8 3 (2.61%) Financial Institution
8 3 (2.61%) Organisational Skills
8 3 (2.61%) Presentation Skills
9 2 (1.74%) Front Office
10 1 (0.87%) Back Office
10 1 (0.87%) Documentation Skills
10 1 (0.87%) Games
10 1 (0.87%) Health Technology
10 1 (0.87%) Investment Banking
10 1 (0.87%) Public Sector
Job Titles
1 32 (27.83%) Lead
2 25 (21.74%) Developer
3 17 (14.78%) Senior
4 8 (6.96%) Data Engineer
5 7 (6.09%) Software Engineer
6 6 (5.22%) JavaScript Developer
6 6 (5.22%) Senior Developer
6 6 (5.22%) Senior JavaScript Developer
7 5 (4.35%) Analyst
7 5 (4.35%) IT Director
7 5 (4.35%) Operations Director
7 5 (4.35%) Services Director
8 4 (3.48%) Architect
8 4 (3.48%) AWS Engineer
8 4 (3.48%) Cloud Engineer
8 4 (3.48%) DevOps Engineer
8 4 (3.48%) Principal Engineer
8 4 (3.48%) QA Engineer
8 4 (3.48%) Scala Developer
8 4 (3.48%) Tester
Libraries, Frameworks & Software Standards
1 21 (18.26%) .NET
2 20 (17.39%) JSON
3 17 (14.78%) REST
4 13 (11.30%) React
5 12 (10.43%) HTML
6 9 (7.83%) Node.js
7 7 (6.09%) .NET Framework
7 7 (6.09%) Web Services
8 6 (5.22%) jQuery
9 5 (4.35%) CSS
9 5 (4.35%) RESTful
9 5 (4.35%) Spring
9 5 (4.35%) Spring Boot
10 4 (3.48%) ASP.NET
10 4 (3.48%) Playwright
10 4 (3.48%) XML
11 3 (2.61%) Apache Thrift
11 3 (2.61%) Kafka
11 3 (2.61%) Pandas
12 2 (1.74%) Itk
Miscellaneous
1 5 (4.35%) CMDB
1 5 (4.35%) Data Structures
2 3 (2.61%) Greenfield Project
2 3 (2.61%) Legacy Applications
3 2 (1.74%) Hedge funds
3 2 (1.74%) Learning Management System
3 2 (1.74%) Linux Command Line
3 2 (1.74%) Management Information System
3 2 (1.74%) Reference Data
4 1 (0.87%) Bitcoin
4 1 (0.87%) Derivative
4 1 (0.87%) Distributed Systems
4 1 (0.87%) Foreign Exchange (FX)
4 1 (0.87%) Mobile App
4 1 (0.87%) PropTech
4 1 (0.87%) Security Posture
4 1 (0.87%) Semantic Web
Operating Systems
1 4 (3.48%) Linux
2 3 (2.61%) Windows
3 2 (1.74%) Android
3 2 (1.74%) Apple iOS
4 1 (0.87%) Unix
Processes & Methodologies
1 69 (60.00%) Agile
2 33 (28.70%) DevOps
3 27 (23.48%) CI/CD
4 25 (21.74%) SDET
5 24 (20.87%) Test Strategy
6 23 (20.00%) Problem-Solving
7 17 (14.78%) Software Testing
7 17 (14.78%) Unit Testing
8 16 (13.91%) ITIL
8 16 (13.91%) OO
9 15 (13.04%) Mentoring
9 15 (13.04%) Test Planning
10 14 (12.17%) Scrum
11 13 (11.30%) Computer Science
12 12 (10.43%) Decision-Making
12 12 (10.43%) Full Stack Development
12 12 (10.43%) Software Engineering
13 11 (9.57%) Code Quality
13 11 (9.57%) Microservices
13 11 (9.57%) SDLC
Programming Languages
1 31 (26.96%) Java
2 28 (24.35%) Python
3 26 (22.61%) JavaScript
4 20 (17.39%) SQL
5 10 (8.70%) C#
6 8 (6.96%) PowerShell
7 7 (6.09%) TypeScript
8 6 (5.22%) PHP
9 5 (4.35%) C++
10 4 (3.48%) Go
10 4 (3.48%) Scala
11 2 (1.74%) C
11 2 (1.74%) Kotlin
11 2 (1.74%) Shell Script
12 1 (0.87%) Apex Code
12 1 (0.87%) SPARQL
12 1 (0.87%) T-SQL
Qualifications
1 14 (12.17%) Degree
2 12 (10.43%) Security Cleared
3 11 (9.57%) Computer Science Degree
4 6 (5.22%) SC Cleared
5 5 (4.35%) ITIL Certification
6 4 (3.48%) AWS Certification
7 2 (1.74%) ISO 27001 Lead Auditor
7 2 (1.74%) MCAD
7 2 (1.74%) Microsoft Certification
8 1 (0.87%) AWS Certified Developer
8 1 (0.87%) ISEB
8 1 (0.87%) ISTQB
8 1 (0.87%) Master's Degree
8 1 (0.87%) PhD
Quality Assurance & Compliance
1 15 (13.04%) QA
2 10 (8.70%) ISO/IEC 27001
3 7 (6.09%) ISO 9001
4 3 (2.61%) ITGC
4 3 (2.61%) SOC 1
4 3 (2.61%) SOC 2
5 1 (0.87%) Data Quality
5 1 (0.87%) GDPR
System Software
1 7 (6.09%) Docker
2 1 (0.87%) Firmware
Systems Management
1 14 (12.17%) Terraform
2 10 (8.70%) Kubernetes
3 3 (2.61%) Packer
4 1 (0.87%) cPanel
Vendors
1 6 (5.22%) Google
1 6 (5.22%) Microsoft
2 5 (4.35%) Automation Anywhere
2 5 (4.35%) Blue Prism
2 5 (4.35%) UiPath
3 2 (1.74%) Atlassian
3 2 (1.74%) Oracle
3 2 (1.74%) Salesforce
4 1 (0.87%) Brio
4 1 (0.87%) Databricks
4 1 (0.87%) DocuSign
4 1 (0.87%) IBM
4 1 (0.87%) MuleSoft
4 1 (0.87%) Solace
4 1 (0.87%) Splunk
4 1 (0.87%) TIBCO