VMware Jobs in the City of London

VMware
Central London > City of London

The table below provides summary statistics for permanent job vacancies advertised in the City of London requiring knowledge or experience of VMware products and/or services. It includes a benchmarking guide to the annual salaries offered in vacancies that cited VMware over the 6 months leading up to 17 May 2025, comparing them to the same period in the previous two years.

The figures below represent the IT labour market in general and are not representative of salaries within VMware, Inc.

6 months to
17 May 2025
Same period 2024 Same period 2023
Rank 66 85 79
Rank change year-on-year +19 -6 +12
Permanent jobs citing VMware 73 106 177
As % of all permanent jobs advertised in the City of London 3.58% 3.17% 3.86%
As % of the Vendors category 7.78% 8.17% 9.88%
Number of salaries quoted 68 84 157
10th Percentile £36,625 £39,300 £37,850
25th Percentile £41,250 £47,500 £49,000
Median annual salary (50th Percentile) £57,750 £65,000 £65,000
Median % change year-on-year -11.15% - +10.64%
75th Percentile £82,500 £83,750 £73,750
90th Percentile £97,375 £87,500 £79,600
Central London median annual salary £65,000 £65,000 £65,000
% change year-on-year - - +13.04%

All Vendors
City of London

VMware falls under the Vendor Products and Services category. For comparison with the information above, the following table provides summary statistics for all permanent job vacancies requiring knowledge or experience of all vendor products and services in the City of London.

Permanent vacancies with a requirement for knowledge or experience of vendor products and services 938 1,297 1,792
As % of all permanent jobs advertised in the City of London 46.05% 38.80% 39.03%
Number of salaries quoted 695 976 1,412
10th Percentile £38,450 £37,000 £36,775
25th Percentile £48,500 £47,500 £50,000
Median annual salary (50th Percentile) £65,000 £70,000 £67,500
Median % change year-on-year -7.14% +3.70% -2.17%
75th Percentile £90,000 £87,500 £90,000
90th Percentile £110,750 £105,375 £105,000
Central London median annual salary £65,000 £67,500 £67,500
% change year-on-year -3.70% - +1.50%

VMware
Job Vacancy Trend in the City of London

Job postings citing VMware as a proportion of all IT jobs advertised in the City of London.
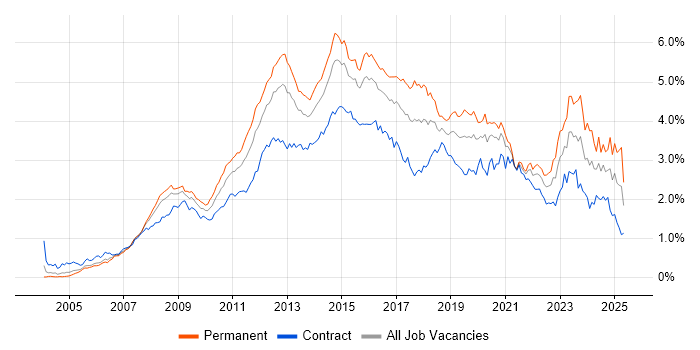
Job vacancy trend for VMware in the City of London

VMware
Salary Trend in the City of London

3-month moving average salary quoted in jobs citing VMware in the City of London.

Salary trend for VMware in the City of London

VMware
Salary Histogram in the City of London

Salary distribution for jobs citing VMware in the City of London over the 6 months to 17 May 2025.

Salary histogram for VMware in the City of London

VMware
Co-occurring Skills and Capabilities in the City of London by Category

The follow tables expand on the table above by listing co-occurrences grouped by category. The same employment type, locality and period is covered with up to 20 co-occurrences shown in each of the following categories:

Application Platforms
1 31 (42.47%) Microsoft Exchange
2 13 (17.81%) SharePoint
3 5 (6.85%) Exchange Server 2010
4 4 (5.48%) Exchange Server 2013
5 2 (2.74%) nginx
5 2 (2.74%) Tomcat
Applications
1 11 (15.07%) Microsoft Office
2 5 (6.85%) Microsoft PowerPoint
3 1 (1.37%) Microsoft Excel
3 1 (1.37%) MS Visio
Business Applications
1 3 (4.11%) Fidessa
2 1 (1.37%) Dynamics NAV
Cloud Services
1 43 (58.90%) Azure
2 32 (43.84%) Microsoft 365
3 15 (20.55%) Entra ID
4 14 (19.18%) AWS
5 11 (15.07%) OneDrive
6 9 (12.33%) Azure DevOps
6 9 (12.33%) GitHub
6 9 (12.33%) PaaS
7 8 (10.96%) GitHub Actions
8 6 (8.22%) Cloud Computing
8 6 (8.22%) GCP
9 4 (5.48%) Azure ExpressRoute
9 4 (5.48%) Nutanix
10 3 (4.11%) SaaS
11 2 (2.74%) Mimecast
12 1 (1.37%) Azure AKS
12 1 (1.37%) Google Workspace
12 1 (1.37%) IaaS
12 1 (1.37%) Power Platform
12 1 (1.37%) Serverless
Communications & Networking
1 14 (19.18%) DNS
1 14 (19.18%) Firewall
2 11 (15.07%) DHCP
2 11 (15.07%) VPN
3 9 (12.33%) WAN
4 8 (10.96%) LAN
4 8 (10.96%) VLAN
4 8 (10.96%) WebEx
5 7 (9.59%) Network Security
6 5 (6.85%) SD-WAN
7 4 (5.48%) Cisco ISE
7 4 (5.48%) Ethernet
7 4 (5.48%) NetScaler
7 4 (5.48%) SAN
8 3 (4.11%) IPsec
9 2 (2.74%) Multicast
9 2 (2.74%) PBX
9 2 (2.74%) TCP/IP
9 2 (2.74%) VoIP
10 1 (1.37%) Structured Cabling
Database & Business Intelligence
1 7 (9.59%) SQL Server
2 2 (2.74%) Data Warehouse
2 2 (2.74%) MySQL
3 1 (1.37%) Amazon RDS
3 1 (1.37%) Data Hub
3 1 (1.37%) Metadata
3 1 (1.37%) Power BI
3 1 (1.37%) SQL CLR
3 1 (1.37%) SQL Server Analysis Services
3 1 (1.37%) SQL Server Reporting Services
Development Applications
1 6 (8.22%) Git
General
1 28 (38.36%) Social Skills
2 15 (20.55%) Finance
3 13 (17.81%) Analytical Skills
4 9 (12.33%) Banking
5 7 (9.59%) Inclusion and Diversity
6 4 (5.48%) Law
7 2 (2.74%) Organisational Skills
8 1 (1.37%) Back Office
8 1 (1.37%) Telecoms
Job Titles
1 19 (26.03%) Senior
2 13 (17.81%) Infrastructure Engineer
3 12 (16.44%) Analyst
4 9 (12.33%) Azure Engineer
4 9 (12.33%) Support Analyst
5 8 (10.96%) IT Engineer
5 8 (10.96%) Senior Analyst
6 7 (9.59%) Administrator
7 6 (8.22%) Azure Platform Engineer
7 6 (8.22%) Cloud Platform Engineer
7 6 (8.22%) Platform Engineer
7 6 (8.22%) Senior Platform Engineer
8 5 (6.85%) 1st Line Support
8 5 (6.85%) IT Administrator
8 5 (6.85%) IT Infrastructure Engineer
8 5 (6.85%) Senior Support Analyst
9 4 (5.48%) Senior Technical Analyst
9 4 (5.48%) Server Engineer
9 4 (5.48%) Technical Analyst
9 4 (5.48%) Technical Support Analyst
Libraries, Frameworks & Software Standards
1 4 (5.48%) JSON
2 3 (4.11%) GraphQL
2 3 (4.11%) Middleware
2 3 (4.11%) REST
3 2 (2.74%) LEMP Stack
3 2 (2.74%) Node.js
4 1 (1.37%) EDI
4 1 (1.37%) LDAP
4 1 (1.37%) Web Services
Miscellaneous
1 10 (13.70%) Self-Motivation
2 9 (12.33%) Data Centre
3 5 (6.85%) Public Cloud
4 3 (4.11%) Hybrid Cloud
4 3 (4.11%) Onboarding
5 2 (2.74%) Analytical Mindset
5 2 (2.74%) Private Cloud
6 1 (1.37%) Client/Server
6 1 (1.37%) Cloud Native
6 1 (1.37%) Management Information System
6 1 (1.37%) Security Posture
6 1 (1.37%) Video Conferencing
Operating Systems
1 49 (67.12%) Windows
2 28 (38.36%) Windows Server
3 26 (35.62%) Linux
4 16 (21.92%) Windows 10
5 9 (12.33%) Red Hat Enterprise Linux
6 8 (10.96%) Windows Server 2012
7 6 (8.22%) Windows Server 2016
8 5 (6.85%) Windows Server 2008
8 5 (6.85%) Windows Server 2019
9 4 (5.48%) Apple iOS
9 4 (5.48%) Windows 7
10 2 (2.74%) CentOS
10 2 (2.74%) Mac OS
10 2 (2.74%) Rocky
11 1 (1.37%) Android
11 1 (1.37%) Mac OS X
Processes & Methodologies
1 30 (41.10%) Problem-Solving
2 17 (23.29%) DevOps
3 16 (21.92%) ITIL
4 15 (20.55%) Infrastructure Engineering
5 14 (19.18%) Customer Service
6 13 (17.81%) CI/CD
7 12 (16.44%) Continuous Improvement
7 12 (16.44%) Platform Engineering
8 10 (13.70%) Disaster Recovery
9 8 (10.96%) Infrastructure as Code
9 8 (10.96%) Regulatory Compliance
10 7 (9.59%) ITSM
10 7 (9.59%) Vulnerability Remediation
11 6 (8.22%) Asset Management
11 6 (8.22%) Infrastructure Automation
12 5 (6.85%) Agile
12 5 (6.85%) Break/Fix
12 5 (6.85%) Change Control
12 5 (6.85%) High Availability
12 5 (6.85%) Inventory Management
Programming Languages
1 12 (16.44%) PowerShell
1 12 (16.44%) Python
2 7 (9.59%) Bash
3 6 (8.22%) SQL
4 2 (2.74%) JavaScript
5 1 (1.37%) T-SQL
Qualifications
1 18 (24.66%) Degree
2 9 (12.33%) Microsoft Certification
3 8 (10.96%) Security Cleared
4 4 (5.48%) DV Cleared
4 4 (5.48%) MCSA
4 4 (5.48%) SC Cleared
5 3 (4.11%) Computer Science Degree
5 3 (4.11%) ITIL Foundation Certificate
6 2 (2.74%) MCSE
7 1 (1.37%) CCENT
7 1 (1.37%) CCNA
7 1 (1.37%) Cisco Certification
7 1 (1.37%) Network+ Certification
7 1 (1.37%) RHCSA
7 1 (1.37%) VCAP
7 1 (1.37%) VMware Certified Professional (VCP)
Quality Assurance & Compliance
1 5 (6.85%) SLA
2 4 (5.48%) GDPR
3 2 (2.74%) QA
4 1 (1.37%) ISO/IEC 27001
4 1 (1.37%) PCI DSS
System Software
1 51 (69.86%) VMware Infrastructure
2 43 (58.90%) Active Directory
3 10 (13.70%) Virtual Desktop
4 9 (12.33%) VMware ESXi
5 7 (9.59%) Hyper-V
6 4 (5.48%) VMware NSX
7 2 (2.74%) Firmware
7 2 (2.74%) Virtual Servers
7 2 (2.74%) vSphere
8 1 (1.37%) Microsoft Virtual Server
8 1 (1.37%) XenDesktop
Systems Management
1 24 (32.88%) Microsoft Intune
2 20 (27.40%) Terraform
3 15 (20.55%) Ansible
4 9 (12.33%) SCCM
5 4 (5.48%) FortiGate
5 4 (5.48%) Kubernetes
5 4 (5.48%) SCOM
5 4 (5.48%) vCenter Server
6 3 (4.11%) Nagios
6 3 (4.11%) Single Sign-On
7 2 (2.74%) Red Hat Satellite
7 2 (2.74%) WSUS
8 1 (1.37%) Avamar
8 1 (1.37%) EMC NetWorker
8 1 (1.37%) Failover Clustering
8 1 (1.37%) Jamf Pro
8 1 (1.37%) NetBackup
Vendors
1 41 (56.16%) Microsoft
2 19 (26.03%) Cisco
3 15 (20.55%) Citrix
4 14 (19.18%) HP
5 11 (15.07%) Red Hat
6 10 (13.70%) Apple
7 7 (9.59%) ServiceNow
8 6 (8.22%) NetApp
8 6 (8.22%) Veeam
9 5 (6.85%) Google
10 4 (5.48%) Blue Coat
10 4 (5.48%) CheckPoint
10 4 (5.48%) F5
10 4 (5.48%) SolarWinds
11 3 (4.11%) Bloomberg
11 3 (4.11%) Commvault
11 3 (4.11%) FactSet
11 3 (4.11%) Fortinet
11 3 (4.11%) Mitel
11 3 (4.11%) Refinitiv