Retail Jobs in England

Retailing
UK > England

The table below looks at the prevalence of the term Retail in permanent job vacancies advertised in England. Included is a benchmarking guide to the salaries offered in vacancies that have cited Retail over the 6 months to 2 December 2023 with a comparison to the same period over the previous 2 years.

6 months to
2 Dec 2023
Same period 2022 Same period 2021
Rank 50 38 46
Rank change year-on-year -12 +8 +68
Permanent jobs citing Retail 2,414 7,175 7,144
As % of all permanent jobs advertised in England 5.16% 6.54% 6.32%
As % of the General category 7.93% 9.53% 10.63%
Number of salaries quoted 1,823 3,709 3,350
10th Percentile £26,500 £35,233 £32,000
25th Percentile £37,500 £46,250 £42,000
Median annual salary (50th Percentile) £57,500 £60,000 £57,500
Median % change year-on-year -4.17% +4.35% -
75th Percentile £75,000 £80,000 £75,000
90th Percentile £92,500 £97,290 £91,250
UK median annual salary £52,108 £61,180 £57,500
% change year-on-year -14.83% +6.40% -

All General Skills
England

Retail is in the General Skills category. The following table is for comparison with the above and provides summary statistics for all permanent job vacancies advertised in England with a requirement for common skills.

Permanent vacancies with a requirement for common skills 30,426 75,265 67,178
As % of all permanent jobs advertised in England 65.03% 68.61% 59.45%
Number of salaries quoted 21,733 43,784 42,509
10th Percentile £31,250 £32,500 £31,250
25th Percentile £42,500 £45,000 £42,500
Median annual salary (50th Percentile) £60,000 £60,000 £60,000
Median % change year-on-year - - +4.35%
75th Percentile £82,500 £82,500 £80,000
90th Percentile £102,500 £102,000 £97,500
UK median annual salary £60,000 £60,000 £57,500
% change year-on-year - +4.35% +4.55%

Retail
Job Vacancy Trend in England

Job postings citing Retail as a proportion of all IT jobs advertised in England.
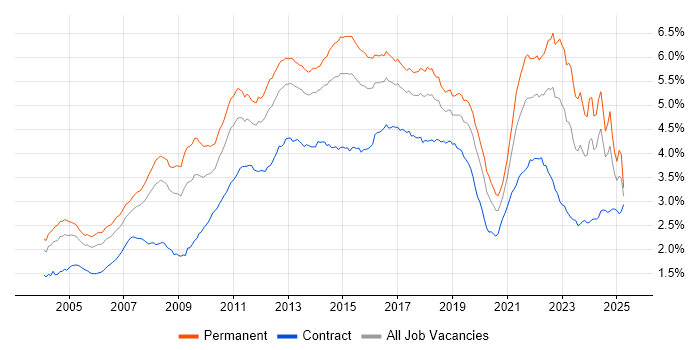
Job vacancy trend for Retail in England

Retail
Salary Trend in England

3-month moving average salary quoted in jobs citing Retail in England.

Salary trend for Retail in England

Retail
Salary Histogram in England

Salary distribution for jobs citing Retail in England over the 6 months to 2 December 2023.

Salary histogram for Retail in England

Retail
Job Locations in England

The table below looks at the demand and provides a guide to the median salaries quoted in IT jobs citing Retail within the England region over the 6 months to 2 December 2023. The 'Rank Change' column provides an indication of the change in demand within each location based on the same 6 month period last year.

Location Rank Change
on Same Period
Last Year
Matching
Permanent
IT Job Ads
Median Salary
Past 6 Months
Median Salary
% Change
on Same Period
Last Year
Live
Jobs
London -20 862 £70,000 +1.71% 771
North of England -6 543 £51,514 -6.34% 468
Midlands +33 358 £34,642 -35.85% 305
South West +4 297 £47,557 -4.89% 183
Yorkshire -12 279 £51,528 -6.31% 169
South East -25 234 £52,500 +0.96% 336
North West -12 226 £55,000 +4.76% 257
West Midlands +46 217 £32,500 -43.48% 161
East Midlands +12 138 £38,000 -26.21% 143
East of England +10 90 £45,000 -21.74% 138
North East +29 38 £32,313 -53.84% 51
Retail
UK

Retail
Co-occurring Skills and Capabilities in England by Category

The follow tables expand on the table above by listing co-occurrences grouped by category. The same employment type, locality and period is covered with up to 20 co-occurrences shown in each of the following categories:

Application Platforms
1 56 (2.32%) Confluence
2 41 (1.70%) Apache
2 41 (1.70%) SharePoint
3 40 (1.66%) Apache Spark
4 36 (1.49%) SAS
5 18 (0.75%) CMS
6 15 (0.62%) Tomcat
7 14 (0.58%) Jetty
8 10 (0.41%) MS Exchange
8 10 (0.41%) Oracle Application Server
9 6 (0.25%) WordPress
10 4 (0.17%) IIS
10 4 (0.17%) OpenStack
11 3 (0.12%) Umbraco
12 2 (0.083%) Adobe Experience Manager
12 2 (0.083%) Apache Airflow
12 2 (0.083%) Headless CMS
12 2 (0.083%) Jupyter
12 2 (0.083%) nginx
13 1 (0.041%) WildFly
Applications
1 152 (6.30%) Microsoft Excel
2 116 (4.81%) Microsoft Office
3 23 (0.95%) Microsoft PowerPoint
4 8 (0.33%) MS Visio
5 7 (0.29%) Photoshop
6 6 (0.25%) InDesign
7 5 (0.21%) Adobe Creative Suite
7 5 (0.21%) Adobe Illustrator
7 5 (0.21%) AutoCAD
7 5 (0.21%) Microsoft Project
8 4 (0.17%) Spreadsheet
9 3 (0.12%) SPSS
10 2 (0.083%) InfoPath
10 2 (0.083%) Trello
11 1 (0.041%) Adobe After Effects
11 1 (0.041%) Adobe Premiere
11 1 (0.041%) Chatbot
11 1 (0.041%) CINEMA 4D
11 1 (0.041%) EViews
11 1 (0.041%) Siemens NX
Business Applications
1 44 (1.82%) SAP S/4HANA
2 31 (1.28%) SAP ERP
3 17 (0.70%) Dynamics CRM
4 16 (0.66%) Payment Gateway
5 15 (0.62%) Dynamics AX
5 15 (0.62%) Endur
6 14 (0.58%) SAP FI
7 12 (0.50%) SAP CO
7 12 (0.50%) SAP FI/CO
7 12 (0.50%) SAP Retail
8 11 (0.46%) Dynamics NAV
9 10 (0.41%) Magento
9 10 (0.41%) SAP EWM
10 9 (0.37%) Shopify
11 6 (0.25%) Epicor Tropos
11 6 (0.25%) SAP SD
12 5 (0.21%) Dynamics GP
12 5 (0.21%) Sage 200
12 5 (0.21%) SAP IBP
12 5 (0.21%) SAP MDG
Cloud Services
1 390 (16.16%) Azure
2 254 (10.52%) AWS
3 228 (9.44%) Power Platform
4 163 (6.75%) GCP
5 129 (5.34%) Microsoft 365
6 86 (3.56%) Serverless
7 81 (3.36%) SaaS
8 71 (2.94%) Azure DevOps
9 70 (2.90%) GitHub
9 70 (2.90%) PaaS
10 54 (2.24%) Dynamics 365
11 46 (1.91%) IaaS
12 36 (1.49%) GitHub Actions
13 32 (1.33%) Entra ID
14 29 (1.20%) Azure Service Bus
15 25 (1.04%) Google Analytics
16 24 (0.99%) Vertex AI
17 21 (0.87%) Cloud Computing
17 21 (0.87%) Snowflake
18 20 (0.83%) PowerApps
Communications & Networking
1 121 (5.01%) Broadband
2 94 (3.89%) Firewall
3 67 (2.78%) WAN
4 61 (2.53%) Internet
5 50 (2.07%) VPN
6 48 (1.99%) LAN
7 32 (1.33%) DNS
8 28 (1.16%) SD-WAN
9 24 (0.99%) F5 BIG-IP GTM
9 24 (0.99%) F5 BIG-IP LTM
10 23 (0.95%) TCP/IP
11 21 (0.87%) 5G
11 21 (0.87%) Network Security
11 21 (0.87%) Wi-Fi
12 19 (0.79%) DHCP
13 13 (0.54%) SAN
14 10 (0.41%) VoIP
15 9 (0.37%) Wireless
16 8 (0.33%) NGFW
17 7 (0.29%) WLAN
Database & Business Intelligence
1 188 (7.79%) Power BI
2 112 (4.64%) SQL Server
3 103 (4.27%) Data Warehouse
4 101 (4.18%) NoSQL
5 81 (3.36%) MySQL
6 75 (3.11%) Tableau
7 73 (3.02%) Big Data
8 65 (2.69%) Data Lake
9 54 (2.24%) PostgreSQL
10 51 (2.11%) Relational Database
11 44 (1.82%) SQL Server Integration Services
12 37 (1.53%) SQL Server Reporting Services
13 31 (1.28%) Azure SQL Database
13 31 (1.28%) Looker
14 29 (1.20%) BigQuery
15 20 (0.83%) Bigtable
16 18 (0.75%) Hadoop
17 17 (0.70%) RDBMS
18 14 (0.58%) DynamoDB
19 13 (0.54%) Data Mart
Development Applications
1 121 (5.01%) Git
2 106 (4.39%) JIRA
3 64 (2.65%) Jenkins
4 22 (0.91%) Visual Studio
5 20 (0.83%) Spinnaker
6 15 (0.62%) Selenium
7 13 (0.54%) Oracle Forms
7 13 (0.54%) Postman
8 12 (0.50%) SonarQube
8 12 (0.50%) SpecFlow
9 11 (0.46%) Cypress.io
9 11 (0.46%) Maven
10 10 (0.41%) Bitbucket
10 10 (0.41%) JUnit
11 9 (0.37%) git-flow
11 9 (0.37%) GitLab
12 8 (0.33%) LabVIEW
13 7 (0.29%) Visual Studio Team System
14 6 (0.25%) Cucumber
14 6 (0.25%) JMeter
General
1 875 (36.25%) Social Skills
2 764 (31.65%) Finance
3 370 (15.33%) Banking
4 367 (15.20%) Analytical Skills
5 220 (9.11%) Inclusion and Diversity
6 184 (7.62%) Marketing
7 183 (7.58%) Telecoms
8 130 (5.39%) Local Government
9 104 (4.31%) Presentation Skills
10 95 (3.94%) Games
10 95 (3.94%) Manufacturing
11 91 (3.77%) Legal
12 82 (3.40%) Automotive
13 75 (3.11%) Public Sector
14 60 (2.49%) Influencing Skills
15 56 (2.32%) Organisational Skills
16 53 (2.20%) Aerospace
17 46 (1.91%) Retail Banking
18 32 (1.33%) Law
19 30 (1.24%) Advertising
Job Titles
1 397 (16.45%) Senior
2 383 (15.87%) Analyst
3 242 (10.02%) Developer
4 236 (9.78%) Architect
5 192 (7.95%) Lead
6 143 (5.92%) Consultant
7 115 (4.76%) Solutions Architect
8 113 (4.68%) Project Manager
9 108 (4.47%) Development Manager
10 106 (4.39%) IT Manager
11 105 (4.35%) Business Manager
12 100 (4.14%) Business Analyst
13 88 (3.65%) Business Development Manager
14 74 (3.07%) Software Engineer
15 71 (2.94%) Support Engineer
16 69 (2.86%) Senior Analyst
17 65 (2.69%) Data Analyst
17 65 (2.69%) Senior Developer
18 63 (2.61%) IT Engineer
19 60 (2.49%) DevOps Engineer
Libraries, Frameworks & Software Standards
1 148 (6.13%) .NET
2 112 (4.64%) HTML
3 102 (4.23%) React
4 96 (3.98%) CSS
5 68 (2.82%) Node.js
6 66 (2.73%) Kafka
7 62 (2.57%) Web Services
8 60 (2.49%) RESTful
9 50 (2.07%) REST
10 43 (1.78%) OpenID
10 43 (1.78%) Spring
11 41 (1.70%) Spring Boot
12 35 (1.45%) jQuery
12 35 (1.45%) JSON
12 35 (1.45%) XML
13 33 (1.37%) EDI
14 32 (1.33%) AngularJS
15 30 (1.24%) CSS3
16 28 (1.16%) .NET Core
16 28 (1.16%) HTML5
Miscellaneous
1 128 (5.30%) Product Ownership
2 106 (4.39%) Self-Motivation
3 94 (3.89%) Cloud Native
4 74 (3.07%) FMCG
5 57 (2.36%) Management Information System
6 56 (2.32%) EPoS
7 49 (2.03%) Public Cloud
8 42 (1.74%) Data Centre
9 41 (1.70%) Low-Code
10 36 (1.49%) Greenfield Project
11 35 (1.45%) Credit Risk
12 34 (1.41%) IoT
12 34 (1.41%) Mainframe
13 32 (1.33%) Blockchain
14 30 (1.24%) Analytical Mindset
14 30 (1.24%) Data Structures
15 26 (1.08%) Mobile App
16 25 (1.04%) Driving Licence
16 25 (1.04%) Onboarding
17 24 (0.99%) Hybrid Cloud
Operating Systems
1 209 (8.66%) Windows
2 109 (4.52%) Linux
3 69 (2.86%) Unix
4 61 (2.53%) Windows Server
5 56 (2.32%) Android
6 25 (1.04%) Apple iOS
6 25 (1.04%) Windows 10
7 18 (0.75%) Ubuntu
7 18 (0.75%) VMS
8 13 (0.54%) AIX
8 13 (0.54%) Mac OS
9 7 (0.29%) Windows 7
9 7 (0.29%) Windows Server 2008
10 4 (0.17%) Debian
10 4 (0.17%) Windows XP
11 2 (0.083%) CentOS
11 2 (0.083%) OpenBSD
11 2 (0.083%) Windows Server 2012
12 1 (0.041%) Windows 8
12 1 (0.041%) Windows Server 2016
Processes & Methodologies
1 821 (34.01%) Agile
2 405 (16.78%) Problem-Solving
3 383 (15.87%) Analytics
4 330 (13.67%) Decision-Making
5 269 (11.14%) DevOps
6 265 (10.98%) Customer Experience
6 265 (10.98%) Roadmaps
7 258 (10.69%) E-Commerce
8 239 (9.90%) CI/CD
9 233 (9.65%) Project Management
9 233 (9.65%) Stakeholder Management
10 229 (9.49%) Collaborative Working
11 224 (9.28%) Business Intelligence
12 221 (9.15%) Microservices
13 200 (8.29%) Customer Service
14 183 (7.58%) Mentoring
15 178 (7.37%) B2C
16 172 (7.13%) Project Delivery
17 167 (6.92%) B2B
18 156 (6.46%) Software Engineering
Programming Languages
1 339 (14.04%) SQL
2 217 (8.99%) Python
3 189 (7.83%) JavaScript
4 158 (6.55%) C#
5 152 (6.30%) Java
6 64 (2.65%) TypeScript
7 62 (2.57%) PowerShell
8 45 (1.86%) PHP
9 30 (1.24%) Bash
10 22 (0.91%) R
11 18 (0.75%) C++
12 17 (0.70%) PL/SQL
13 16 (0.66%) T-SQL
13 16 (0.66%) VBA
14 13 (0.54%) MATLAB
15 12 (0.50%) C
15 12 (0.50%) Go
15 12 (0.50%) Groovy
16 11 (0.46%) Scala
17 10 (0.41%) Bicep
Qualifications
1 306 (12.68%) Degree
2 114 (4.72%) Security Cleared
3 61 (2.53%) SC Cleared
4 41 (1.70%) DBS Check
5 38 (1.57%) Computer Science Degree
6 35 (1.45%) PMI Certification
7 31 (1.28%) Master's Degree
8 28 (1.16%) AWS Certification
9 20 (0.83%) ITIL Certification
10 18 (0.75%) PMP
11 17 (0.70%) Microsoft Certification
12 16 (0.66%) Cisco Certification
13 15 (0.62%) CISSP
14 14 (0.58%) Azure Certification
14 14 (0.58%) HND
15 13 (0.54%) ACCA
15 13 (0.54%) CISM
16 12 (0.50%) CISMP
17 11 (0.46%) CIMA
17 11 (0.46%) MBA
Quality Assurance & Compliance
1 66 (2.73%) QA
2 53 (2.20%) SLA
3 40 (1.66%) ISO/IEC 27001
4 30 (1.24%) PMO
5 28 (1.16%) Data Quality
6 27 (1.12%) PCI DSS
7 24 (0.99%) Accessibility
8 23 (0.95%) GDPR
9 21 (0.87%) GRC
10 17 (0.70%) Actionable Recommendations
10 17 (0.70%) NIST
11 16 (0.66%) IFRS
12 14 (0.58%) IFRS 9
13 11 (0.46%) Cyber Essentials
14 8 (0.33%) CRD IV
15 7 (0.29%) NCSC
16 6 (0.25%) GxP
17 5 (0.21%) Cyber Essentials PLUS
17 5 (0.21%) ISO 9001
17 5 (0.21%) Sarbanes-Oxley
System Software
1 141 (5.84%) Active Directory
2 112 (4.64%) Docker
3 40 (1.66%) VMware Infrastructure
4 16 (0.66%) Hyper-V
5 12 (0.50%) Virtual Machines
6 9 (0.37%) vSphere
7 8 (0.33%) BitLocker
7 8 (0.33%) XenApp
8 4 (0.17%) Firmware
8 4 (0.17%) XenDesktop
9 3 (0.12%) VMware NSX
10 2 (0.083%) Postfix
10 2 (0.083%) Virtual Desktop
11 1 (0.041%) KVM
11 1 (0.041%) QEMU
11 1 (0.041%) Virtual Servers
11 1 (0.041%) VMware ESXi
Systems Management
1 164 (6.79%) Terraform
2 146 (6.05%) Kubernetes
3 62 (2.57%) Ansible
4 40 (1.66%) SCCM
5 32 (1.33%) Microsoft Intune
6 21 (0.87%) Istio
7 14 (0.58%) SCOM
8 12 (0.50%) Single Sign-On
9 11 (0.46%) Failover Clustering
10 7 (0.29%) Active Directory Federation Services
11 6 (0.25%) CSIRT
12 4 (0.17%) Argo
12 4 (0.17%) FortiGate
12 4 (0.17%) Microsoft Clustering
13 2 (0.083%) AirWatch
13 2 (0.083%) cPanel
13 2 (0.083%) Grafana
13 2 (0.083%) Puppet
13 2 (0.083%) SysTrack
13 2 (0.083%) WSUS
Vendors
1 419 (17.36%) Microsoft
2 140 (5.80%) SAP
3 118 (4.89%) BT
4 110 (4.56%) Google
5 88 (3.65%) Oracle
6 62 (2.57%) Cisco
7 57 (2.36%) VMware
8 55 (2.28%) ServiceNow
9 53 (2.20%) Salesforce
10 31 (1.28%) Adobe
11 30 (1.24%) IBM
12 25 (1.04%) Fortinet
13 24 (0.99%) CheckPoint
13 24 (0.99%) F5
14 22 (0.91%) Databricks
15 21 (0.87%) Citrix
16 20 (0.83%) Teradata
17 19 (0.79%) HP
18 18 (0.75%) Dell
18 18 (0.75%) MuleSoft