Retail Jobs in the North West

Retailing
England > North West

The table below looks at the prevalence of the term Retail in permanent job vacancies advertised in the North West. Included is a benchmarking guide to the salaries offered in vacancies that have cited Retail over the 6 months to 18 May 2024 with a comparison to the same period over the previous 2 years.

6 months to
18 May 2024
Same period 2023 Same period 2022
Rank 34 48 44
Rank change year-on-year +14 -4 +10
Permanent jobs citing Retail 537 495 654
As % of all permanent jobs advertised in the North West 5.38% 6.43% 6.95%
As % of the General category 10.08% 9.48% 11.22%
Number of salaries quoted 360 277 364
10th Percentile £23,078 £30,805 £31,346
25th Percentile £27,500 £43,500 £40,000
Median annual salary (50th Percentile) £45,000 £55,000 £50,000
Median % change year-on-year -18.18% +10.00% -
75th Percentile £60,063 £66,000 £65,000
90th Percentile £72,500 £77,542 £80,000
England median annual salary £47,500 £60,000 £57,500
% change year-on-year -20.83% +4.35% -

All General Skills
North West

Retail is in the General Skills category. The following table is for comparison with the above and provides summary statistics for all permanent job vacancies advertised in the North West with a requirement for common skills.

Permanent vacancies with a requirement for common skills 5,329 5,220 5,830
As % of all permanent jobs advertised in the North West 53.41% 67.77% 61.96%
Number of salaries quoted 3,941 2,406 3,071
10th Percentile £26,250 £28,250 £28,250
25th Percentile £33,750 £37,500 £38,750
Median annual salary (50th Percentile) £47,500 £52,500 £51,500
Median % change year-on-year -9.52% +1.94% +8.42%
75th Percentile £62,500 £67,500 £66,625
90th Percentile £76,250 £81,250 £80,000
England median annual salary £52,500 £60,000 £60,000
% change year-on-year -12.50% - +4.35%

Retail
Job Vacancy Trend in the North West

Job postings citing Retail as a proportion of all IT jobs advertised in the North West.
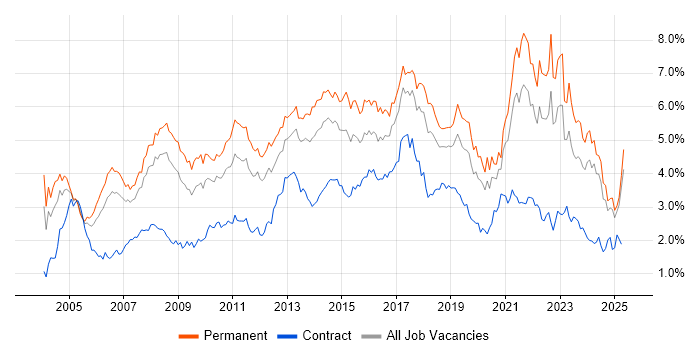
Job vacancy trend for Retail in the North West

Retail
Salary Trend in the North West

3-month moving average salary quoted in jobs citing Retail in the North West.

Salary trend for Retail in the North West

Retail
Salary Histogram in the North West

Salary distribution for jobs citing Retail in the North West over the 6 months to 18 May 2024.

Salary histogram for Retail in the North West

Retail
Job Locations in the North West

The table below looks at the demand and provides a guide to the median salaries quoted in IT jobs citing Retail within the North West region over the 6 months to 18 May 2024. The 'Rank Change' column provides an indication of the change in demand within each location based on the same 6 month period last year.

Location Rank Change
on Same Period
Last Year
Matching
Permanent
IT Job Ads
Median Salary
Past 6 Months
Median Salary
% Change
on Same Period
Last Year
Live
Jobs
Manchester +9 278 £47,500 -13.64% 146
Cheshire +22 157 £37,500 -28.57% 60
Merseyside +38 47 £40,000 -27.27% 35
Lancashire -21 45 £37,500 -21.05% 28
Cumbria -7 9 £70,000 +27.27% 9
Retail
England

Retail
Co-occurring Skills and Capabilities in the North West by Category

The follow tables expand on the table above by listing co-occurrences grouped by category. The same employment type, locality and period is covered with up to 20 co-occurrences shown in each of the following categories:

Application Platforms
1 11 (2.05%) SharePoint
2 8 (1.49%) Blackberry Enterprise Server
3 5 (0.93%) Microsoft Exchange
3 5 (0.93%) WordPress
4 4 (0.74%) Apache Spark
4 4 (0.74%) CMS
4 4 (0.74%) Confluence
4 4 (0.74%) SAS
5 3 (0.56%) Apache Airflow
6 2 (0.37%) NetWeaver
7 1 (0.19%) Apache
7 1 (0.19%) nginx
Applications
1 92 (17.13%) Microsoft Excel
2 64 (11.92%) Microsoft PowerPoint
3 34 (6.33%) Microsoft Office
4 7 (1.30%) Trello
5 6 (1.12%) Photoshop
6 4 (0.74%) Adobe Creative Suite
6 4 (0.74%) Adobe Illustrator
7 3 (0.56%) InDesign
7 3 (0.56%) Microsoft Project
8 2 (0.37%) Adobe XD
8 2 (0.37%) AutoCAD
9 1 (0.19%) MS Visio
9 1 (0.19%) Spreadsheet
Business Applications
1 12 (2.23%) Epicor Tropos
2 9 (1.68%) Dynamics NAV
2 9 (1.68%) Magento
2 9 (1.68%) SAP BPC
2 9 (1.68%) SAP S/4HANA
3 6 (1.12%) Dynamics CRM
4 4 (0.74%) SAP APO
4 4 (0.74%) SAP FI
4 4 (0.74%) SAP MM
4 4 (0.74%) SAP PP
4 4 (0.74%) SAP SD
4 4 (0.74%) SAP WM
5 2 (0.37%) NetSuite
5 2 (0.37%) SAP ERP
5 2 (0.37%) Shopify
6 1 (0.19%) Dynamics AX
6 1 (0.19%) SAP SCM
Cloud Services
1 79 (14.71%) Azure
2 60 (11.17%) Microsoft 365
3 49 (9.12%) AWS
4 39 (7.26%) Power Platform
5 28 (5.21%) Azure DevOps
6 19 (3.54%) GCP
7 12 (2.23%) GitHub
8 9 (1.68%) GitHub Actions
9 8 (1.49%) SaaS
9 8 (1.49%) Serverless
10 7 (1.30%) Azure API Management
10 7 (1.30%) Azure Service Bus
10 7 (1.30%) Dynamics 365
11 6 (1.12%) Google Kubernetes Engine
12 5 (0.93%) Amazon ECS
12 5 (0.93%) Amazon S3
12 5 (0.93%) Anthos
12 5 (0.93%) BrowserStack
12 5 (0.93%) Figma
13 4 (0.74%) Canva
Communications & Networking
1 28 (5.21%) Broadband
2 22 (4.10%) Internet
3 15 (2.79%) Wi-Fi
4 11 (2.05%) Firewall
5 10 (1.86%) DNS
6 8 (1.49%) VoIP
7 7 (1.30%) DHCP
7 7 (1.30%) Network Security
8 5 (0.93%) LAN
8 5 (0.93%) WAN
9 4 (0.74%) Cisco Firepower
9 4 (0.74%) Cisco IOS
9 4 (0.74%) Cisco ISE
9 4 (0.74%) TCP/IP
10 3 (0.56%) Intrusion Detection
11 2 (0.37%) Wireless
12 1 (0.19%) Intranet
12 1 (0.19%) LTE
12 1 (0.19%) VLAN
Database & Business Intelligence
1 42 (7.82%) SQL Server
2 35 (6.52%) Power BI
3 29 (5.40%) Data Warehouse
4 24 (4.47%) MySQL
5 14 (2.61%) DynamoDB
6 13 (2.42%) SQL Server Integration Services
7 12 (2.23%) PostgreSQL
7 12 (2.23%) SQL Server Reporting Services
8 9 (1.68%) SAP BW
9 6 (1.12%) BigQuery
10 3 (0.56%) Big Data
10 3 (0.56%) Crystal Reports
10 3 (0.56%) Redis
11 1 (0.19%) ArangoDB
11 1 (0.19%) MongoDB
11 1 (0.19%) OLTP
11 1 (0.19%) PowerPivot
11 1 (0.19%) Relational Database
11 1 (0.19%) Snowflake Schema
11 1 (0.19%) Tableau
Development Applications
1 30 (5.59%) Git
2 17 (3.17%) GitLab
3 8 (1.49%) Jenkins
3 8 (1.49%) JIRA
4 5 (0.93%) JMeter
4 5 (0.93%) SonarQube
5 3 (0.56%) Octopus Deploy
6 1 (0.19%) PHPUnit
6 1 (0.19%) QADirector
6 1 (0.19%) Spinnaker
General
1 204 (37.99%) Social Skills
2 161 (29.98%) Finance
3 94 (17.50%) Analytical Skills
4 65 (12.10%) Marketing
5 41 (7.64%) Billing
6 37 (6.89%) Inclusion and Diversity
7 34 (6.33%) Telecoms
8 28 (5.21%) Legal
9 25 (4.66%) Games
10 22 (4.10%) Presentation Skills
11 19 (3.54%) Organisational Skills
12 15 (2.79%) Public Sector
13 14 (2.61%) Banking
14 13 (2.42%) Manufacturing
15 10 (1.86%) Retail Finance
16 9 (1.68%) Local Government
17 7 (1.30%) Advertising
18 6 (1.12%) Electronics
19 5 (0.93%) Back Office
19 5 (0.93%) Influencing Skills
Job Titles
1 90 (16.76%) Analyst
2 72 (13.41%) Senior
3 51 (9.50%) Developer
4 33 (6.15%) Lead
5 30 (5.59%) Service Analyst
5 30 (5.59%) Service Desk Analyst
6 26 (4.84%) Project Manager
7 23 (4.28%) Architect
7 23 (4.28%) IT Support
7 23 (4.28%) Quantity Surveyor
8 18 (3.35%) IT Analyst
8 18 (3.35%) SAP Architect
9 16 (2.98%) Support Analyst
10 15 (2.79%) Software Engineer
11 14 (2.61%) Head of IT
11 14 (2.61%) IT Engineer
12 13 (2.42%) Development Manager
12 13 (2.42%) Senior Developer
12 13 (2.42%) Senior Software Engineer
13 11 (2.05%) Deployment Manager
Libraries, Frameworks & Software Standards
1 29 (5.40%) .NET
1 29 (5.40%) React
2 25 (4.66%) CSS
2 25 (4.66%) HTML
3 24 (4.47%) Node.js
4 18 (3.35%) JSON
5 16 (2.98%) OLE
6 14 (2.61%) RESTful
7 13 (2.42%) XML
8 10 (1.86%) Vue
9 8 (1.49%) .NET Core
9 8 (1.49%) AngularJS
10 7 (1.30%) Laravel
10 7 (1.30%) SOAP
11 6 (1.12%) Kafka
12 5 (0.93%) .NET Framework
12 5 (0.93%) Jest
12 5 (0.93%) Lambda Expressions
12 5 (0.93%) Serverless Framework
12 5 (0.93%) Symfony
Miscellaneous
1 51 (9.50%) Self-Motivation
2 27 (5.03%) Driving Licence
2 27 (5.03%) Smartphone
3 23 (4.28%) Management Information System
4 21 (3.91%) EPoS
5 14 (2.61%) Product Ownership
5 14 (2.61%) Social Media
6 12 (2.23%) Greenfield Project
7 11 (2.05%) FMCG
8 9 (1.68%) Educational Technology
8 9 (1.68%) e-Learning
9 8 (1.49%) Onboarding
10 6 (1.12%) Algorithms
10 6 (1.12%) Video Conferencing
11 5 (0.93%) Mobile App
11 5 (0.93%) NHS
12 4 (0.74%) Animation
12 4 (0.74%) Legacy Systems
12 4 (0.74%) Media Streaming
12 4 (0.74%) Social Network
Operating Systems
1 46 (8.57%) Windows
2 16 (2.98%) Windows Server
3 14 (2.61%) Linux
4 6 (1.12%) Windows 10
5 4 (0.74%) Windows Server 2019
6 3 (0.56%) Apple iOS
6 3 (0.56%) Kali Linux
6 3 (0.56%) Ubuntu
6 3 (0.56%) Windows Server 2016
7 2 (0.37%) VMS
8 1 (0.19%) Mac OS
8 1 (0.19%) Windows Server 2012
Processes & Methodologies
1 141 (26.26%) Agile
2 112 (20.86%) Customer Service
3 103 (19.18%) Problem-Solving
4 62 (11.55%) Roadmaps
5 58 (10.80%) ERP
6 57 (10.61%) DevOps
6 57 (10.61%) E-Commerce
7 55 (10.24%) Mentoring
8 52 (9.68%) Analytics
9 47 (8.75%) Project Management
10 46 (8.57%) Coaching
11 45 (8.38%) Continuous Improvement
12 44 (8.19%) Time Management
13 43 (8.01%) Business Development
13 43 (8.01%) Collaborative Culture
14 42 (7.82%) Collaborative Working
15 39 (7.26%) Logistics
16 36 (6.70%) Business Intelligence
17 32 (5.96%) Software Engineering
18 31 (5.77%) CRM
Programming Languages
1 61 (11.36%) SQL
2 42 (7.82%) C#
3 29 (5.40%) PHP
4 24 (4.47%) Python
5 23 (4.28%) JavaScript
5 23 (4.28%) TypeScript
6 20 (3.72%) R
7 11 (2.05%) Java
7 11 (2.05%) PowerShell
7 11 (2.05%) VB.NET
8 9 (1.68%) Go
9 6 (1.12%) Data Analysis Expressions
10 5 (0.93%) Bash
11 4 (0.74%) T-SQL
12 3 (0.56%) C
12 3 (0.56%) Ruby
13 2 (0.37%) ABAP
14 1 (0.19%) C++
Qualifications
1 45 (8.38%) Degree
2 40 (7.45%) DBS Check
3 31 (5.77%) CIMA
4 29 (5.40%) ACCA
5 12 (2.23%) Master's Degree
6 11 (2.05%) A+ Certification
6 11 (2.05%) Microsoft Certification
7 9 (1.68%) BPSS Clearance
8 8 (1.49%) AAT
9 6 (1.12%) CISA
9 6 (1.12%) Cisco Certification
9 6 (1.12%) Security Cleared
10 4 (0.74%) CCNP
10 4 (0.74%) NVQ Level 3
10 4 (0.74%) PMI Certification
10 4 (0.74%) SAP Certification
11 3 (0.56%) HNC
12 2 (0.37%) CEH
12 2 (0.37%) Chartered Engineer
12 2 (0.37%) CISSP
Quality Assurance & Compliance
1 24 (4.47%) SLA
2 18 (3.35%) QA
3 9 (1.68%) GDPR
4 7 (1.30%) PMO
5 6 (1.12%) PCI DSS
6 4 (0.74%) ISO/IEC 27001
7 3 (0.56%) NIST
8 2 (0.37%) Accessibility
8 2 (0.37%) Data Quality
System Software
1 58 (10.80%) Active Directory
2 27 (5.03%) Docker
3 12 (2.23%) VMware Infrastructure
4 10 (1.86%) Hyper-V
5 7 (1.30%) Firmware
6 4 (0.74%) VMware Server
7 3 (0.56%) Terminal Services
7 3 (0.56%) Virtual Machines
8 2 (0.37%) KVM
8 2 (0.37%) VMware ESXi
9 1 (0.19%) IAG
Systems Management
1 32 (5.96%) Kubernetes
2 31 (5.77%) Terraform
3 7 (1.30%) Grafana
4 6 (1.12%) Microsoft Intune
5 5 (0.93%) Ansible
5 5 (0.93%) Kibana
6 4 (0.74%) Progress Chef
7 3 (0.56%) Jamf Pro
7 3 (0.56%) Puppet
7 3 (0.56%) SELinux
8 2 (0.37%) Prometheus
8 2 (0.37%) Rundeck
9 1 (0.19%) Systems Management Server (SMS)
Vendors
1 124 (23.09%) Microsoft
2 45 (8.38%) Virgin Media
3 27 (5.03%) SAP
4 23 (4.28%) NEC
5 16 (2.98%) VMware
6 15 (2.79%) Google
7 12 (2.23%) Adobe
7 12 (2.23%) Epicor
8 11 (2.05%) NetApp
9 10 (1.86%) Dell
10 9 (1.68%) Oracle
11 8 (1.49%) IBM
12 7 (1.30%) Cisco
12 7 (1.30%) HP
13 6 (1.12%) CA
13 6 (1.12%) Salesforce
13 6 (1.12%) TikTok
13 6 (1.12%) Veeam
14 5 (0.93%) LogicMonitor
14 5 (0.93%) PagerDuty