Time Management Jobs in the South West

Time Management
England > South West

The following table provides summary statistics for permanent job vacancies advertised in the South West with a requirement for Time Management skills. Included is a benchmarking guide to the salaries offered in vacancies that have cited Time Management over the 6 months to 23 April 2024 with a comparison to the same period in the previous 2 years.

6 months to
23 Apr 2024
Same period 2023 Same period 2022
Rank 91 102 97
Rank change year-on-year +11 -5 +50
Permanent jobs citing Time Management 269 216 265
As % of all permanent jobs advertised in the South West 2.96% 3.04% 3.35%
As % of the Processes & Methodologies category 3.51% 3.21% 3.52%
Number of salaries quoted 168 87 113
10th Percentile £23,500 £25,420 £23,950
25th Percentile £29,290 £28,750 £30,000
Median annual salary (50th Percentile) £42,500 £40,000 £45,000
Median % change year-on-year +6.25% -11.11% +12.50%
75th Percentile £56,250 £60,000 £57,000
90th Percentile £67,500 £70,000 £69,900
England median annual salary £40,000 £50,000 £47,500
% change year-on-year -20.00% +5.26% +5.56%

All Process and Methodology Skills
South West

Time Management is in the Processes and Methodologies category. The following table is for comparison with the above and provides summary statistics for all permanent job vacancies advertised in the South West with a requirement for process or methodology skills.

Permanent vacancies with a requirement for process or methodology skills 7,659 6,728 7,529
As % of all permanent jobs advertised in the South West 84.30% 94.55% 95.05%
Number of salaries quoted 5,543 3,727 4,980
10th Percentile £28,567 £30,500 £30,993
25th Percentile £37,500 £38,750 £38,343
Median annual salary (50th Percentile) £50,500 £52,500 £50,000
Median % change year-on-year -3.81% +5.00% +7.53%
75th Percentile £65,000 £68,750 £65,231
90th Percentile £80,000 £81,250 £77,500
England median annual salary £55,000 £62,500 £60,000
% change year-on-year -12.00% +4.17% +9.09%

Time Management
Job Vacancy Trend in the South West

Job postings citing Time Management as a proportion of all IT jobs advertised in the South West.
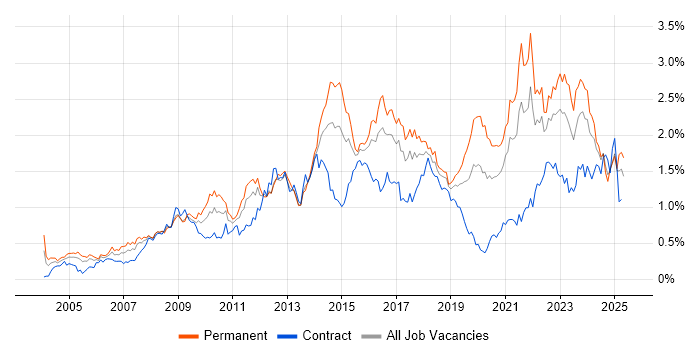
Job vacancy trend for Time Management in the South West

Time Management
Salary Trend in the South West

3-month moving average salary quoted in jobs citing Time Management in the South West.

Salary trend for Time Management in the South West

Time Management
Salary Histogram in the South West

Salary distribution for jobs citing Time Management in the South West over the 6 months to 23 April 2024.

Salary histogram for Time Management in the South West

Time Management
Job Locations in the South West

The table below looks at the demand and provides a guide to the median salaries quoted in IT jobs citing Time Management within the South West region over the 6 months to 23 April 2024. The 'Rank Change' column provides an indication of the change in demand within each location based on the same 6 month period last year.

Location Rank Change
on Same Period
Last Year
Matching
Permanent
IT Job Ads
Median Salary
Past 6 Months
Median Salary
% Change
on Same Period
Last Year
Live
Jobs
Dorset +41 72 £24,500 -42.35% 6
Gloucestershire -24 67 £50,000 +11.11% 15
Bristol +7 51 £41,250 -31.25% 15
Wiltshire +9 47 £34,000 -35.24% 17
Somerset +3 18 £29,290 -0.71% 16
Devon -6 11 £42,500 +76.01% 6
Time Management
England

Time Management
Co-occurring Skills and Capabilities in the South West by Category

The follow tables expand on the table above by listing co-occurrences grouped by category. The same employment type, locality and period is covered with up to 20 co-occurrences shown in each of the following categories:

Application Platforms
1 13 (4.83%) Confluence
2 7 (2.60%) SharePoint
3 5 (1.86%) CMS
4 4 (1.49%) Oracle Workflow
4 4 (1.49%) Site Server
5 3 (1.12%) Kentico
5 3 (1.12%) WordPress
6 2 (0.74%) Apache
6 2 (0.74%) JBoss
6 2 (0.74%) nginx
Applications
1 35 (13.01%) Microsoft Excel
2 26 (9.67%) Microsoft Office
3 18 (6.69%) Microsoft PowerPoint
4 5 (1.86%) MS Visio
5 4 (1.49%) Simulink
6 2 (0.74%) AutoCAD
6 2 (0.74%) Microsoft Project
7 1 (0.37%) Revit
Business Applications
1 12 (4.46%) SAP QM
2 4 (1.49%) NEC Housing
3 2 (0.74%) Magento
3 2 (0.74%) Primavera
3 2 (0.74%) Shopify
4 1 (0.37%) Maximo
Cloud Services
1 30 (11.15%) AWS
1 30 (11.15%) Microsoft 365
2 26 (9.67%) Azure
3 21 (7.81%) OpenShift
4 13 (4.83%) npm
5 8 (2.97%) Power Platform
6 5 (1.86%) Dynamics 365
7 4 (1.49%) Cloud Computing
7 4 (1.49%) Entra ID
8 3 (1.12%) Basecamp
8 3 (1.12%) Kontent
9 2 (0.74%) Datadog
9 2 (0.74%) Google Analytics
9 2 (0.74%) Mimecast
10 1 (0.37%) WhatsApp
Communications & Networking
1 22 (8.18%) LAN
1 22 (8.18%) WAN
2 16 (5.95%) DNS
3 10 (3.72%) DHCP
4 8 (2.97%) TCP/IP
4 8 (2.97%) VSAN
5 6 (2.23%) SAN
6 5 (1.86%) Cisco ASA
6 5 (1.86%) Cisco ISE
6 5 (1.86%) Cisco Wireless
6 5 (1.86%) Firewall
6 5 (1.86%) Internet
6 5 (1.86%) Software-Defined Networking
6 5 (1.86%) Unified Communications
6 5 (1.86%) Wireless
7 3 (1.12%) Wi-Fi
8 2 (0.74%) IP Telephony
8 2 (0.74%) SSL
9 1 (0.37%) Broadband
Database & Business Intelligence
1 20 (7.43%) SQL Server
2 10 (3.72%) Relational Database
3 8 (2.97%) Power BI
4 7 (2.60%) Tableau
5 6 (2.23%) Qlik Sense
6 4 (1.49%) Data Mining
Development Applications
1 24 (8.92%) Git
2 13 (4.83%) Storybook
3 11 (4.09%) Cucumber
3 11 (4.09%) Selenium
4 9 (3.35%) TeamCity
5 6 (2.23%) JIRA
6 4 (1.49%) LabVIEW
6 4 (1.49%) SQL Server Management Studio (SSMS)
6 4 (1.49%) Toad
7 3 (1.12%) Bitbucket
7 3 (1.12%) Jasmine
7 3 (1.12%) Mocha
8 2 (0.74%) Android Studio
8 2 (0.74%) Jenkins
9 1 (0.37%) Appium
9 1 (0.37%) Cypress.io
9 1 (0.37%) Robot Framework
General
1 133 (49.44%) Social Skills
2 89 (33.09%) Finance
3 65 (24.16%) Inclusion and Diversity
4 61 (22.68%) Organisational Skills
5 60 (22.30%) Analytical Skills
6 44 (16.36%) Law
7 33 (12.27%) Banking
7 33 (12.27%) Investment Banking
8 21 (7.81%) Retail
9 19 (7.06%) Presentation Skills
10 14 (5.20%) Financial Institution
10 14 (5.20%) Manufacturing
10 14 (5.20%) Telecoms
11 13 (4.83%) Corporate Banking
11 13 (4.83%) French Language
12 11 (4.09%) Front Office
13 10 (3.72%) Influencing Skills
13 10 (3.72%) Legal
14 8 (2.97%) Aerospace
14 8 (2.97%) Automotive
Job Titles
1 43 (15.99%) Analyst
2 41 (15.24%) Senior
3 37 (13.75%) Support Engineer
4 26 (9.67%) Service Analyst
5 24 (8.92%) Administrator
6 21 (7.81%) Project Manager
7 20 (7.43%) Developer
8 18 (6.69%) IT Engineer
9 15 (5.58%) Desktop Support
9 15 (5.58%) IT Support
9 15 (5.58%) IT Support Engineer
10 13 (4.83%) Software Engineer
11 12 (4.46%) Technologist
12 11 (4.09%) Linux Engineer
13 10 (3.72%) Linux Administrator
13 10 (3.72%) Unix Administrator
13 10 (3.72%) Unix Systems Administrator
14 9 (3.35%) Consultant
14 9 (3.35%) Desktop Support Engineer
14 9 (3.35%) Senior Software Engineer
Libraries, Frameworks & Software Standards
1 14 (5.20%) AngularJS
2 13 (4.83%) Node.js
2 13 (4.83%) Sass
3 11 (4.09%) .NET
4 10 (3.72%) Gherkin
5 6 (2.23%) CSS
5 6 (2.23%) HTML
5 6 (2.23%) Middleware
5 6 (2.23%) ODBC
6 5 (1.86%) LDAP
6 5 (1.86%) REST
7 3 (1.12%) .NET Core
7 3 (1.12%) Chai
7 3 (1.12%) Jest
7 3 (1.12%) Vue
8 2 (0.74%) Android Jetpack
8 2 (0.74%) CSS3
8 2 (0.74%) Keycloak
8 2 (0.74%) OAuth2
8 2 (0.74%) React
Miscellaneous
1 19 (7.06%) Linux Command Line
2 15 (5.58%) Mobile App
3 12 (4.46%) Biopharmaceutical
3 12 (4.46%) Driving Licence
4 10 (3.72%) Self-Motivation
5 8 (2.97%) iPhone
6 7 (2.60%) Credit Derivative
6 7 (2.60%) Credit Risk
6 7 (2.60%) Derivative
6 7 (2.60%) Foreign Exchange (FX)
6 7 (2.60%) Product Ownership
6 7 (2.60%) Smartphone
7 6 (2.23%) AS400
7 6 (2.23%) CCTV
7 6 (2.23%) Client/Server
8 4 (1.49%) Analytical Mindset
8 4 (1.49%) Fixed Income
8 4 (1.49%) FMCG
8 4 (1.49%) Management Information System
9 2 (0.74%) Renewable Energy
Operating Systems
1 52 (19.33%) Windows
2 43 (15.99%) Linux
3 29 (10.78%) Windows 10
4 23 (8.55%) Red Hat Enterprise Linux
5 21 (7.81%) CentOS
6 19 (7.06%) CoreOS
7 14 (5.20%) Unix
8 12 (4.46%) Mac OS
9 10 (3.72%) Android
9 10 (3.72%) Windows Server
10 8 (2.97%) Windows Server 2016
10 8 (2.97%) Windows Server 2019
11 7 (2.60%) Windows 7
12 4 (1.49%) Apple iOS
Processes & Methodologies
1 77 (28.62%) Problem-Solving
2 58 (21.56%) Project Delivery
3 44 (16.36%) Customer Service
4 40 (14.87%) ITIL
5 37 (13.75%) Project Management
6 35 (13.01%) Agile
7 28 (10.41%) Test Automation
8 25 (9.29%) Continuous Improvement
9 23 (8.55%) End-to-End Testing
9 23 (8.55%) Process Improvement
10 22 (8.18%) Software Engineering
11 20 (7.43%) Containerisation
12 19 (7.06%) Business Analysis
12 19 (7.06%) Computer Science
12 19 (7.06%) Root Cause Analysis
13 18 (6.69%) Roadmaps
14 17 (6.32%) Change Management
15 16 (5.95%) Incident Management
15 16 (5.95%) Scrum
15 16 (5.95%) Unit Testing
Programming Languages
1 43 (15.99%) Python
2 31 (11.52%) SQL
3 27 (10.04%) Bash
4 23 (8.55%) Java
4 23 (8.55%) JavaScript
5 16 (5.95%) TypeScript
6 12 (4.46%) PowerShell
7 7 (2.60%) C#
8 6 (2.23%) T-SQL
9 4 (1.49%) MATLAB
10 2 (0.74%) Kotlin
11 1 (0.37%) Apex Code
11 1 (0.37%) Ruby
Qualifications
1 80 (29.74%) Degree
2 32 (11.90%) Security Cleared
3 24 (8.92%) SC Cleared
4 17 (6.32%) DBS Check
5 15 (5.58%) DV Cleared
6 9 (3.35%) ISTQB
7 8 (2.97%) ITIL Certification
7 8 (2.97%) PRINCE2 Certification
8 6 (2.23%) Computer Science Degree
8 6 (2.23%) PMI Certification
8 6 (2.23%) PMP
9 5 (1.86%) CCNP
9 5 (1.86%) Cisco Certification
9 5 (1.86%) RHCE
9 5 (1.86%) RHCSA
10 4 (1.49%) Numerate Degree
11 3 (1.12%) CCNA
12 1 (0.37%) CISSP
12 1 (0.37%) HNC
12 1 (0.37%) HND
Quality Assurance & Compliance
1 25 (9.29%) QA
2 24 (8.92%) GDPR
3 5 (1.86%) SEPA
3 5 (1.86%) TARGET2
4 4 (1.49%) Data Quality
5 3 (1.12%) SLA
6 2 (0.74%) PMO
7 1 (0.37%) ISO/IEC 27001
System Software
1 42 (15.61%) Active Directory
2 21 (7.81%) VMware Infrastructure
3 14 (5.20%) Hyper-V
4 11 (4.09%) Docker
5 8 (2.97%) vSphere
6 2 (0.74%) Virtual Desktop
Systems Management
1 27 (10.04%) Ansible
2 22 (8.18%) Puppet
3 15 (5.58%) SCCM
4 10 (3.72%) McAfee ePO
5 8 (2.97%) SCVMM
6 5 (1.86%) Cisco Prime
6 5 (1.86%) Graphite
6 5 (1.86%) Opsview
6 5 (1.86%) Rancher
6 5 (1.86%) vCenter Server
7 3 (1.12%) Kubernetes
8 2 (0.74%) Active Directory Federation Services
8 2 (0.74%) Nagios
8 2 (0.74%) Progress Chef
8 2 (0.74%) Single Sign-On
8 2 (0.74%) Terraform
Vendors
1 78 (29.00%) Microsoft
2 21 (7.81%) Red Hat
2 21 (7.81%) VMware
3 15 (5.58%) McAfee
4 13 (4.83%) SAP
5 8 (2.97%) Dell
5 8 (2.97%) ServiceNow
6 7 (2.60%) MobileIron
7 5 (1.86%) Cisco
7 5 (1.86%) Google
8 4 (1.49%) Apple
8 4 (1.49%) Civica
8 4 (1.49%) NEC
8 4 (1.49%) Oracle
8 4 (1.49%) Rockwell
9 2 (0.74%) Atlassian
9 2 (0.74%) New Relic
9 2 (0.74%) Sophos
9 2 (0.74%) Splunk
10 1 (0.37%) Salesforce