Simulink Jobs in the UK excluding London

The MathWorks Simulink
UK > UK excluding London

The table below provides summary statistics for permanent job vacancies advertised in the UK excluding London requiring Simulink skills. It includes a benchmarking guide to the annual salaries offered in vacancies that cited Simulink over the 6 months leading up to 26 July 2024, comparing them to the same period in the previous two years.

6 months to
26 Jul 2024
Same period 2023 Same period 2022
Rank 476 529 493
Rank change year-on-year +53 -36 +65
Permanent jobs citing Simulink 240 152 438
As % of all permanent jobs advertised in the UK excluding London 0.37% 0.32% 0.56%
As % of the Applications category 3.59% 3.57% 5.38%
Number of salaries quoted 186 31 149
10th Percentile £40,000 £35,000 -
25th Percentile £47,500 £44,875 £35,125
Median annual salary (50th Percentile) £60,000 £55,000 £45,000
Median % change year-on-year +9.09% +22.22% -7.69%
75th Percentile £72,500 £65,000 £51,000
90th Percentile £85,000 £70,000 £51,500
UK median annual salary £60,000 £55,000 £45,000
% change year-on-year +9.09% +22.22% -10.00%

All Software Application Skills
UK excluding London

Simulink falls under the Software Applications category. For comparison with the information above, the following table provides summary statistics for all permanent job vacancies requiring software application skills in the UK excluding London.

Permanent vacancies with a requirement for software application skills 6,680 4,258 8,140
As % of all permanent jobs advertised in the UK excluding London 10.23% 8.84% 10.39%
Number of salaries quoted 3,195 2,556 4,301
10th Percentile £24,250 £23,500 £24,750
25th Percentile £27,500 £28,000 £30,000
Median annual salary (50th Percentile) £37,500 £37,500 £40,000
Median % change year-on-year - -6.25% -
75th Percentile £51,250 £52,813 £52,500
90th Percentile £65,225 £66,500 £62,500
UK median annual salary £40,500 £44,494 £45,000
% change year-on-year -8.98% -1.12% -

Simulink
Job Vacancy Trend in the UK excluding London

Job postings citing Simulink as a proportion of all IT jobs advertised in the UK excluding London.
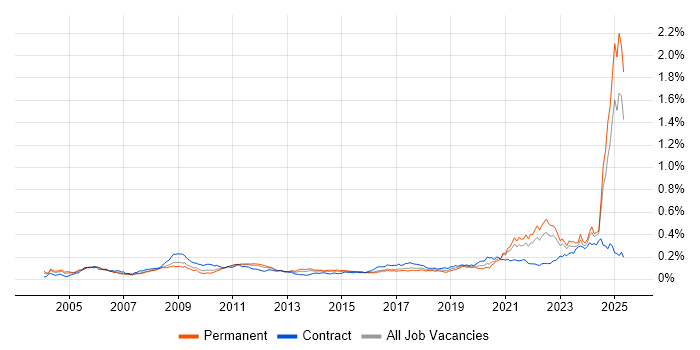
Job vacancy trend for Simulink in the UK excluding London

Simulink
Salary Trend in the UK excluding London

3-month moving average salary quoted in jobs citing Simulink in the UK excluding London.

Salary trend for Simulink in the UK excluding London

Simulink
Salary Histogram in the UK excluding London

Salary distribution for jobs citing Simulink in the UK excluding London over the 6 months to 26 July 2024.

Salary histogram for Simulink in the UK excluding London

Simulink
Job Locations in the UK excluding London

The table below looks at the demand and provides a guide to the median salaries quoted in IT jobs citing Simulink within the UK excluding London region over the 6 months to 26 July 2024. The 'Rank Change' column provides an indication of the change in demand within each location based on the same 6 month period last year.

Location Rank Change
on Same Period
Last Year
Matching
Permanent
IT Job Ads
Median Salary
Past 6 Months
Median Salary
% Change
on Same Period
Last Year
Live
Jobs
South East +86 125 £60,000 +9.09% 22
South West +27 34 £55,000 +7.32% 6
Midlands -77 30 £60,000 +20.00% 12
East of England +7 28 £65,000 +85.71% 14
West Midlands -62 24 £62,500 +25.00% 4
Scotland - 12 £65,000 - 4
North of England - 11 £50,000 - 5
North West - 7 £50,000 - 4
East Midlands -24 6 £50,000 -16.67% 8
Yorkshire - 4 - -
Simulink
UK

Simulink
Co-occurring Skills and Capabilities in the UK excluding London by Category

The follow tables expand on the table above by listing co-occurrences grouped by category. The same employment type, locality and period is covered with up to 20 co-occurrences shown in each of the following categories:

Application Platforms
1 1 (0.42%) Confluence
Applications
1 31 (12.92%) Stateflow
2 2 (0.83%) CANalyzer
3 1 (0.42%) TargetLink
Business Applications
1 3 (1.25%) Teamcenter
Cloud Services
1 37 (15.42%) AWS
1 37 (15.42%) Azure
2 5 (2.08%) GCP
Communications & Networking
1 15 (6.25%) J1939
2 4 (1.67%) Ethernet
3 2 (0.83%) FlexRay
3 2 (0.83%) TCP/IP
4 1 (0.42%) RS-422
4 1 (0.42%) Software-Defined Radio
4 1 (0.42%) Tactical Data Link
Database & Business Intelligence
1 32 (13.33%) NoSQL
Development Applications
1 45 (18.75%) Git
2 32 (13.33%) Vagrant
3 23 (9.58%) Rational DOORS
4 12 (5.00%) JIRA
5 9 (3.75%) ClearCase
5 9 (3.75%) LabVIEW
5 9 (3.75%) Rational Rhapsody
6 8 (3.33%) Plastic SCM
7 5 (2.08%) ClearQuest
7 5 (2.08%) Subversion
8 4 (1.67%) CANoe
9 1 (0.42%) Bitbucket
9 1 (0.42%) GitLab
9 1 (0.42%) Jenkins
9 1 (0.42%) Rational Team Concert
General
1 68 (28.33%) Social Skills
2 66 (27.50%) Automotive
3 54 (22.50%) Electronics
4 27 (11.25%) Aerospace
5 17 (7.08%) Military
6 13 (5.42%) Legal
7 10 (4.17%) Retail
8 9 (3.75%) Analytical Skills
9 5 (2.08%) Manufacturing
10 3 (1.25%) Aviation
10 3 (1.25%) Inclusion and Diversity
10 3 (1.25%) Telecoms
11 2 (0.83%) Finance
11 2 (0.83%) Games
11 2 (0.83%) Presentation Skills
Job Titles
1 86 (35.83%) Software Engineer
2 49 (20.42%) Systems Engineer
3 40 (16.67%) Embedded Engineer
4 35 (14.58%) Embedded Software Engineer
5 34 (14.17%) Developer
6 33 (13.75%) Senior
7 32 (13.33%) Embedded Developer
7 32 (13.33%) Embedded Software Developer
7 32 (13.33%) SC Cleared Software Engineer
7 32 (13.33%) Software Developer
8 15 (6.25%) Architect
9 14 (5.83%) Algorithm Engineer
10 11 (4.58%) Control Systems Engineer
11 8 (3.33%) Senior Systems Engineer
11 8 (3.33%) Software Architect
12 6 (2.50%) Development Engineer
12 6 (2.50%) Radar Engineer
12 6 (2.50%) Senior Architect
12 6 (2.50%) Senior Solutions Architect
12 6 (2.50%) Solutions Architect
Libraries, Frameworks & Software Standards
1 32 (13.33%) Middleware
2 5 (2.08%) AngularJS
2 5 (2.08%) React
3 4 (1.67%) PyTorch
4 2 (0.83%) TensorFlow
4 2 (0.83%) Torch
5 1 (0.42%) Qt
Miscellaneous
1 65 (27.08%) Algorithms
2 39 (16.25%) Embedded Systems
3 11 (4.58%) Robotics
4 9 (3.75%) FPGA
5 8 (3.33%) Cyber Threat
5 8 (3.33%) VHDL
6 7 (2.92%) Device Driver
7 6 (2.50%) CAN bus
7 6 (2.50%) Verilog
8 4 (1.67%) Driving Licence
8 4 (1.67%) PMI
9 2 (0.83%) Analogue Electronics
9 2 (0.83%) State Machine
10 1 (0.42%) Distributed Systems
10 1 (0.42%) Management Information System
10 1 (0.42%) PCIe
10 1 (0.42%) Product Ownership
Operating Systems
1 72 (30.00%) Linux
2 37 (15.42%) Embedded Linux
3 32 (13.33%) Android
3 32 (13.33%) CentOS
3 32 (13.33%) Red Hat Enterprise Linux
3 32 (13.33%) Ubuntu
4 3 (1.25%) FreeRTOS
4 3 (1.25%) VxWorks
4 3 (1.25%) Windows
5 1 (0.42%) VMS
Processes & Methodologies
1 140 (58.33%) Software Engineering
2 92 (38.33%) Artificial Intelligence
2 92 (38.33%) Machine Learning
3 89 (37.08%) Computer Science
4 84 (35.00%) Signal Processing
5 67 (27.92%) Collaborative Working
6 59 (24.58%) Problem-Solving
7 42 (17.50%) Validation
8 41 (17.08%) Systems Engineering
9 39 (16.25%) Embedded Software Development
10 35 (14.58%) Code Quality
11 34 (14.17%) Continuous Integration
12 33 (13.75%) DevOps
12 33 (13.75%) System Testing
13 32 (13.33%) Agile
13 32 (13.33%) Infrastructure as Code
13 32 (13.33%) Mathematics
13 32 (13.33%) Microservices
14 31 (12.92%) Hardware-in-the-Loop
15 28 (11.67%) UML
Programming Languages
1 156 (65.00%) MATLAB
2 123 (51.25%) C++
3 113 (47.08%) Python
4 100 (41.67%) C
5 78 (32.50%) Java
6 43 (17.92%) JavaScript
7 33 (13.75%) SQL
8 32 (13.33%) Kotlin
9 23 (9.58%) Embedded C
10 8 (3.33%) C#
10 8 (3.33%) PHP
11 6 (2.50%) Embedded C++
12 3 (1.25%) Perl
13 2 (0.83%) SystemVerilog
14 1 (0.42%) Ada
14 1 (0.42%) Rust
Qualifications
1 178 (74.17%) Degree
2 129 (53.75%) Security Cleared
3 77 (32.08%) Computer Science Degree
4 61 (25.42%) SC Cleared
5 37 (15.42%) DV Cleared
6 14 (5.83%) BPSS Clearance
6 14 (5.83%) HND
7 10 (4.17%) HNC
8 4 (1.67%) PMI Certification
9 2 (0.83%) Master's Degree
9 2 (0.83%) PhD
Quality Assurance & Compliance
1 27 (11.25%) AUTOSAR
2 25 (10.42%) ISO 26262
3 17 (7.08%) Automotive SPICE
4 14 (5.83%) MISRA
5 6 (2.50%) Def Stans
6 5 (2.08%) IEC 61508
6 5 (2.08%) MISRA C
7 3 (1.25%) QA
8 2 (0.83%) ISO/IEC 12207
8 2 (0.83%) ISO/IEC 15288
System Software
1 15 (6.25%) Firmware
2 9 (3.75%) Embedded Firmware
3 5 (2.08%) Docker
Systems Management
1 37 (15.42%) Terraform
2 32 (13.33%) Ansible
3 10 (4.17%) Functional Safety
Vendors
1 80 (33.33%) Xilinx
2 13 (5.42%) IBM
3 8 (3.33%) Lauterbach
4 6 (2.50%) Facebook
4 6 (2.50%) Instagram
5 4 (1.67%) MathWorks
5 4 (1.67%) Rockwell
6 2 (0.83%) ANSYS
6 2 (0.83%) Intel
6 2 (0.83%) Mentor Graphics
6 2 (0.83%) Microsemi
6 2 (0.83%) OpenAI
6 2 (0.83%) Wind River
7 1 (0.42%) Freescale
7 1 (0.42%) Riverbed
7 1 (0.42%) Siemens