Influencing Skills Jobs in the UK excluding London

Influencing Skills
UK > UK excluding London

The table below looks at the prevalence of the term Influencing Skills in permanent job vacancies in the UK excluding London. Included is a benchmarking guide to the salaries offered in vacancies that cited Influencing Skills over the 6 months leading up to 26 July 2024, comparing them to the same period in the previous two years.

6 months to
26 Jul 2024
Same period 2023 Same period 2022
Rank 186 175 170
Rank change year-on-year -11 -5 +58
Permanent jobs citing Influencing Skills 899 985 1,741
As % of all permanent jobs advertised in the UK excluding London 1.38% 2.05% 2.22%
As % of the General category 2.55% 3.11% 3.44%
Number of salaries quoted 247 366 918
10th Percentile £37,199 £38,897 £35,125
25th Percentile £40,988 £43,067 £43,500
Median annual salary (50th Percentile) £52,500 £55,000 £51,500
Median % change year-on-year -4.55% +6.80% -4.63%
75th Percentile £69,920 £76,250 £67,500
90th Percentile £88,000 £91,250 £83,750
UK median annual salary £56,075 £62,500 £59,064
% change year-on-year -10.28% +5.82% -2.01%

All General Skills
UK excluding London

Influencing Skills falls under the General Skills category. For comparison with the information above, the following table provides summary statistics for all permanent job vacancies requiring common skills in the UK excluding London.

Permanent vacancies with a requirement for common skills 35,229 31,627 50,647
As % of all permanent jobs advertised in the UK excluding London 53.97% 65.69% 64.67%
Number of salaries quoted 20,712 17,348 26,425
10th Percentile £26,250 £28,250 £28,750
25th Percentile £35,000 £37,500 £37,500
Median annual salary (50th Percentile) £47,557 £52,500 £50,000
Median % change year-on-year -9.42% +5.00% +5.26%
75th Percentile £62,500 £67,500 £65,720
90th Percentile £76,250 £81,250 £80,000
UK median annual salary £54,000 £60,000 £60,000
% change year-on-year -10.00% - +6.19%

Influencing Skills
Job Vacancy Trend in the UK excluding London

Job postings citing Influencing Skills as a proportion of all IT jobs advertised in the UK excluding London.
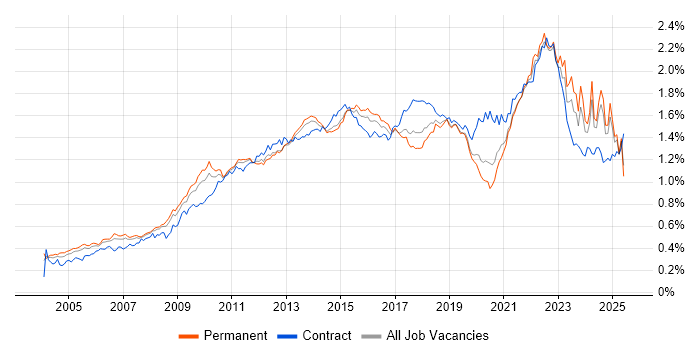
Job vacancy trend for Influencing Skills in the UK excluding London

Influencing Skills
Salary Trend in the UK excluding London

3-month moving average salary quoted in jobs citing Influencing Skills in the UK excluding London.

Salary trend for Influencing Skills in the UK excluding London

Influencing Skills
Salary Histogram in the UK excluding London

Salary distribution for jobs citing Influencing Skills in the UK excluding London over the 6 months to 26 July 2024.

Salary histogram for Influencing Skills in the UK excluding London

Influencing Skills
Job Locations in the UK excluding London

The table below looks at the demand and provides a guide to the median salaries quoted in IT jobs citing Influencing Skills within the UK excluding London region over the 6 months to 26 July 2024. The 'Rank Change' column provides an indication of the change in demand within each location based on the same 6 month period last year.

Location Rank Change
on Same Period
Last Year
Matching
Permanent
IT Job Ads
Median Salary
Past 6 Months
Median Salary
% Change
on Same Period
Last Year
Live
Jobs
South East +80 298 £49,500 -20.80% 40
Midlands -15 225 £57,500 +4.55% 31
West Midlands +9 194 £57,500 +4.55% 19
Scotland -13 126 £49,225 +0.46% 11
North of England -111 120 £45,000 -22.69% 54
South West -25 75 £60,000 +4.35% 33
North West -109 60 £42,500 -22.73% 31
East of England +7 44 £55,528 +0.96% 19
Yorkshire -22 44 £51,156 -21.72% 17
East Midlands -46 30 £57,500 -20.69% 12
North East +2 16 £50,000 +16.28% 10
Wales -11 9 £30,000 -30.34% 5
Northern Ireland 0 2 - - 9
Influencing Skills
UK

Influencing Skills
Co-occurring Skills and Capabilities in the UK excluding London by Category

The follow tables expand on the table above by listing co-occurrences grouped by category. The same employment type, locality and period is covered with up to 20 co-occurrences shown in each of the following categories:

Application Platforms
1 93 (10.34%) Apache Spark
2 10 (1.11%) Confluence
3 7 (0.78%) SharePoint
4 3 (0.33%) Adobe Experience Manager
4 3 (0.33%) CMS
5 1 (0.11%) Liferay
5 1 (0.11%) Microsoft Exchange
Applications
1 254 (28.25%) Microsoft Excel
2 152 (16.91%) Microsoft Office
3 34 (3.78%) Microsoft PowerPoint
4 8 (0.89%) MS Visio
5 7 (0.78%) Spreadsheet
6 6 (0.67%) Microsoft Project
7 3 (0.33%) Adobe Illustrator
7 3 (0.33%) Photoshop
8 2 (0.22%) Adobe Captivate
8 2 (0.22%) Adobe Creative Suite
9 1 (0.11%) CATIA
9 1 (0.11%) NASTRAN
9 1 (0.11%) Oracle Smart View
Business Applications
1 4 (0.44%) Dynamics CRM
2 2 (0.22%) NEC Housing
3 1 (0.11%) Dynamics AX
3 1 (0.11%) Exchequer
3 1 (0.11%) Teamcenter
Cloud Services
1 38 (4.23%) AWS
2 34 (3.78%) Azure
3 20 (2.22%) Power Platform
4 8 (0.89%) Azure AKS
4 8 (0.89%) Azure App Service
4 8 (0.89%) Azure DevOps
4 8 (0.89%) Azure Service Bus
4 8 (0.89%) WhatsApp
5 6 (0.67%) Microsoft 365
6 5 (0.56%) Dynamics 365
7 4 (0.44%) SaaS
8 2 (0.22%) Adobe Creative Cloud
8 2 (0.22%) Contentsquare
8 2 (0.22%) GCP
8 2 (0.22%) Google Analytics
8 2 (0.22%) Smartsheet
9 1 (0.11%) Amazon ECS
9 1 (0.11%) Amazon GuardDuty
9 1 (0.11%) Azure Logic Apps
9 1 (0.11%) Power Automate
Communications & Networking
1 214 (23.80%) Broadband
2 5 (0.56%) WAN
3 4 (0.44%) LAN
4 3 (0.33%) DNS
4 3 (0.33%) Intranet
4 3 (0.33%) Structured Cabling
4 3 (0.33%) VLAN
5 2 (0.22%) SSL
5 2 (0.22%) Wireless
6 1 (0.11%) 4G
6 1 (0.11%) 5G
6 1 (0.11%) DHCP
6 1 (0.11%) Firewall
6 1 (0.11%) IKE
6 1 (0.11%) Network Security
6 1 (0.11%) Wi-Fi
Database & Business Intelligence
1 93 (10.34%) Big Data
1 93 (10.34%) NoSQL
2 17 (1.89%) Power BI
3 11 (1.22%) SQL Server
4 8 (0.89%) Data Mining
5 6 (0.67%) Tableau
6 5 (0.56%) Electronic Patient Records
6 5 (0.56%) Qlik Sense
7 1 (0.11%) BusinessObjects
7 1 (0.11%) Data Lake
7 1 (0.11%) Data Vault
7 1 (0.11%) Delta Lake
7 1 (0.11%) Elasticsearch
7 1 (0.11%) GIS
7 1 (0.11%) InfluxDB
7 1 (0.11%) Metadata
7 1 (0.11%) Oracle BI Publisher
7 1 (0.11%) PostgreSQL
7 1 (0.11%) SAP BW
7 1 (0.11%) SQL Server Reporting Services
Development Applications
1 11 (1.22%) Cucumber
2 10 (1.11%) JIRA
2 10 (1.11%) Selenium
3 9 (1.00%) Git
4 8 (0.89%) TeamCity
5 2 (0.22%) Cypress.io
5 2 (0.22%) Jenkins
5 2 (0.22%) Postman
5 2 (0.22%) Rational DOORS
6 1 (0.11%) Artifactory
6 1 (0.11%) GitLab
6 1 (0.11%) JMeter
6 1 (0.11%) Rational Rhapsody
6 1 (0.11%) SpecFlow
General
1 619 (68.85%) Social Skills
2 470 (52.28%) Finance
3 435 (48.39%) Analytical Skills
4 149 (16.57%) Inclusion and Diversity
5 136 (15.13%) Organisational Skills
6 119 (13.24%) Marketing
7 117 (13.01%) Law
8 59 (6.56%) Public Sector
9 58 (6.45%) Retail
10 46 (5.12%) Presentation Skills
11 44 (4.89%) Legal
12 42 (4.67%) Manufacturing
13 32 (3.56%) Financial Institution
14 18 (2.00%) Aerospace
15 17 (1.89%) Games
16 14 (1.56%) Banking
16 14 (1.56%) Telecoms
17 12 (1.33%) Local Government
18 11 (1.22%) Pharmaceutical
19 10 (1.11%) Automotive
Job Titles
1 379 (42.16%) Analyst
2 209 (23.25%) Senior
3 124 (13.79%) Senior Analyst
4 120 (13.35%) Product Analyst
4 120 (13.35%) Sales Analyst
5 105 (11.68%) Lead
6 86 (9.57%) Project Manager
7 68 (7.56%) Software Engineer
8 63 (7.01%) Lead Software Engineer
9 61 (6.79%) Big Data Engineer
9 61 (6.79%) Big Data Software Engineer
9 61 (6.79%) Java Engineer
9 61 (6.79%) Java Scala Software Engineer
9 61 (6.79%) Java Software Engineer
9 61 (6.79%) Lead Big Data Engineer
9 61 (6.79%) Lead Java Engineer
9 61 (6.79%) Scala Engineer
9 61 (6.79%) Scala Software Engineer
10 48 (5.34%) Commercial Analyst
10 48 (5.34%) Financial Analyst
Libraries, Frameworks & Software Standards
1 11 (1.22%) .NET
2 10 (1.11%) Gherkin
3 9 (1.00%) CSS
3 9 (1.00%) HTML
3 9 (1.00%) YAML
4 8 (0.89%) .NET Core
4 8 (0.89%) .NET Framework
4 8 (0.89%) ASP.NET
4 8 (0.89%) ASP.NET 2.0
4 8 (0.89%) ASP.NET Web API
4 8 (0.89%) Blazor
4 8 (0.89%) Entity Framework
4 8 (0.89%) HTML5
4 8 (0.89%) JSON
4 8 (0.89%) Razor View Engine
4 8 (0.89%) RESTful
4 8 (0.89%) XML
5 3 (0.33%) React
6 2 (0.22%) EDI
7 1 (0.11%) Middleware
Miscellaneous
1 50 (5.56%) Management Information System
2 39 (4.34%) Cloud Native
3 18 (2.00%) Analytical Mindset
3 18 (2.00%) FMCG
4 16 (1.78%) Self-Motivation
5 12 (1.33%) Onboarding
6 11 (1.22%) Product Ownership
7 10 (1.11%) PMI
8 9 (1.00%) IoT
8 9 (1.00%) Social Media
9 6 (0.67%) Data Protection Act
9 6 (0.67%) Digital Signage
9 6 (0.67%) Driving Licence
9 6 (0.67%) Freedom of Information
9 6 (0.67%) NHS
9 6 (0.67%) Reference Data
10 5 (0.56%) Data Centre
10 5 (0.56%) Mobile App
10 5 (0.56%) Renewable Energy
11 4 (0.44%) Virtual Team
Operating Systems
1 4 (0.44%) Windows
2 3 (0.33%) Windows Server
3 2 (0.22%) Linux
3 2 (0.22%) Ubuntu
3 2 (0.22%) Unix
4 1 (0.11%) CentOS
4 1 (0.11%) Red Hat Enterprise Linux
Processes & Methodologies
1 419 (46.61%) Agile
2 348 (38.71%) Mentoring
3 255 (28.36%) Problem-Solving
4 253 (28.14%) Decision-Making
5 239 (26.59%) Business Case
6 228 (25.36%) Actionable Insight
7 221 (24.58%) Budgeting
8 215 (23.92%) Budgeting and Forecasting
9 178 (19.80%) Continuous Improvement
10 146 (16.24%) Customer Requirements
11 143 (15.91%) Customer Service
12 125 (13.90%) Project Management
13 122 (13.57%) Mathematics
14 105 (11.68%) Coaching
14 105 (11.68%) SDLC
15 103 (11.46%) Software Engineering
16 93 (10.34%) Performance Tuning
17 81 (9.01%) CI/CD
18 76 (8.45%) Risk Management
19 72 (8.01%) Stakeholder Management
Programming Languages
1 115 (12.79%) SQL
2 97 (10.79%) Java
3 93 (10.34%) Scala
4 11 (1.22%) JavaScript
5 9 (1.00%) C#
5 9 (1.00%) Python
5 9 (1.00%) SystemVerilog
5 9 (1.00%) T-SQL
6 4 (0.44%) C++
6 4 (0.44%) Perl
7 3 (0.33%) C
7 3 (0.33%) PHP
7 3 (0.33%) VB
8 2 (0.22%) PL/SQL
8 2 (0.22%) R
9 1 (0.11%) Bash
9 1 (0.11%) Bicep
9 1 (0.11%) Clipper
9 1 (0.11%) Groovy
9 1 (0.11%) TypeScript
Qualifications
1 251 (27.92%) Degree
2 216 (24.03%) ACCA
3 215 (23.92%) CIMA
4 62 (6.90%) Security Cleared
5 28 (3.11%) SC Cleared
6 14 (1.56%) Computer Science Degree
6 14 (1.56%) DV Cleared
6 14 (1.56%) PMI Certification
7 11 (1.22%) CRISC
8 9 (1.00%) TOGAF Certification
9 7 (0.78%) DBS Check
10 6 (0.67%) CISM
11 5 (0.56%) CISSP
11 5 (0.56%) Master's Degree
11 5 (0.56%) PMP
12 4 (0.44%) HNC
12 4 (0.44%) HND
12 4 (0.44%) ISTQB
13 3 (0.33%) CISA
13 3 (0.33%) ISTQB Foundation Certification
Quality Assurance & Compliance
1 37 (4.12%) QA
2 30 (3.34%) Data Quality
3 20 (2.22%) PMO
4 11 (1.22%) ISO/IEC 27001
5 10 (1.11%) GDPR
6 9 (1.00%) Cyber Essentials
7 8 (0.89%) GRC
8 5 (0.56%) COBIT
8 5 (0.56%) SLA
9 4 (0.44%) ISO 14001
9 4 (0.44%) ITGC
10 3 (0.33%) Cyber Essentials PLUS
10 3 (0.33%) Disclosure Scotland
10 3 (0.33%) ISO 9001
11 2 (0.22%) Accessibility
11 2 (0.22%) COSHH
11 2 (0.22%) IASME
11 2 (0.22%) NCSC
11 2 (0.22%) NIST
11 2 (0.22%) PCI DSS
System Software
1 3 (0.33%) Active Directory
2 2 (0.22%) Microsoft Virtual Server
2 2 (0.22%) Virtual Servers
2 2 (0.22%) VMware Infrastructure
3 1 (0.11%) Docker
3 1 (0.11%) Hyper-V
Systems Management
1 10 (1.11%) Kubernetes
2 9 (1.00%) SCOM
3 4 (0.44%) Terraform
4 2 (0.22%) Ansible
4 2 (0.22%) Progress Chef
5 1 (0.11%) Grafana
5 1 (0.11%) Kibana
5 1 (0.11%) Microsoft Intune
5 1 (0.11%) WSUS
Vendors
1 290 (32.26%) Microsoft
2 24 (2.67%) IFS
3 17 (1.89%) Workday
4 15 (1.67%) ServiceNow
5 9 (1.00%) Cadence
5 9 (1.00%) Synopsys
6 8 (0.89%) SAP
7 7 (0.78%) Adobe
8 4 (0.44%) VMware
9 3 (0.33%) HP
9 3 (0.33%) MuleSoft
9 3 (0.33%) Oracle
9 3 (0.33%) ScienceLogic
10 2 (0.22%) Ariba
10 2 (0.22%) Databricks
10 2 (0.22%) EMC
10 2 (0.22%) Meraki
10 2 (0.22%) NEC
10 2 (0.22%) Orchard
10 2 (0.22%) Salesforce