Coaching Jobs in the UK excluding London

Coaching
UK > UK excluding London

The table below provides summary statistics for permanent job vacancies advertised in the UK excluding London requiring Coaching skills. It includes a benchmarking guide to the annual salaries offered in vacancies that cited Coaching over the 6 months leading up to 30 May 2025, comparing them to the same period in the previous two years.

6 months to
30 May 2025
Same period 2024 Same period 2023
Rank 25 37 25
Rank change year-on-year +12 -12 +21
Permanent jobs citing Coaching 2,941 3,977 4,931
As % of all permanent jobs advertised in the UK excluding London 7.47% 5.33% 8.50%
As % of the Processes & Methodologies category 8.06% 6.48% 8.89%
Number of salaries quoted 821 2,245 1,102
10th Percentile £32,851 £35,920 £35,000
25th Percentile £42,500 £42,500 £47,250
Median annual salary (50th Percentile) £54,793 £57,965 £60,125
Median % change year-on-year -5.47% -3.59% -3.80%
75th Percentile £66,250 £75,772 £77,500
90th Percentile £87,500 £84,964 £90,000
UK median annual salary £54,793 £60,000 £65,600
% change year-on-year -8.68% -8.54% -2.81%

All Process and Methodology Skills
UK excluding London

Coaching falls under the Processes and Methodologies category. For comparison with the information above, the following table provides summary statistics for all permanent job vacancies requiring process or methodology skills in the UK excluding London.

Permanent vacancies with a requirement for process or methodology skills 36,483 61,419 55,450
As % of all permanent jobs advertised in the UK excluding London 92.65% 82.37% 95.58%
Number of salaries quoted 17,392 42,187 28,711
10th Percentile £26,250 £27,250 £30,500
25th Percentile £36,750 £36,250 £40,000
Median annual salary (50th Percentile) £51,574 £50,000 £55,000
Median % change year-on-year +3.15% -9.09% +4.76%
75th Percentile £65,000 £65,000 £70,000
90th Percentile £77,500 £77,500 £82,500
UK median annual salary £57,443 £55,000 £60,899
% change year-on-year +4.44% -9.69% +1.50%

Coaching
Job Vacancy Trend in the UK excluding London

Job postings citing Coaching as a proportion of all IT jobs advertised in the UK excluding London.
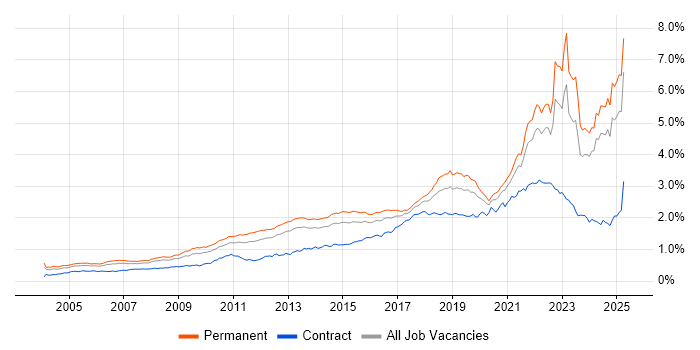
Job vacancy trend for Coaching in the UK excluding London

Coaching
Salary Trend in the UK excluding London

3-month moving average salary quoted in jobs citing Coaching in the UK excluding London.

Salary trend for Coaching in the UK excluding London

Coaching
Salary Histogram in the UK excluding London

Salary distribution for jobs citing Coaching in the UK excluding London over the 6 months to 30 May 2025.

Salary histogram for Coaching in the UK excluding London

Coaching
Job Locations in the UK excluding London

The table below looks at the demand and provides a guide to the median salaries quoted in IT jobs citing Coaching within the UK excluding London region over the 6 months to 30 May 2025. The 'Rank Change' column provides an indication of the change in demand within each location based on the same 6 month period last year.

Location Rank Change
on Same Period
Last Year
Matching
Permanent
IT Job Ads
Median Salary
Past 6 Months
Median Salary
% Change
on Same Period
Last Year
Live
Jobs
South East +29 752 £55,000 -4.35% 1,181
North of England -24 734 £54,793 -5.47% 1,094
North West -15 574 £54,793 -5.47% 562
East of England +33 454 £70,000 +21.74% 555
Midlands +6 392 £48,000 -17.19% 777
Scotland +46 380 £32,851 -43.36% 196
East Midlands +29 275 £42,500 -19.05% 299
South West +25 177 £58,000 +0.87% 490
West Midlands -46 117 £50,000 -14.75% 421
Yorkshire -52 99 £80,000 +29.04% 385
North East -12 61 £40,000 -34.65% 148
Wales +18 49 £52,500 -0.23% 122
Northern Ireland +24 21 £32,851 -6.14% 68
Coaching
UK

Coaching
Co-occurring Skills and Capabilities in the UK excluding London by Category

The follow tables expand on the table above by listing co-occurrences grouped by category. The same employment type, locality and period is covered with up to 20 co-occurrences shown in each of the following categories:

Application Platforms
1 50 (1.70%) Confluence
2 25 (0.85%) SharePoint
3 23 (0.78%) CMS
4 5 (0.17%) Microsoft Exchange
5 4 (0.14%) IBM Domino
5 4 (0.14%) SAS
6 2 (0.068%) Adobe Experience Manager
6 2 (0.068%) Apache Spark
6 2 (0.068%) NetWeaver
6 2 (0.068%) nginx
6 2 (0.068%) NServiceBus
6 2 (0.068%) ThingWorx
7 1 (0.034%) Apache
7 1 (0.034%) Apache Airflow
7 1 (0.034%) Appian
7 1 (0.034%) Kentico
7 1 (0.034%) Mendix
7 1 (0.034%) Oracle Workflow
7 1 (0.034%) Umbraco
7 1 (0.034%) WordPress
Applications
1 99 (3.37%) Microsoft Office
2 74 (2.52%) Simulink
3 52 (1.77%) Microsoft Excel
4 41 (1.39%) Microsoft PowerPoint
5 6 (0.20%) Trello
5 6 (0.20%) Windchill
6 3 (0.10%) Productboard
7 1 (0.034%) Microsoft Project
Business Applications
1 22 (0.75%) Dynamics AX
2 8 (0.27%) Salesforce CRM
3 7 (0.24%) Dynamics CRM
4 6 (0.20%) Teamcenter
5 5 (0.17%) PeopleSoft Financials
6 3 (0.10%) Oracle EBS
6 3 (0.10%) Sage 50
7 2 (0.068%) Oracle ERP
7 2 (0.068%) PeopleSoft HCM
8 1 (0.034%) Dynamics NAV
8 1 (0.034%) Oracle EBS R12
8 1 (0.034%) Oracle Procure-to-Pay
8 1 (0.034%) Primavera
8 1 (0.034%) Remedy ITSM
8 1 (0.034%) SAP Business One
Cloud Services
1 249 (8.47%) Azure
2 128 (4.35%) AWS
3 85 (2.89%) SaaS
4 70 (2.38%) Power Platform
5 68 (2.31%) Azure DevOps
6 58 (1.97%) PaaS
7 54 (1.84%) Microsoft 365
8 44 (1.50%) GCP
9 27 (0.92%) Serverless
10 18 (0.61%) Amazon SQS
10 18 (0.61%) AWS Lambda
11 17 (0.58%) iPaaS
12 15 (0.51%) AWS Step Functions
13 14 (0.48%) Amazon CloudWatch
13 14 (0.48%) Amazon EventBridge
13 14 (0.48%) AWS CodeBuild
13 14 (0.48%) AWS CodeDeploy
13 14 (0.48%) AWS CodePipeline
13 14 (0.48%) Boomi
13 14 (0.48%) Dynamics 365
Communications & Networking
1 726 (24.69%) Wi-Fi
2 724 (24.62%) Wireless
3 722 (24.55%) Bluetooth
4 721 (24.52%) 5G
4 721 (24.52%) GSM
4 721 (24.52%) LTE
4 721 (24.52%) UMTS
5 69 (2.35%) VPN
6 68 (2.31%) Broadband
6 68 (2.31%) TCP/IP
7 24 (0.82%) VoIP
8 13 (0.44%) Firewall
9 8 (0.27%) DNS
10 7 (0.24%) LAN
11 6 (0.20%) Network Security
11 6 (0.20%) VLAN
11 6 (0.20%) WAN
12 5 (0.17%) Internet
13 4 (0.14%) Intrusion Detection
13 4 (0.14%) SMTP
Database & Business Intelligence
1 62 (2.11%) Power BI
2 44 (1.50%) MySQL
3 43 (1.46%) SQL Server
4 40 (1.36%) Relational Database
5 21 (0.71%) Big Data
6 19 (0.65%) BusinessObjects
7 18 (0.61%) Data Mining
8 15 (0.51%) Data Warehouse
8 15 (0.51%) Tableau
9 14 (0.48%) PostgreSQL
10 13 (0.44%) BigQuery
10 13 (0.44%) Cloud Spanner
11 9 (0.31%) Looker
11 9 (0.31%) NoSQL
12 8 (0.27%) MongoDB
12 8 (0.27%) QlikView
13 6 (0.20%) SQL Server Reporting Services
14 5 (0.17%) Data Lake
14 5 (0.17%) SQL Server Analysis Services
14 5 (0.17%) SQL Server Integration Services
Development Applications
1 84 (2.86%) JIRA
2 67 (2.28%) Git
3 63 (2.14%) Cucumber
4 62 (2.11%) Robot Framework
5 36 (1.22%) Bitbucket
6 23 (0.78%) Rational DOORS
7 14 (0.48%) GitLab
7 14 (0.48%) Jenkins
8 7 (0.24%) ClearCase
9 6 (0.20%) Visual Studio
10 5 (0.17%) Subversion
11 3 (0.10%) Xcode
11 3 (0.10%) XCTest
11 3 (0.10%) XCUITest
12 2 (0.068%) Postman
12 2 (0.068%) SoapUI
12 2 (0.068%) Visual Studio Code
12 2 (0.068%) webpack
13 1 (0.034%) ER Studio
13 1 (0.034%) Katalon Studio
General
1 752 (25.57%) Electronics
2 634 (21.56%) Finance
3 620 (21.08%) Social Skills
4 320 (10.88%) Retail
5 262 (8.91%) Manufacturing
6 202 (6.87%) Aerospace
7 201 (6.83%) Inclusion and Diversity
8 196 (6.66%) Analytical Skills
9 154 (5.24%) Aeronautics
10 125 (4.25%) Banking
11 121 (4.11%) Telecoms
12 106 (3.60%) Public Sector
13 98 (3.33%) Legal
14 82 (2.79%) Influencing Skills
15 78 (2.65%) Marketing
16 74 (2.52%) Automotive
17 73 (2.48%) Law
18 70 (2.38%) Presentation Skills
19 61 (2.07%) Avionics
20 50 (1.70%) Games
Job Titles
1 804 (27.34%) Test Engineer
2 721 (24.52%) Electronics Engineer
2 721 (24.52%) Electronics Test Engineer
3 705 (23.97%) Senior
4 457 (15.54%) Lead
5 435 (14.79%) Systems Engineer
6 411 (13.97%) Senior Systems Engineer
7 164 (5.58%) Team Leader
8 128 (4.35%) Lead Systems Engineer
9 92 (3.13%) Technical Support
10 83 (2.82%) Support Technician
11 80 (2.72%) Senior Manager
12 76 (2.58%) Developer
13 71 (2.41%) Support Engineer
14 68 (2.31%) Audit Manager
15 65 (2.21%) Analyst
15 65 (2.21%) Principal Engineer
16 64 (2.18%) Principal Systems Engineer
17 63 (2.14%) Test Automation Engineer
18 56 (1.90%) Project Manager
Libraries, Frameworks & Software Standards
1 92 (3.13%) .NET
2 41 (1.39%) React
3 34 (1.16%) RESTful
4 28 (0.95%) AngularJS
5 23 (0.78%) .NET Framework
6 21 (0.71%) Kafka
6 21 (0.71%) Spring Boot
7 19 (0.65%) Node.js
8 18 (0.61%) HTML
8 18 (0.61%) REST
9 17 (0.58%) YAML
10 16 (0.54%) .NET Core
10 16 (0.54%) CSS
10 16 (0.54%) OAuth
11 15 (0.51%) JWT
12 12 (0.41%) Spring
13 9 (0.31%) Laravel
13 9 (0.31%) Middleware
14 8 (0.27%) Vue
15 7 (0.24%) XML
Miscellaneous
1 740 (25.16%) Driving Licence
2 118 (4.01%) Management Information System
3 78 (2.65%) Product Ownership
4 74 (2.52%) e-Learning
5 65 (2.21%) Hybrid Cloud
6 63 (2.14%) Linux Command Line
7 52 (1.77%) Blockchain
7 52 (1.77%) Robotics
8 51 (1.73%) FMCG
9 39 (1.33%) Self-Motivation
10 36 (1.22%) Data Structures
11 29 (0.99%) Public Cloud
12 26 (0.88%) Greenfield Project
12 26 (0.88%) Social Media
13 25 (0.85%) Security Posture
14 22 (0.75%) Onboarding
15 18 (0.61%) Private Cloud
16 17 (0.58%) Cloud Native
16 17 (0.58%) PMI
17 14 (0.48%) Algorithms
Operating Systems
1 213 (7.24%) Windows
2 126 (4.28%) Linux
3 65 (2.21%) Windows Server 2012
4 15 (0.51%) Windows Server
5 12 (0.41%) Apple iOS
6 10 (0.34%) Windows Vista
7 7 (0.24%) Mac OS
8 6 (0.20%) Windows 10
9 4 (0.14%) Android
10 3 (0.10%) Unix
11 1 (0.034%) Oracle Linux
Processes & Methodologies
1 1,509 (51.31%) Mentoring
2 793 (26.96%) Validation
3 787 (26.76%) Customer Requirements
4 784 (26.66%) Verification and Validation
5 723 (24.58%) Test Strategy
6 589 (20.03%) Agile
7 547 (18.60%) Systems Engineering
8 386 (13.12%) Customer Service
9 370 (12.58%) Mathematics
10 367 (12.48%) Physics
11 343 (11.66%) Customer Experience
12 285 (9.69%) Problem-Solving
13 261 (8.87%) DevOps
14 256 (8.70%) Continuous Improvement
15 222 (7.55%) Model-Based Systems Engineering
16 211 (7.17%) Creative Thinking
17 180 (6.12%) Analytics
18 178 (6.05%) Project Management
19 171 (5.81%) Risk Management
20 164 (5.58%) Performance Management
Programming Languages
1 122 (4.15%) JavaScript
2 121 (4.11%) Python
3 113 (3.84%) SQL
4 106 (3.60%) C#
5 97 (3.30%) PowerShell
6 72 (2.45%) Bash
7 63 (2.14%) Java
8 42 (1.43%) TypeScript
9 24 (0.82%) MATLAB
10 22 (0.75%) VBA
11 18 (0.61%) R
12 11 (0.37%) PHP
13 7 (0.24%) C
13 7 (0.24%) C++
14 6 (0.20%) Ada
14 6 (0.20%) Bicep
14 6 (0.20%) T-SQL
15 4 (0.14%) Julia
16 3 (0.10%) Go
16 3 (0.10%) Swift
Qualifications
1 1,499 (50.97%) Degree
2 954 (32.44%) HND
3 546 (18.57%) BPSS Clearance
4 105 (3.57%) HNC
5 90 (3.06%) NVQ Level 4
6 69 (2.35%) Chartered Engineer
7 60 (2.04%) Security Cleared
8 50 (1.70%) ACCA
9 46 (1.56%) CRISC
10 38 (1.29%) CISA
11 37 (1.26%) Microsoft Certification
12 35 (1.19%) Master's Degree
13 33 (1.12%) CISSP
14 29 (0.99%) Computer Science Degree
15 28 (0.95%) Six Sigma Green Belt
16 27 (0.92%) PMI Certification
16 27 (0.92%) Six Sigma Black Belt
17 26 (0.88%) CISM
18 22 (0.75%) ISACA
19 20 (0.68%) DBS Check
Quality Assurance & Compliance
1 156 (5.30%) ARP4754
1 156 (5.30%) DO-254
1 156 (5.30%) IEC 61508
2 108 (3.67%) QA
3 90 (3.06%) ISO 9001
4 80 (2.72%) AQAP
5 60 (2.04%) ITGC
6 58 (1.97%) ISO/IEC 27001
7 37 (1.26%) GAAP
7 37 (1.26%) IFRS
8 32 (1.09%) Data Quality
9 30 (1.02%) NIST
10 23 (0.78%) COBIT
11 21 (0.71%) Sarbanes-Oxley
12 19 (0.65%) Cyber Essentials
13 17 (0.58%) NCSC
14 16 (0.54%) SOC 2
15 15 (0.51%) PMO
15 15 (0.51%) SLA
16 13 (0.44%) GDPR
System Software
1 90 (3.06%) Active Directory
2 38 (1.29%) Docker
3 9 (0.31%) Virtual Desktop
4 7 (0.24%) Virtual Machines
5 6 (0.20%) Embedded Firmware
5 6 (0.20%) Firmware
6 5 (0.17%) Hyper-V
7 1 (0.034%) Apache Flume
7 1 (0.034%) HDFS
7 1 (0.034%) Snort
7 1 (0.034%) VMware Infrastructure
Systems Management
1 47 (1.60%) Kubernetes
2 37 (1.26%) Ansible
3 34 (1.16%) Terraform
4 10 (0.34%) Microsoft Intune
5 9 (0.31%) Grafana
6 7 (0.24%) Prometheus
7 5 (0.17%) CASB
7 5 (0.17%) SCCM
8 4 (0.14%) Argo
8 4 (0.14%) QRadar
9 2 (0.068%) Single Sign-On
9 2 (0.068%) WMI
10 1 (0.034%) Istio
10 1 (0.034%) Kibana
10 1 (0.034%) logstash
10 1 (0.034%) Nessus
10 1 (0.034%) Oozie
10 1 (0.034%) Progress Chef
10 1 (0.034%) Puppet
10 1 (0.034%) Systems Management Server (SMS)
Vendors
1 320 (10.88%) Microsoft
2 200 (6.80%) BT
3 69 (2.35%) IBM
4 65 (2.21%) Sun
5 62 (2.11%) Oracle
6 61 (2.07%) Red Hat
7 50 (1.70%) MathWorks
8 39 (1.33%) Atlassian
9 35 (1.19%) Salesforce
10 34 (1.16%) Google
11 33 (1.12%) SAP
12 32 (1.09%) Siemens
13 31 (1.05%) ServiceNow
14 25 (0.85%) Databricks
14 25 (0.85%) Informatica
15 22 (0.75%) Facebook
16 14 (0.48%) Commvault
16 14 (0.48%) MuleSoft
17 12 (0.41%) Cisco
17 12 (0.41%) Workday