JIRA Jobs in the UK excluding London

Atlassian JIRA
UK > UK excluding London

The table below provides summary statistics for permanent job vacancies advertised in the UK excluding London requiring JIRA skills. It includes a benchmarking guide to the annual salaries offered in vacancies that cited JIRA over the 6 months leading up to 16 June 2025, comparing them to the same period in the previous two years.

6 months to
16 Jun 2025
Same period 2024 Same period 2023
Rank 87 119 115
Rank change year-on-year +32 -4 -46
Permanent jobs citing JIRA 1,277 1,748 1,640
As % of all permanent jobs advertised in the UK excluding London 3.21% 2.16% 3.00%
As % of the Development Applications category 31.89% 26.02% 22.86%
Number of salaries quoted 590 1,109 985
10th Percentile £30,000 £30,500 £33,750
25th Percentile £42,500 £40,177 £42,500
Median annual salary (50th Percentile) £52,500 £52,500 £55,000
Median % change year-on-year - -4.55% +4.76%
75th Percentile £71,250 £65,000 £67,500
90th Percentile £77,500 £82,548 £77,715
UK median annual salary £60,000 £55,000 £60,000
% change year-on-year +9.09% -8.33% -

All Development Application Skills
UK excluding London

JIRA falls under the Development Applications category. For comparison with the information above, the following table provides summary statistics for all permanent job vacancies requiring development application skills in the UK excluding London.

Permanent vacancies with a requirement for development application skills 4,004 6,717 7,174
As % of all permanent jobs advertised in the UK excluding London 10.06% 8.29% 13.10%
Number of salaries quoted 2,370 4,505 4,200
10th Percentile £37,500 £33,750 £37,250
25th Percentile £45,000 £41,750 £45,000
Median annual salary (50th Percentile) £60,000 £55,000 £57,500
Median % change year-on-year +9.09% -4.35% +4.55%
75th Percentile £70,600 £69,500 £71,250
90th Percentile £81,250 £82,500 £83,750
UK median annual salary £62,000 £57,500 £65,000
% change year-on-year +7.83% -11.54% +4.00%

JIRA
Job Vacancy Trend in the UK excluding London

Job postings citing JIRA as a proportion of all IT jobs advertised in the UK excluding London.
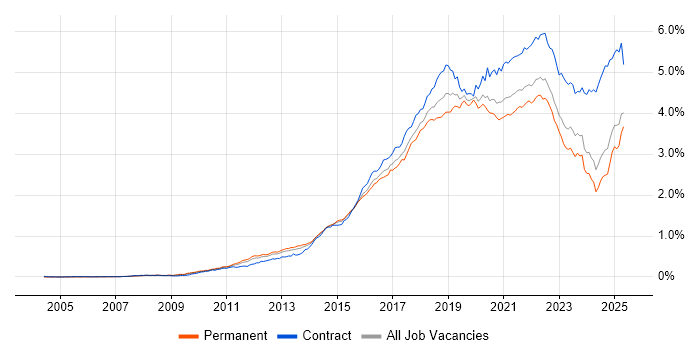
Job vacancy trend for JIRA in the UK excluding London

JIRA
Salary Trend in the UK excluding London

3-month moving average salary quoted in jobs citing JIRA in the UK excluding London.

Salary trend for JIRA in the UK excluding London

JIRA
Salary Histogram in the UK excluding London

Salary distribution for jobs citing JIRA in the UK excluding London over the 6 months to 16 June 2025.

Salary histogram for JIRA in the UK excluding London

JIRA
Job Locations in the UK excluding London

The table below looks at the demand and provides a guide to the median salaries quoted in IT jobs citing JIRA within the UK excluding London region over the 6 months to 16 June 2025. The 'Rank Change' column provides an indication of the change in demand within each location based on the same 6 month period last year.

Location Rank Change
on Same Period
Last Year
Matching
Permanent
IT Job Ads
Median Salary
Past 6 Months
Median Salary
% Change
on Same Period
Last Year
Live
Jobs
North of England +30 452 £50,000 -10.31% 954
North West +24 345 £48,750 -18.75% 489
Midlands +76 279 £55,000 +22.22% 688
South East -17 191 £60,000 +14.29% 1,296
West Midlands +73 175 £67,500 +50.00% 414
South West +11 134 £46,500 -7.00% 454
East of England +21 111 £53,000 +17.78% 543
East Midlands +60 104 £36,500 -23.16% 264
Scotland +32 96 £52,000 -16.80% 266
Yorkshire +38 94 £57,500 +9.52% 371
North East +4 15 £22,500 -57.14% 97
Wales +19 14 £65,000 +44.44% 111
Northern Ireland +39 12 £52,500 -4.55% 82
JIRA
UK

JIRA
Co-occurring Skills and Capabilities in the UK excluding London by Category

The follow tables expand on the table above by listing co-occurrences grouped by category. The same employment type, locality and period is covered with up to 20 co-occurrences shown in each of the following categories:

Application Platforms
1 555 (43.46%) Confluence
2 68 (5.32%) SharePoint
3 17 (1.33%) CMS
4 8 (0.63%) Microsoft Exchange
5 5 (0.39%) Headless CMS
5 5 (0.39%) IIS
5 5 (0.39%) nginx
5 5 (0.39%) Umbraco
6 3 (0.23%) Adobe Experience Manager
6 3 (0.23%) Kentico
6 3 (0.23%) Tomcat
6 3 (0.23%) WebSphere
7 2 (0.16%) Apache
7 2 (0.16%) Moodle
7 2 (0.16%) Totara
7 2 (0.16%) WebSphere Application Server
7 2 (0.16%) WordPress
8 1 (0.078%) Apache Airflow
8 1 (0.078%) Mendix
8 1 (0.078%) Strapi
Applications
1 55 (4.31%) Microsoft Office
2 46 (3.60%) Microsoft Project
3 40 (3.13%) Trello
4 33 (2.58%) Microsoft Excel
5 22 (1.72%) MS Visio
6 15 (1.17%) Microsoft PowerPoint
7 6 (0.47%) Chatbot
8 3 (0.23%) Mozilla Thunderbird
9 1 (0.078%) CANalyzer
9 1 (0.078%) Oracle Smart View
9 1 (0.078%) Weka
Business Applications
1 9 (0.70%) Salesforce CRM
2 6 (0.47%) Dynamics CRM
2 6 (0.47%) Remedy ITSM
3 3 (0.23%) Sparx Enterprise Architect
4 2 (0.16%) Shopify
5 1 (0.078%) Oracle ERP
5 1 (0.078%) Payment Gateway
5 1 (0.078%) SAP S/4HANA
5 1 (0.078%) Siebel CRM
Cloud Services
1 394 (30.85%) Azure
2 390 (30.54%) AWS
3 206 (16.13%) GCP
4 49 (3.84%) GitHub
5 41 (3.21%) Azure DevOps
6 39 (3.05%) Amazon EC2
7 38 (2.98%) Miro
8 36 (2.82%) Amazon S3
9 35 (2.74%) Microsoft 365
10 34 (2.66%) Amazon CloudWatch
11 33 (2.58%) Power Platform
11 33 (2.58%) Serverless
12 31 (2.43%) AWS KMS
13 26 (2.04%) Asana
14 25 (1.96%) Virtual Private Cloud
15 24 (1.88%) Amazon ELB
16 21 (1.64%) Amazon Glacier
16 21 (1.64%) SaaS
17 17 (1.33%) Dynamics 365
17 17 (1.33%) Power Automate
Communications & Networking
1 90 (7.05%) Broadband
2 42 (3.29%) Firewall
3 25 (1.96%) DNS
4 22 (1.72%) HTTP
5 15 (1.17%) SSH
6 13 (1.02%) VPN
7 10 (0.78%) DHCP
7 10 (0.78%) FTP
7 10 (0.78%) SMTP
7 10 (0.78%) VLAN
8 9 (0.70%) Internet
9 6 (0.47%) SAN
9 6 (0.47%) Wi-Fi
10 5 (0.39%) Wireless
11 4 (0.31%) 5G
11 4 (0.31%) Cisco IOS
11 4 (0.31%) LAN
11 4 (0.31%) Multicast
11 4 (0.31%) OpenLDAP
11 4 (0.31%) WAN
Database & Business Intelligence
1 295 (23.10%) SQL Server
2 66 (5.17%) MySQL
3 51 (3.99%) Relational Database
4 39 (3.05%) PostgreSQL
5 34 (2.66%) Amazon RDS
6 31 (2.43%) NoSQL
7 25 (1.96%) MongoDB
8 19 (1.49%) Power BI
9 12 (0.94%) Tableau
10 10 (0.78%) Amazon Aurora
11 9 (0.70%) Data Warehouse
12 8 (0.63%) Amazon Redshift
12 8 (0.63%) DynamoDB
12 8 (0.63%) Redis
13 7 (0.55%) BusinessObjects
14 6 (0.47%) Amazon QuickSight
15 5 (0.39%) Elasticsearch
15 5 (0.39%) SQL Server Analysis Services
15 5 (0.39%) SQL Server Integration Services
15 5 (0.39%) SQL Server Reporting Services
Development Applications
1 300 (23.49%) Bitbucket
2 298 (23.34%) Selenium
3 272 (21.30%) SonarQube
4 266 (20.83%) GitLab
5 260 (20.36%) Cucumber
5 260 (20.36%) Sonatype Nexus
6 255 (19.97%) Maven
7 172 (13.47%) Git
8 76 (5.95%) Rational DOORS
9 57 (4.46%) Jenkins
10 36 (2.82%) Visual Studio
11 24 (1.88%) Vagrant
12 17 (1.33%) JUnit
13 14 (1.10%) Postman
14 9 (0.70%) Subversion
15 8 (0.63%) Mockito
16 7 (0.55%) Cypress.io
16 7 (0.55%) DbUnit
16 7 (0.55%) jMock
16 7 (0.55%) TeamCity
General
1 420 (32.89%) Finance
2 312 (24.43%) Banking
3 291 (22.79%) Social Skills
4 270 (21.14%) Inclusion and Diversity
5 124 (9.71%) Retail
6 91 (7.13%) Investment Banking
7 90 (7.05%) Corporate Banking
8 78 (6.11%) Law
9 75 (5.87%) Analytical Skills
10 71 (5.56%) Manufacturing
11 51 (3.99%) Public Sector
12 45 (3.52%) Legal
13 32 (2.51%) Presentation Skills
14 28 (2.19%) Documentation Skills
14 28 (2.19%) Influencing Skills
15 27 (2.11%) Marketing
16 25 (1.96%) Organisational Skills
17 22 (1.72%) Electronics
18 18 (1.41%) Avionics
19 15 (1.17%) Automotive
Job Titles
1 310 (24.28%) Software Engineer
2 202 (15.82%) Senior
3 137 (10.73%) Analyst
4 126 (9.87%) Lead
5 92 (7.20%) Developer
6 70 (5.48%) Embedded Engineer
7 65 (5.09%) Architect
7 65 (5.09%) Release Engineer
8 58 (4.54%) Solutions Architect
9 56 (4.39%) Lead Architect
9 56 (4.39%) Lead Solutions Architect
10 52 (4.07%) Support Analyst
11 49 (3.84%) Principal Engineer
12 48 (3.76%) IT Support
13 44 (3.45%) Support Engineer
14 43 (3.37%) Project Manager
15 39 (3.05%) IT Analyst
16 36 (2.82%) Business Analyst
17 35 (2.74%) IT Support Analyst
18 33 (2.58%) Principal Systems Engineer
Libraries, Frameworks & Software Standards
1 295 (23.10%) React
2 286 (22.40%) HTML
3 282 (22.08%) CSS
4 278 (21.77%) Spring
5 269 (21.06%) Spring Boot
6 261 (20.44%) Kafka
7 256 (20.05%) Redux
8 254 (19.89%) JPA
9 166 (13.00%) Hibernate
10 117 (9.16%) REST
11 115 (9.01%) RESTful
12 100 (7.83%) Jest
13 99 (7.75%) HTML5
14 94 (7.36%) Sass
15 93 (7.28%) CSS3
16 77 (6.03%) Middleware
17 75 (5.87%) .NET
18 45 (3.52%) Node.js
19 42 (3.29%) AngularJS
20 25 (1.96%) Bootstrap
Miscellaneous
1 340 (26.62%) Product Ownership
2 250 (19.58%) Enterprise Software
3 68 (5.32%) Embedded Systems
4 33 (2.58%) Self-Motivation
5 30 (2.35%) Management Information System
6 24 (1.88%) SCADA
7 22 (1.72%) Social Media
7 22 (1.72%) Video\Live Streaming
8 21 (1.64%) Over-the-Top Content
9 20 (1.57%) Replication
10 19 (1.49%) Mobile App
11 18 (1.41%) Onboarding
11 18 (1.41%) Public Cloud
12 17 (1.33%) Operational Technology
13 15 (1.17%) Satnav
14 14 (1.10%) Cloud Native
15 11 (0.86%) IoT
15 11 (0.86%) Virtual Team
16 10 (0.78%) Algorithms
16 10 (0.78%) Data Structures
Operating Systems
1 139 (10.88%) Linux
2 111 (8.69%) Windows
3 24 (1.88%) VMS
4 16 (1.25%) Android
5 11 (0.86%) Amazon Linux
6 9 (0.70%) Windows Vista
7 7 (0.55%) Apple iOS
7 7 (0.55%) Mac OS
8 6 (0.47%) Ubuntu
8 6 (0.47%) Unix
8 6 (0.47%) Windows 10
8 6 (0.47%) Windows Server
9 5 (0.39%) Red Hat Enterprise Linux
10 3 (0.23%) Windows Server 2016
11 2 (0.16%) CentOS
11 2 (0.16%) Debian
11 2 (0.16%) Embedded Linux
11 2 (0.16%) Solaris
11 2 (0.16%) Windows Server 2012
11 2 (0.16%) Windows Server 2019
Processes & Methodologies
1 850 (66.56%) Agile
2 451 (35.32%) CI/CD
3 418 (32.73%) DevOps
4 356 (27.88%) Test Automation
5 334 (26.16%) Software Engineering
6 314 (24.59%) SDLC
7 292 (22.87%) Microservices
8 282 (22.08%) Full-Stack Development
9 277 (21.69%) Containerisation
10 275 (21.53%) Continuous Improvement
11 268 (20.99%) Front End Development
12 250 (19.58%) Performance Optimisation
13 200 (15.66%) Problem-Solving
14 193 (15.11%) Mentoring
14 193 (15.11%) TDD
15 166 (13.00%) Clean Code
16 163 (12.76%) Strategic Thinking
17 162 (12.69%) Roadmaps
18 154 (12.06%) User Experience
19 148 (11.59%) Project Management
Programming Languages
1 379 (29.68%) SQL
2 340 (26.62%) JavaScript
3 331 (25.92%) Java
4 131 (10.26%) TypeScript
5 86 (6.73%) C#
5 86 (6.73%) Python
6 37 (2.90%) PowerShell
7 29 (2.27%) Groovy
8 26 (2.04%) C
9 13 (1.02%) PHP
10 12 (0.94%) C++
11 9 (0.70%) Perl
12 7 (0.55%) Bash
13 6 (0.47%) Apex Code
14 5 (0.39%) Kotlin
15 4 (0.31%) Shell Script
15 4 (0.31%) T-SQL
16 3 (0.23%) Go
17 2 (0.16%) Ruby
17 2 (0.16%) SOQL
Qualifications
1 257 (20.13%) Degree
2 193 (15.11%) BPSS Clearance
3 69 (5.40%) Security Cleared
4 54 (4.23%) SC Cleared
5 50 (3.92%) Chartered Engineer
6 47 (3.68%) ISTQB
7 33 (2.58%) PMI Certification
8 31 (2.43%) PMP
9 30 (2.35%) HND
10 25 (1.96%) Computer Science Degree
11 22 (1.72%) DBS Check
12 15 (1.17%) HNC
13 14 (1.10%) Microsoft Certification
14 10 (0.78%) A+ Certification
14 10 (0.78%) Azure Certification
14 10 (0.78%) ISTQB Foundation Certification
15 7 (0.55%) AWS Certification
15 7 (0.55%) CITP
16 6 (0.47%) Numerate Degree
17 5 (0.39%) DV Cleared
Quality Assurance & Compliance
1 312 (24.43%) QA
2 106 (8.30%) Accessibility
3 39 (3.05%) SLA
4 21 (1.64%) Data Quality
5 10 (0.78%) GDPR
6 9 (0.70%) PMO
7 8 (0.63%) ISO 20022
7 8 (0.63%) ISO/IEC 27001
8 5 (0.39%) NIST
9 2 (0.16%) GxP
9 2 (0.16%) IEC 62304
9 2 (0.16%) ISO 13485
10 1 (0.078%) Def Stans
10 1 (0.078%) EMIR
10 1 (0.078%) Government Security Classifications
10 1 (0.078%) HIPAA
10 1 (0.078%) ISO 9001
10 1 (0.078%) NCSC
10 1 (0.078%) PCI DSS
10 1 (0.078%) Solvency II
System Software
1 318 (24.90%) Docker
2 43 (3.37%) Active Directory
3 18 (1.41%) DFS Replication
4 16 (1.25%) Firmware
5 13 (1.02%) VMware Infrastructure
6 10 (0.78%) Virtual Desktop
7 7 (0.55%) Hyper-V
8 3 (0.23%) Dovecot
8 3 (0.23%) Postfix
8 3 (0.23%) Squid
8 3 (0.23%) VMware ESXi
8 3 (0.23%) vSphere
9 2 (0.16%) KVM
9 2 (0.16%) NFS
9 2 (0.16%) pfSense
9 2 (0.16%) SRDF
9 2 (0.16%) Veritas Cluster Server
9 2 (0.16%) VMware NSX
9 2 (0.16%) Xen
10 1 (0.078%) RACF
Systems Management
1 294 (23.02%) Kubernetes
2 72 (5.64%) Ansible
3 47 (3.68%) Terraform
4 40 (3.13%) Grafana
5 34 (2.66%) Prometheus
6 8 (0.63%) Microsoft Intune
7 5 (0.39%) HP ALM
7 5 (0.39%) Nessus
7 5 (0.39%) Single Sign-On
8 4 (0.31%) ITRS Geneos
8 4 (0.31%) Progress Chef
8 4 (0.31%) Puppet
8 4 (0.31%) SCCM
9 3 (0.23%) Argo
9 3 (0.23%) Istio
9 3 (0.23%) Proxmox
9 3 (0.23%) vCenter Server
10 2 (0.16%) Docker Swarm
10 2 (0.16%) Packer
10 2 (0.16%) SCOM
Vendors
1 246 (19.26%) Solace
2 211 (16.52%) Microsoft
3 80 (6.26%) Atlassian
4 78 (6.11%) ServiceNow
5 67 (5.25%) SAP
6 66 (5.17%) Salesforce
7 56 (4.39%) Siemens
8 55 (4.31%) IBM
9 39 (3.05%) Google
10 31 (2.43%) Oracle
11 18 (1.41%) VMware
12 16 (1.25%) Juniper
13 13 (1.02%) Cisco
14 10 (0.78%) Splunk
15 8 (0.63%) Dynatrace
16 7 (0.55%) Adobe
16 7 (0.55%) Bloomberg
16 7 (0.55%) MuleSoft
17 6 (0.47%) HP
17 6 (0.47%) Remedy