EMC Jobs in the UK excluding London

EMC
UK > UK excluding London

The table below provides summary statistics for permanent job vacancies advertised in the UK excluding London with a requirement for knowledge and experience of EMC products and/or services. Included is a benchmarking guide to the salaries offered in vacancies that have cited EMC over the 6 months to 28 April 2024 with a comparison to the same period in the previous 2 years.

The figures below represent the IT labour market in general and are not representative of salaries within Dell EMC.

6 months to
28 Apr 2024
Same period 2023 Same period 2022
Rank 465 567 635
Rank change year-on-year +102 +68 -189
Permanent jobs citing EMC 314 192 214
As % of all permanent jobs advertised in the UK excluding London 0.45% 0.31% 0.30%
As % of the Vendors category 1.25% 0.73% 0.76%
Number of salaries quoted 162 113 143
10th Percentile £37,500 £34,605 £31,970
25th Percentile £42,500 £41,250 £40,000
Median annual salary (50th Percentile) £51,000 £50,000 £45,000
Median % change year-on-year +2.00% +11.11% -
75th Percentile £60,000 £62,500 £55,000
90th Percentile £67,250 £79,100 £67,500
UK median annual salary £51,000 £52,500 £50,000
% change year-on-year -2.86% +5.00% +8.70%

All Vendors
UK excluding London

EMC is in the Vendor Products and Services category. The following table is for comparison with the above and provides summary statistics for all permanent job vacancies with a requirement for knowledge or experience of vendor products and services advertised in the UK excluding London.

Permanent vacancies with a requirement for knowledge or experience of vendor products and services 25,158 26,195 28,192
As % of all permanent jobs advertised in the UK excluding London 35.89% 42.63% 39.86%
Number of salaries quoted 17,413 13,389 17,042
10th Percentile £25,750 £27,500 £26,500
25th Percentile £31,750 £36,250 £35,000
Median annual salary (50th Percentile) £45,000 £50,000 £47,500
Median % change year-on-year -10.00% +5.26% +4.40%
75th Percentile £60,000 £65,000 £62,500
90th Percentile £73,750 £77,715 £76,250
UK median annual salary £50,000 £57,500 £55,000
% change year-on-year -13.04% +4.55% +4.76%

EMC
Job Vacancy Trend in the UK excluding London

Job postings citing EMC as a proportion of all IT jobs advertised in the UK excluding London.
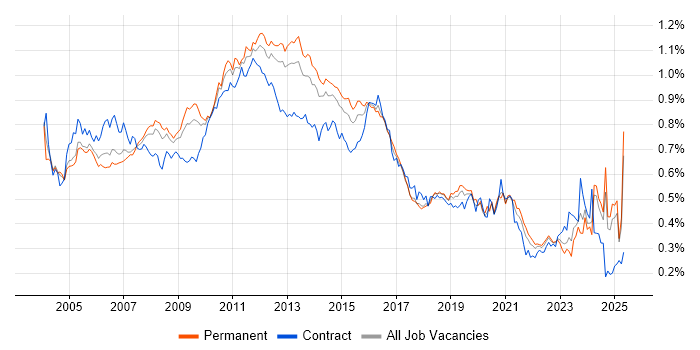
Job vacancy trend for EMC in the UK excluding London

EMC
Salary Trend in the UK excluding London

3-month moving average salary quoted in jobs citing EMC in the UK excluding London.

Salary trend for EMC in the UK excluding London

EMC
Salary Histogram in the UK excluding London

Salary distribution for jobs citing EMC in the UK excluding London over the 6 months to 28 April 2024.

Salary histogram for EMC in the UK excluding London

EMC
Job Locations in the UK excluding London

The table below looks at the demand and provides a guide to the median salaries quoted in IT jobs citing EMC within the UK excluding London region over the 6 months to 28 April 2024. The 'Rank Change' column provides an indication of the change in demand within each location based on the same 6 month period last year.

Location Rank Change
on Same Period
Last Year
Matching
Permanent
IT Job Ads
Median Salary
Past 6 Months
Median Salary
% Change
on Same Period
Last Year
Live
Jobs
South East +109 137 £55,000 +12.82% 60
Midlands +32 55 £57,500 +4.55% 39
East of England -2 46 £55,000 -6.38% 39
South West -6 33 £50,000 +3.09% 24
North of England +29 30 £39,500 -12.22% 23
West Midlands +42 29 £62,500 +31.58% 23
East Midlands +5 26 £40,000 -30.43% 16
North West +17 21 £48,750 +2.63% 16
Scotland -59 11 £55,000 - 6
North East -3 9 £39,500 -29.78% 1
Wales - 2 £45,000 - 3
EMC
UK

EMC
Co-occurring Skills and Capabilities in the UK excluding London by Category

The follow tables expand on the table above by listing co-occurrences grouped by category. The same employment type, locality and period is covered with up to 20 co-occurrences shown in each of the following categories:

Application Platforms
1 23 (7.32%) Microsoft Exchange
2 8 (2.55%) SharePoint
3 3 (0.96%) Alfresco
3 3 (0.96%) Documentum
3 3 (0.96%) FileNet
4 2 (0.64%) OpenStack
5 1 (0.32%) IIS
Applications
1 12 (3.82%) OrCAD
2 11 (3.50%) Microsoft Office
3 8 (2.55%) Microsoft Excel
4 4 (1.27%) AutoCAD
4 4 (1.27%) EPLAN
5 2 (0.64%) Abaqus
5 2 (0.64%) Fusion 360
5 2 (0.64%) Microsoft PowerPoint
5 2 (0.64%) Microsoft Project
6 1 (0.32%) SOLIDWORKS
Business Applications
1 1 (0.32%) SAP Business One
Cloud Services
1 53 (16.88%) Azure
2 38 (12.10%) Microsoft 365
3 23 (7.32%) AWS
4 12 (3.82%) OCI
5 11 (3.50%) GCP
6 8 (2.55%) Entra ID
7 7 (2.23%) OneDrive
7 7 (2.23%) OpenShift
7 7 (2.23%) SaaS
8 6 (1.91%) Nutanix
9 5 (1.59%) IaaS
9 5 (1.59%) PaaS
10 4 (1.27%) Microsoft Purview
11 3 (0.96%) Dropbox
11 3 (0.96%) Power Platform
12 2 (0.64%) Azure Sentinel
12 2 (0.64%) Rubrik
13 1 (0.32%) Amazon S3
13 1 (0.32%) AWS IoT
13 1 (0.32%) Azure Storage
Communications & Networking
1 39 (12.42%) SAN
2 18 (5.73%) Firewall
3 17 (5.41%) Wireless
4 13 (4.14%) Ethernet
4 13 (4.14%) iSCSI
5 12 (3.82%) DHCP
5 12 (3.82%) DNS
6 10 (3.18%) Bluetooth
7 9 (2.87%) Fibre Channel
8 7 (2.23%) WLAN
9 6 (1.91%) VPN
9 6 (1.91%) Wi-Fi
10 5 (1.59%) 3G
10 5 (1.59%) GPRS
10 5 (1.59%) Modbus
10 5 (1.59%) RS-232
10 5 (1.59%) RS-485
11 4 (1.27%) 4G
12 3 (0.96%) LAN
12 3 (0.96%) WAN
Database & Business Intelligence
1 22 (7.01%) SQL Server
2 18 (5.73%) MySQL
3 2 (0.64%) Hadoop
Development Applications
1 9 (2.87%) Subversion
2 8 (2.55%) JIRA
3 6 (1.91%) Git
4 5 (1.59%) Eclipse
5 2 (0.64%) LabVIEW
6 1 (0.32%) Visual Studio
General
1 152 (48.41%) Electronics
2 103 (32.80%) Manufacturing
3 86 (27.39%) Inclusion and Diversity
4 40 (12.74%) Social Skills
5 30 (9.55%) Public Sector
6 23 (7.32%) Finance
7 15 (4.78%) Analytical Skills
8 13 (4.14%) Legal
8 13 (4.14%) Marketing
9 12 (3.82%) Telecoms
10 11 (3.50%) Automotive
11 9 (2.87%) Aerospace
12 6 (1.91%) Advertising
13 5 (1.59%) Documentation Skills
13 5 (1.59%) Japanese Language
14 2 (0.64%) Influencing Skills
14 2 (0.64%) Military
14 2 (0.64%) Presentation Skills
15 1 (0.32%) Law
15 1 (0.32%) Retail
Job Titles
1 129 (41.08%) Electronics Engineer
2 72 (22.93%) Graduate
2 72 (22.93%) Graduate Electronics Engineer
2 72 (22.93%) Junior
2 72 (22.93%) Junior Electronics Engineer
3 71 (22.61%) Development Engineer
3 71 (22.61%) Graduate Development Engineer
4 58 (18.47%) Hardware Engineer
5 56 (17.83%) Systems Engineer
6 50 (15.92%) Infrastructure Engineer
7 44 (14.01%) Senior
8 41 (13.06%) Principal Engineer
9 38 (12.10%) Principal Systems Engineer
10 29 (9.24%) Storage Engineer
11 28 (8.92%) Electronics Hardware Engineer
12 20 (6.37%) Embedded Engineer
13 19 (6.05%) Backup Engineer
13 19 (6.05%) Senior Hardware Engineer
13 19 (6.05%) Storage and Backup Engineer
14 17 (5.41%) Backup Infrastructure Engineer
Libraries, Frameworks & Software Standards
1 4 (1.27%) Flash
2 3 (0.96%) .NET
2 3 (0.96%) Windows Identity Foundation
3 2 (0.64%) OpenMP
Miscellaneous
1 31 (9.87%) Analogue Electronics
2 30 (9.55%) FPGA
3 18 (5.73%) Data Centre
3 18 (5.73%) EMC VNX
4 14 (4.46%) Self-Motivation
5 12 (3.82%) IoT
6 11 (3.50%) VHDL
7 9 (2.87%) PCIe
8 8 (2.55%) ARM Cortex
8 8 (2.55%) Replication
8 8 (2.55%) VAX
9 7 (2.23%) Public Cloud
10 6 (1.91%) Embedded Systems
10 6 (1.91%) NB-IoT
10 6 (1.91%) Verilog
11 4 (1.27%) Management Information System
11 4 (1.27%) Operational Technology
11 4 (1.27%) Renewable Energy
11 4 (1.27%) Robotics
12 3 (0.96%) ASIC
Operating Systems
1 61 (19.43%) Linux
2 60 (19.11%) Windows
3 37 (11.78%) Windows Server
4 26 (8.28%) Windows Server 2016
5 21 (6.69%) Windows 10
6 19 (6.05%) Windows Server 2019
7 12 (3.82%) Windows Server 2012
7 12 (3.82%) Windows XP
8 10 (3.18%) Windows Server 2008
9 9 (2.87%) Windows 7
10 8 (2.55%) Red Hat Enterprise Linux
11 4 (1.27%) Unix
12 3 (0.96%) CentOS
12 3 (0.96%) Rocky
13 2 (0.64%) SUSE
13 2 (0.64%) SUSE Linux Enterprise Server
14 1 (0.32%) Embedded Linux
14 1 (0.32%) Solaris
14 1 (0.32%) ThreadX
14 1 (0.32%) Windows Server 2003
Processes & Methodologies
1 108 (34.39%) Schematic Capture
2 86 (27.39%) Project Planning
3 50 (15.92%) Infrastructure Engineering
4 47 (14.97%) Customer Service
5 41 (13.06%) Project Delivery
6 40 (12.74%) Systems Engineering
7 27 (8.60%) Problem-Solving
8 24 (7.64%) Validation
9 21 (6.69%) Software Engineering
9 21 (6.69%) Storage Management
10 20 (6.37%) Design for Manufacturing
10 20 (6.37%) Server Management
11 19 (6.05%) Mentoring
12 17 (5.41%) Project Management
13 15 (4.78%) Configuration Management
13 15 (4.78%) ITIL
13 15 (4.78%) Performance Tuning
14 14 (4.46%) Disaster Recovery
15 12 (3.82%) Business Intelligence
15 12 (3.82%) Performance Monitoring
Programming Languages
1 26 (8.28%) PowerShell
2 20 (6.37%) C
3 14 (4.46%) Embedded C
4 12 (3.82%) C++
5 10 (3.18%) Python
6 5 (1.59%) Assembly Language
6 5 (1.59%) C#
6 5 (1.59%) Shell Script
7 4 (1.27%) Bash
8 3 (0.96%) Java
8 3 (0.96%) Perl
9 2 (0.64%) Embedded C++
9 2 (0.64%) SQL
10 1 (0.32%) AWK
10 1 (0.32%) Bourne shell
10 1 (0.32%) Korn
10 1 (0.32%) MATLAB
Qualifications
1 188 (59.87%) Degree
2 48 (15.29%) Security Cleared
3 42 (13.38%) Master's Degree
4 38 (12.10%) Chartered Engineer
4 38 (12.10%) SC Cleared
5 18 (5.73%) DV Cleared
6 14 (4.46%) CCNA
6 14 (4.46%) Cisco Certification
7 12 (3.82%) CCNP
8 7 (2.23%) HND
9 5 (1.59%) BPSS Clearance
10 4 (1.27%) Computer Science Degree
10 4 (1.27%) EMC Certification
11 3 (0.96%) Microsoft Certification
12 2 (0.64%) HNC
12 2 (0.64%) MCSE
12 2 (0.64%) NVQ Level 3
12 2 (0.64%) PRINCE2 Practitioner
13 1 (0.32%) MCAD
13 1 (0.32%) RHCE
Quality Assurance & Compliance
1 4 (1.27%) IEC 61131
1 4 (1.27%) JTAG
1 4 (1.27%) QA
2 2 (0.64%) COSHH
2 2 (0.64%) GDPR
2 2 (0.64%) ISO 14001
2 2 (0.64%) ISO 9001
3 1 (0.32%) DO-160
System Software
1 115 (36.62%) Firmware
2 88 (28.03%) Embedded Firmware
3 44 (14.01%) VMware Infrastructure
4 39 (12.42%) Active Directory
5 30 (9.55%) VMware ESXi
6 20 (6.37%) Hyper-V
7 8 (2.55%) Docker
7 8 (2.55%) XenApp
8 7 (2.23%) SRDF
8 7 (2.23%) Virtual Desktop
8 7 (2.23%) Virtual Servers
9 4 (1.27%) vSphere
10 2 (0.64%) Lustre
10 2 (0.64%) Slurm Workload Manager
Systems Management
1 37 (11.78%) EMC NetWorker
2 30 (9.55%) vCenter Server
3 25 (7.96%) Nagios
4 19 (6.05%) SCCM
5 13 (4.14%) NetBackup
6 12 (3.82%) SCOM
6 12 (3.82%) WSUS
7 8 (2.55%) Ansible
7 8 (2.55%) EMC VPLEX
7 8 (2.55%) ZABBIX
8 7 (2.23%) Kubernetes
9 2 (0.64%) Functional Safety
10 1 (0.32%) NetCrunch
10 1 (0.32%) Oracle ZFS
10 1 (0.32%) Red Hat Satellite
10 1 (0.32%) yum
Vendors
1 69 (21.97%) Microsoft
2 57 (18.15%) VMware
3 44 (14.01%) Veeam
4 20 (6.37%) Brocade
5 19 (6.05%) Cisco
6 18 (5.73%) Dell
6 18 (5.73%) Oracle
7 17 (5.41%) SolarWinds
8 16 (5.10%) 3PAR
8 16 (5.10%) Palo Alto
9 15 (4.78%) Red Hat
10 14 (4.46%) HP
10 14 (4.46%) NetApp
11 12 (3.82%) Extreme Networks
11 12 (3.82%) Juniper
11 12 (3.82%) Symantec
12 11 (3.50%) SAP
13 9 (2.87%) Aruba
13 9 (2.87%) Meraki
14 8 (2.55%) Centreon