Master's Degree Jobs in the UK excluding London

Master's Degree
UK > UK excluding London

The table below provides summary statistics for permanent job vacancies advertised in the UK excluding London with a requirement for Master's Degree qualifications. It includes a benchmarking guide to the salaries offered over the 6 months leading up to 26 July 2024, comparing them to the same period in the previous two years.

6 months to
26 Jul 2024
Same period 2023 Same period 2022
Rank 236 39 187
Rank change year-on-year -197 +148 +66
Permanent jobs citing Master's Degree 698 3,275 1,570
As % of all permanent jobs advertised in the UK excluding London 1.07% 6.80% 2.00%
As % of the Qualifications category 4.14% 17.92% 6.01%
Number of salaries quoted 341 341 408
10th Percentile £33,000 £30,000 £31,250
25th Percentile £42,500 £42,750 £42,500
Median annual salary (50th Percentile) £57,500 £62,500 £55,000
Median % change year-on-year -8.00% +13.64% +7.32%
75th Percentile £75,000 £85,000 £72,500
90th Percentile £85,000 £93,750 £87,500
UK median annual salary £65,000 £75,000 £65,000
% change year-on-year -13.33% +15.38% -

All Academic and Professional Certifications
UK excluding London

Master's Degree falls under the Academic Qualifications and Professional Certifications category. For comparison with the information above, the following table provides summary statistics for all permanent job vacancies requiring academic qualifications or professional certifications in the UK excluding London.

Permanent vacancies requiring academic qualifications or professional certifications 16,873 18,275 26,124
As % of all permanent jobs advertised in the UK excluding London 25.85% 37.96% 33.36%
Number of salaries quoted 9,460 7,807 11,272
10th Percentile £28,500 £29,000 £28,109
25th Percentile £37,500 £37,500 £36,250
Median annual salary (50th Percentile) £50,000 £52,500 £48,500
Median % change year-on-year -4.76% +8.25% +2.11%
75th Percentile £65,000 £67,500 £63,750
90th Percentile £80,000 £80,000 £77,500
UK median annual salary £55,000 £60,000 £55,000
% change year-on-year -8.33% +9.09% -

Master's Degree
Job Vacancy Trend in the UK excluding London

Job postings citing Master's Degree as a proportion of all IT jobs advertised in the UK excluding London.
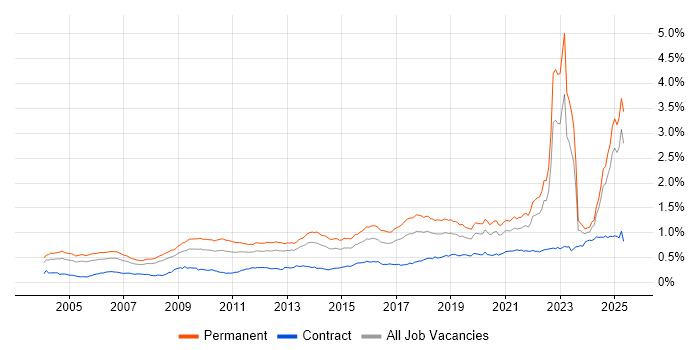
Job vacancy trend for Master's Degree in the UK excluding London

Master's Degree
Salary Trend in the UK excluding London

3-month moving average salary quoted in jobs citing Master's Degree in the UK excluding London.

Salary trend for Master's Degree in the UK excluding London

Master's Degree
Salary Histogram in the UK excluding London

Salary distribution for jobs citing Master's Degree in the UK excluding London over the 6 months to 26 July 2024.

Salary histogram for Master's Degree in the UK excluding London

Master's Degree
Job Locations in the UK excluding London

The table below looks at the demand and provides a guide to the median salaries quoted in IT jobs citing Master's Degree within the UK excluding London region over the 6 months to 26 July 2024. The 'Rank Change' column provides an indication of the change in demand within each location based on the same 6 month period last year.

Location Rank Change
on Same Period
Last Year
Matching
Permanent
IT Job Ads
Median Salary
Past 6 Months
Median Salary
% Change
on Same Period
Last Year
Live
Jobs
South East -96 252 £60,000 -9.43% 101
Scotland -71 106 £83,500 +39.17% 17
North of England -239 93 £55,000 +11.68% 76
East of England -99 78 £62,500 +8.70% 46
South West -142 77 £50,952 -32.06% 47
Midlands -208 68 £52,500 +40.00% 48
North West -176 61 £60,000 -4.00% 46
West Midlands -143 39 £43,500 -30.40% 22
East Midlands -149 28 £80,000 +160.16% 26
Northern Ireland +12 19 £72,500 +107.14% 30
North East -71 16 £50,000 +4.88% 7
Yorkshire -140 16 £52,500 +6.61% 23
Wales -46 5 £72,500 +2.84% 12
Master's Degree
UK

Master's Degree
Co-occurring Skills and Capabilities in the UK excluding London by Category

The follow tables expand on the table above by listing co-occurrences grouped by category. The same employment type, locality and period is covered with up to 20 co-occurrences shown in each of the following categories:

Application Platforms
1 29 (4.15%) FileNet
2 12 (1.72%) SharePoint
3 11 (1.58%) Apache
4 10 (1.43%) Apache Spark
5 6 (0.86%) Confluence
5 6 (0.86%) nginx
6 3 (0.43%) SAS
7 1 (0.14%) Apache Airflow
7 1 (0.14%) CMS
7 1 (0.14%) IIS
7 1 (0.14%) Jupyter
7 1 (0.14%) Luigi
7 1 (0.14%) Microsoft Exchange
Applications
1 30 (4.30%) Microsoft Office
2 27 (3.87%) Microsoft Excel
3 23 (3.30%) Microsoft PowerPoint
4 12 (1.72%) MS Visio
5 6 (0.86%) Microsoft Project
5 6 (0.86%) Trello
6 4 (0.57%) Spreadsheet
7 3 (0.43%) AutoCAD
7 3 (0.43%) InVision
7 3 (0.43%) Sketch
8 2 (0.29%) EPLAN
8 2 (0.29%) Simulink
8 2 (0.29%) Stateflow
Business Applications
1 13 (1.86%) SAP S/4HANA
2 9 (1.29%) SAP SD
3 8 (1.15%) Salesforce CRM
4 6 (0.86%) SAP ERP
5 5 (0.72%) SAP MM
6 4 (0.57%) Primavera
6 4 (0.57%) Shopify
7 3 (0.43%) SAP APO
7 3 (0.43%) SAP PP
7 3 (0.43%) SAP WM
8 1 (0.14%) SAP SCM
Cloud Services
1 100 (14.33%) AWS
2 89 (12.75%) Azure
3 54 (7.74%) Power Platform
4 44 (6.30%) GitHub
5 39 (5.59%) Amazon S3
6 34 (4.87%) Figma
7 30 (4.30%) Cloud Computing
7 30 (4.30%) SurveyMonkey
8 29 (4.15%) GCP
9 23 (3.30%) Serverless
10 21 (3.01%) AWS Lambda
10 21 (3.01%) SaaS
11 18 (2.58%) Microsoft 365
12 15 (2.15%) PowerApps
13 14 (2.01%) IaaS
13 14 (2.01%) PaaS
14 12 (1.72%) Power Automate
15 11 (1.58%) OneDrive
15 11 (1.58%) ShareGate
16 7 (1.00%) Azure Functions
Communications & Networking
1 27 (3.87%) 5G
1 27 (3.87%) Broadband
2 20 (2.87%) TCP/IP
3 19 (2.72%) HTTP
4 11 (1.58%) Internet
4 11 (1.58%) MQTT
5 10 (1.43%) Ethernet
5 10 (1.43%) Network Security
5 10 (1.43%) Wireless
6 9 (1.29%) Firewall
7 4 (0.57%) 4G
7 4 (0.57%) RS-232
7 4 (0.57%) SAN
7 4 (0.57%) WebEx
8 3 (0.43%) Intranet
8 3 (0.43%) LAN
8 3 (0.43%) VPN
8 3 (0.43%) WAN
9 2 (0.29%) DNS
9 2 (0.29%) SNMP
Database & Business Intelligence
1 53 (7.59%) Power BI
2 51 (7.31%) NoSQL
3 36 (5.16%) Big Data
4 31 (4.44%) Elasticsearch
5 30 (4.30%) Apache Cassandra
6 29 (4.15%) Relational Database
7 26 (3.72%) Tableau
8 22 (3.15%) SQL Server
9 17 (2.44%) PostgreSQL
10 16 (2.29%) Data Mining
11 15 (2.15%) Data Warehouse
12 13 (1.86%) MySQL
13 11 (1.58%) GIS
14 10 (1.43%) DynamoDB
15 9 (1.29%) Hadoop
16 7 (1.00%) Amazon RDS
16 7 (1.00%) Data Lake
16 7 (1.00%) Redis
16 7 (1.00%) Snowflake Schema
17 6 (0.86%) Star Schema
Development Applications
1 45 (6.45%) Git
2 39 (5.59%) Jenkins
3 29 (4.15%) Jasmine
3 29 (4.15%) JUnit
3 29 (4.15%) Mockito
4 23 (3.30%) JIRA
5 9 (1.29%) GitLab
6 6 (0.86%) Subversion
7 4 (0.57%) CMake
7 4 (0.57%) Team Foundation Server
8 3 (0.43%) Babel
8 3 (0.43%) Bitbucket
8 3 (0.43%) SonarQube
8 3 (0.43%) TestRail
8 3 (0.43%) webpack
9 2 (0.29%) ERwin
10 1 (0.14%) Cypress.io
10 1 (0.14%) GoogleTest
10 1 (0.14%) SQL Server Management Studio (SSMS)
10 1 (0.14%) WebDriver
General
1 274 (39.26%) Social Skills
2 202 (28.94%) Finance
3 147 (21.06%) Inclusion and Diversity
4 137 (19.63%) Marketing
5 120 (17.19%) Analytical Skills
6 106 (15.19%) Law
7 43 (6.16%) Manufacturing
8 41 (5.87%) Pharmaceutical
9 34 (4.87%) Legal
10 32 (4.58%) Social Science
11 29 (4.15%) Electronics
12 26 (3.72%) Telecoms
13 21 (3.01%) Automotive
14 20 (2.87%) Retail
15 18 (2.58%) Banking
16 13 (1.86%) Aerospace
17 12 (1.72%) Investment Banking
18 11 (1.58%) Public Sector
19 10 (1.43%) Presentation Skills
20 8 (1.15%) Organisational Skills
Job Titles
1 155 (22.21%) Senior
2 132 (18.91%) Software Engineer
3 68 (9.74%) Developer
4 62 (8.88%) Lead
5 44 (6.30%) Analyst
6 42 (6.02%) Systems Engineer
7 37 (5.30%) Senior Software Engineer
8 36 (5.16%) Principal Engineer
9 33 (4.73%) Architect
10 31 (4.44%) Principal Systems Engineer
11 24 (3.44%) Embedded Engineer
12 23 (3.30%) Data Scientist
12 23 (3.30%) Senior Analyst
12 23 (3.30%) Software Developer
13 21 (3.01%) Embedded Software Engineer
14 20 (2.87%) Graduate
15 19 (2.72%) Senior Data Scientist
15 19 (2.72%) Senior Developer
16 17 (2.44%) IT Manager
17 16 (2.29%) Data Engineer
Libraries, Frameworks & Software Standards
1 72 (10.32%) AngularJS
2 58 (8.31%) React
3 45 (6.45%) Kafka
4 37 (5.30%) Web Services
5 34 (4.87%) .NET
6 31 (4.44%) GraphQL
7 30 (4.30%) RESTful
8 29 (4.15%) Hibernate
8 29 (4.15%) J2EE
8 29 (4.15%) Spring
8 29 (4.15%) Spring Integration
9 25 (3.58%) HTML
10 19 (2.72%) CSS
11 16 (2.29%) Node.js
12 12 (1.72%) Flask
13 11 (1.58%) HTML5
13 11 (1.58%) RabbitMQ
13 11 (1.58%) Vue
14 9 (1.29%) .NET Framework
14 9 (1.29%) ASP.NET
Miscellaneous
1 109 (15.62%) Algorithms
2 46 (6.59%) Cloud Native
3 42 (6.02%) Product Ownership
4 33 (4.73%) Management Information System
5 32 (4.58%) IoT
6 28 (4.01%) Market Risk
7 22 (3.15%) Onboarding
8 17 (2.44%) Embedded Systems
9 15 (2.15%) Data Structures
10 13 (1.86%) Data Protection Act
11 12 (1.72%) Distributed Systems
11 12 (1.72%) Self-Motivation
12 10 (1.43%) Security Operations Centre
13 9 (1.29%) CUDA
13 9 (1.29%) Taxonomies
14 8 (1.15%) Analytical Mindset
14 8 (1.15%) Data Centre
14 8 (1.15%) FMCG
14 8 (1.15%) FPGA
14 8 (1.15%) Public Cloud
Operating Systems
1 96 (13.75%) Linux
2 41 (5.87%) Unix
3 35 (5.01%) Windows
4 6 (0.86%) FreeRTOS
5 5 (0.72%) Embedded Linux
6 4 (0.57%) Red Hat Enterprise Linux
6 4 (0.57%) Ubuntu
7 3 (0.43%) Windows Server
8 2 (0.29%) VMS
9 1 (0.14%) Android
9 1 (0.14%) Windows 10
9 1 (0.14%) Windows Server 2019
Processes & Methodologies
1 325 (46.56%) Computer Science
2 229 (32.81%) Problem-Solving
3 186 (26.65%) Software Engineering
4 170 (24.36%) Agile
5 119 (17.05%) Mathematics
6 113 (16.19%) Analytics
7 106 (15.19%) Project Management
8 104 (14.90%) Artificial Intelligence
9 102 (14.61%) Roadmaps
10 101 (14.47%) Machine Learning
11 89 (12.75%) Decision-Making
12 81 (11.60%) SDLC
13 80 (11.46%) Data Analysis
14 78 (11.17%) DevOps
15 72 (10.32%) Business Intelligence
15 72 (10.32%) Business Strategy
15 72 (10.32%) Continuous Improvement
15 72 (10.32%) User Experience
16 70 (10.03%) CI/CD
17 69 (9.89%) Cybersecurity
Programming Languages
1 223 (31.95%) Python
2 128 (18.34%) SQL
3 72 (10.32%) C
4 69 (9.89%) JavaScript
5 63 (9.03%) C++
6 61 (8.74%) Java
7 58 (8.31%) C#
8 49 (7.02%) R
9 45 (6.45%) Fortran
10 44 (6.30%) Bash
11 25 (3.58%) TypeScript
12 20 (2.87%) MATLAB
13 10 (1.43%) Rust
14 9 (1.29%) Go
14 9 (1.29%) PowerShell
15 7 (1.00%) PHP
15 7 (1.00%) T-SQL
16 5 (0.72%) ABAP
16 5 (0.72%) C-shell
17 4 (0.57%) Shell Script
Qualifications
1 698 (100.00%) Degree
2 188 (26.93%) PhD
3 176 (25.21%) Computer Science Degree
4 86 (12.32%) MBA
5 77 (11.03%) Security Cleared
6 38 (5.44%) Chartered Engineer
7 19 (2.72%) AWS Certification
8 17 (2.44%) CISSP
8 17 (2.44%) SC Cleared
9 13 (1.86%) BPSS Clearance
9 13 (1.86%) Numerate Degree
10 12 (1.72%) Cisco Certification
11 11 (1.58%) ITIL Certification
12 10 (1.43%) CompTIA CySA+
13 9 (1.29%) DV Cleared
14 7 (1.00%) Azure Certification
14 7 (1.00%) DBS Check
14 7 (1.00%) PMP
15 6 (0.86%) AWS Certified Solutions Architect
15 6 (0.86%) PMI Certification
Quality Assurance & Compliance
1 44 (6.30%) QA
2 37 (5.30%) GDPR
3 30 (4.30%) Data Quality
4 18 (2.58%) Accessibility
5 14 (2.01%) PCI DSS
6 13 (1.86%) NIST
7 12 (1.72%) HIPAA
8 11 (1.58%) California Consumer Privacy Act
9 10 (1.43%) ISO/IEC 27001
9 10 (1.43%) PMO
10 6 (0.86%) ISO 13485
11 5 (0.72%) SLA
12 3 (0.43%) ISO 26262
12 3 (0.43%) WCAG
13 2 (0.29%) Cyber Essentials
13 2 (0.29%) FedRAMP
13 2 (0.29%) GLP
13 2 (0.29%) Good Clinical Practice
13 2 (0.29%) PMBOK
13 2 (0.29%) Sarbanes-Oxley
System Software
1 34 (4.87%) Docker
2 22 (3.15%) Firmware
3 13 (1.86%) Active Directory
4 7 (1.00%) Embedded Firmware
5 3 (0.43%) Hyper-V
6 2 (0.29%) HDFS
6 2 (0.29%) VMware Infrastructure
7 1 (0.14%) Microsoft Virtual Server
7 1 (0.14%) Snort
7 1 (0.14%) Terminal Server
7 1 (0.14%) Virtual Servers
7 1 (0.14%) VMware ESXi
Systems Management
1 55 (7.88%) Kubernetes
2 16 (2.29%) Terraform
3 9 (1.29%) Ansible
3 9 (1.29%) CASB
4 1 (0.14%) EMC NetWorker
4 1 (0.14%) Functional Safety
4 1 (0.14%) SCCM
Vendors
1 104 (14.90%) Microsoft
2 38 (5.44%) EMC
3 36 (5.16%) SAP
4 33 (4.73%) Oracle
5 30 (4.30%) Qualtrics
6 27 (3.87%) Google
6 27 (3.87%) Virgin Media
7 16 (2.29%) Databricks
8 13 (1.86%) Salesforce
9 11 (1.58%) Nintex
10 10 (1.43%) Atlassian
11 8 (1.15%) CA
11 8 (1.15%) MuleSoft
12 3 (0.43%) ANSYS
12 3 (0.43%) Cisco
12 3 (0.43%) Cloudera
12 3 (0.43%) Coverity
12 3 (0.43%) HP
13 2 (0.29%) Palantir
13 2 (0.29%) Salesforce Marketing Cloud