Advertising Jobs in the UK excluding London

Advertising
UK > UK excluding London

The table below looks at the prevalence of the term Advertising in permanent job vacancies in the UK excluding London. Included is a benchmarking guide to the salaries offered in vacancies that cited Advertising over the 6 months leading up to 30 May 2025, comparing them to the same period in the previous two years.

6 months to
30 May 2025
Same period 2024 Same period 2023
Rank 298 339 487
Rank change year-on-year +41 +148 -188
Permanent jobs citing Advertising 332 549 281
As % of all permanent jobs advertised in the UK excluding London 0.84% 0.74% 0.48%
As % of the General category 1.24% 1.31% 0.71%
Number of salaries quoted 207 405 251
10th Percentile £27,434 £21,250 £26,250
25th Percentile £32,750 £28,500 £32,035
Median annual salary (50th Percentile) £47,500 £42,500 £45,000
Median % change year-on-year +11.76% -5.56% -
75th Percentile £67,500 £56,250 £57,931
90th Percentile £72,500 £65,000 £71,250
UK median annual salary £53,500 £47,500 £52,250
% change year-on-year +12.63% -9.09% -9.13%

All General Skills
UK excluding London

Advertising falls under the General Skills category. For comparison with the information above, the following table provides summary statistics for all permanent job vacancies requiring common skills in the UK excluding London.

Permanent vacancies with a requirement for common skills 26,671 41,817 39,575
As % of all permanent jobs advertised in the UK excluding London 67.73% 56.08% 68.21%
Number of salaries quoted 11,889 26,883 18,174
10th Percentile £25,087 £26,000 £28,500
25th Percentile £32,500 £32,500 £37,500
Median annual salary (50th Percentile) £50,000 £47,500 £52,500
Median % change year-on-year +5.26% -9.52% +5.00%
75th Percentile £64,100 £62,200 £67,500
90th Percentile £77,500 £75,000 £81,250
UK median annual salary £55,000 £52,500 £60,000
% change year-on-year +4.76% -12.50% -

Advertising
Job Vacancy Trend in the UK excluding London

Job postings citing Advertising as a proportion of all IT jobs advertised in the UK excluding London.
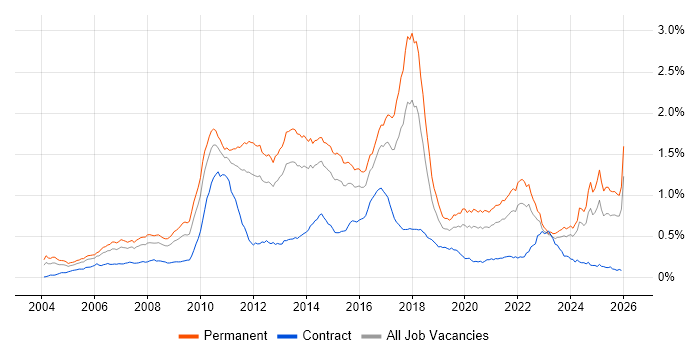
Job vacancy trend for Advertising in the UK excluding London

Advertising
Salary Trend in the UK excluding London

3-month moving average salary quoted in jobs citing Advertising in the UK excluding London.

Salary trend for Advertising in the UK excluding London

Advertising
Salary Histogram in the UK excluding London

Salary distribution for jobs citing Advertising in the UK excluding London over the 6 months to 30 May 2025.

Salary histogram for Advertising in the UK excluding London

Advertising
Job Locations in the UK excluding London

The table below looks at the demand and provides a guide to the median salaries quoted in IT jobs citing Advertising within the UK excluding London region over the 6 months to 30 May 2025. The 'Rank Change' column provides an indication of the change in demand within each location based on the same 6 month period last year.

Location Rank Change
on Same Period
Last Year
Matching
Permanent
IT Job Ads
Median Salary
Past 6 Months
Median Salary
% Change
on Same Period
Last Year
Live
Jobs
South East +9 120 £50,000 +2.04% 709
North of England 0 72 £45,750 +7.65% 544
East of England +70 51 £44,000 +1.15% 336
Midlands +60 43 £56,250 +40.63% 433
West Midlands +58 38 £60,000 +50.00% 234
North West -61 26 £27,000 -36.47% 266
North East +60 25 £54,500 +28.24% 72
South West +44 23 £43,250 +23.57% 281
Yorkshire +61 21 £42,500 +30.77% 209
Scotland +119 14 £53,750 +65.38% 116
Northern Ireland - 7 £67,500 - 46
East Midlands +20 4 £45,000 +28.57% 171
Wales +36 2 - - 73
Advertising
UK

Advertising
Co-occurring Skills and Capabilities in the UK excluding London by Category

The follow tables expand on the table above by listing co-occurrences grouped by category. The same employment type, locality and period is covered with up to 20 co-occurrences shown in each of the following categories:

Application Platforms
1 17 (5.12%) CMS
2 10 (3.01%) IIS
2 10 (3.01%) Microsoft Exchange
3 7 (2.11%) SharePoint
4 6 (1.81%) WordPress
5 4 (1.20%) Apache
5 4 (1.20%) Apache Spark
5 4 (1.20%) Drupal
6 3 (0.90%) Exchange Server 2013
6 3 (0.90%) Skype for Business
6 3 (0.90%) Umbraco
6 3 (0.90%) WinCC
7 2 (0.60%) Blackberry Enterprise Server
7 2 (0.60%) Confluence
8 1 (0.30%) Office Communications Server
8 1 (0.30%) SharePoint 2010
Applications
1 21 (6.33%) Microsoft Excel
2 11 (3.31%) Microsoft Office
3 10 (3.01%) Photoshop
4 6 (1.81%) Adobe Creative Suite
5 5 (1.51%) Adobe Premiere
6 4 (1.20%) Adobe Illustrator
6 4 (1.20%) InDesign
6 4 (1.20%) Simulink
7 3 (0.90%) MS Visio
7 3 (0.90%) ProjectWise
8 1 (0.30%) 3ds Max
8 1 (0.30%) Adobe After Effects
8 1 (0.30%) Blender
8 1 (0.30%) CINEMA 4D
8 1 (0.30%) Microsoft PowerPoint
8 1 (0.30%) Sketch
Business Applications
1 11 (3.31%) Shopify
2 4 (1.20%) Magento
3 3 (0.90%) Dynamics CRM
Cloud Services
1 40 (12.05%) Google Analytics
2 38 (11.45%) Azure
3 29 (8.73%) Google Ads
4 22 (6.63%) Power Platform
5 19 (5.72%) Facebook Ads
6 15 (4.52%) Microsoft 365
7 13 (3.92%) AWS
8 8 (2.41%) SaaS
9 7 (2.11%) Azure DevOps
9 7 (2.11%) GCP
9 7 (2.11%) MailChimp
10 6 (1.81%) Google Sheets
10 6 (1.81%) PaaS
11 5 (1.51%) GitHub
11 5 (1.51%) Google Data Studio
12 4 (1.20%) Azure Data Factory
12 4 (1.20%) Canva
12 4 (1.20%) IaaS
12 4 (1.20%) Microsoft Advertising
13 3 (0.90%) Amazon Ads
Communications & Networking
1 16 (4.82%) WAN
2 8 (2.41%) SAN
3 7 (2.11%) BGP
3 7 (2.11%) Firewall
4 6 (1.81%) SD-WAN
5 5 (1.51%) EIGRP
5 5 (1.51%) OSPF
6 4 (1.20%) DNS
6 4 (1.20%) Network Security
7 3 (0.90%) Ethernet
7 3 (0.90%) Profibus
7 3 (0.90%) SMTP
8 2 (0.60%) DHCP
8 2 (0.60%) IMAP
8 2 (0.60%) Internet
8 2 (0.60%) IPsec
8 2 (0.60%) Junos
8 2 (0.60%) MPLS
8 2 (0.60%) MQTT
8 2 (0.60%) Skype
Database & Business Intelligence
1 36 (10.84%) Big Data
2 23 (6.93%) SQL Server
3 21 (6.33%) Power BI
4 11 (3.31%) GIS
5 8 (2.41%) PostgreSQL
6 7 (2.11%) Looker
7 6 (1.81%) Tableau
8 5 (1.51%) BigQuery
8 5 (1.51%) Hadoop
8 5 (1.51%) NoSQL
9 4 (1.20%) Apache Cassandra
9 4 (1.20%) Data Lake
9 4 (1.20%) Data Warehouse
9 4 (1.20%) DB2
9 4 (1.20%) MongoDB
10 3 (0.90%) Azure SQL Database
10 3 (0.90%) MySQL
10 3 (0.90%) RDBMS
10 3 (0.90%) Relational Database
10 3 (0.90%) SQL Server Integration Services
Development Applications
1 10 (3.01%) JIRA
2 7 (2.11%) Git
3 5 (1.51%) Bitbucket
4 4 (1.20%) Jenkins
4 4 (1.20%) Octopus Deploy
5 3 (0.90%) MSI
5 3 (0.90%) Visual Studio
5 3 (0.90%) Visual Studio Code
5 3 (0.90%) Vite
6 2 (0.60%) ER Studio
6 2 (0.60%) ERwin
6 2 (0.60%) PowerDesigner
6 2 (0.60%) TeamCity
7 1 (0.30%) Artifactory
7 1 (0.30%) GitLab
7 1 (0.30%) LabVIEW
7 1 (0.30%) Liquibase
7 1 (0.30%) PHPUnit
7 1 (0.30%) Selenium
7 1 (0.30%) SonarQube
General
1 159 (47.89%) Marketing
2 132 (39.76%) Social Skills
3 89 (26.81%) Analytical Skills
4 80 (24.10%) Finance
5 25 (7.53%) Law
6 19 (5.72%) Retail
7 18 (5.42%) Manufacturing
8 17 (5.12%) Games
9 16 (4.82%) Organisational Skills
10 13 (3.92%) Legal
11 12 (3.61%) Presentation Skills
12 10 (3.01%) Brand Awareness
12 10 (3.01%) Inclusion and Diversity
13 8 (2.41%) Electronics
14 6 (1.81%) Automotive
14 6 (1.81%) Banking
15 4 (1.20%) Health Technology
16 3 (0.90%) Back Office
16 3 (0.90%) Documentation Skills
16 3 (0.90%) Tech for Good
Job Titles
1 56 (16.87%) Account Manager
2 54 (16.27%) Senior
3 40 (12.05%) Senior Manager
4 34 (10.24%) Senior Account Manager
5 26 (7.83%) Developer
6 22 (6.63%) Analyst
7 20 (6.02%) Strategic Account Manager
8 16 (4.82%) Architect
9 13 (3.92%) Support Engineer
10 12 (3.61%) Marketing Manager
11 9 (2.71%) Systems Engineer
12 8 (2.41%) E-Commerce Executive
12 8 (2.41%) IT Manager
12 8 (2.41%) Lead
12 8 (2.41%) Marketing Executive
12 8 (2.41%) Network Engineer
12 8 (2.41%) Sales Manager
12 8 (2.41%) Software Engineer
13 7 (2.11%) Cloud Engineer
13 7 (2.11%) Control Systems Engineer
Libraries, Frameworks & Software Standards
1 13 (3.92%) React
2 9 (2.71%) .NET
2 9 (2.71%) CSS
3 8 (2.41%) HTML
4 5 (1.51%) WebSockets
5 4 (1.20%) AngularJS
5 4 (1.20%) Kafka
5 4 (1.20%) RabbitMQ
5 4 (1.20%) REST
5 4 (1.20%) Spring
5 4 (1.20%) Spring Boot
6 3 (0.90%) .NET Core
6 3 (0.90%) .NET Framework
6 3 (0.90%) Elastic Stack
6 3 (0.90%) Next.js
6 3 (0.90%) Sass
6 3 (0.90%) SignalR
7 2 (0.60%) FIX Protocol
7 2 (0.60%) jQuery
7 2 (0.60%) Middleware
Miscellaneous
1 52 (15.66%) Digital Media
1 52 (15.66%) Marketing Technology
2 43 (12.95%) Social Media
3 21 (6.33%) Product Ownership
4 10 (3.01%) Blog
5 9 (2.71%) Self-Motivation
6 8 (2.41%) Graphic Design
7 7 (2.11%) SCADA
8 6 (1.81%) Management Information System
9 5 (1.51%) Analytical Mindset
9 5 (1.51%) Onboarding
9 5 (1.51%) Social Network
10 4 (1.20%) Driving Licence
10 4 (1.20%) FMCG
10 4 (1.20%) Hedge funds
10 4 (1.20%) Motion Graphics
11 3 (0.90%) Clustering
11 3 (0.90%) Derivative
11 3 (0.90%) Fibre Optics
12 2 (0.60%) Renewable Energy
Operating Systems
1 26 (7.83%) Windows
2 9 (2.71%) Windows Server
3 8 (2.41%) Linux
4 2 (0.60%) Unix
4 2 (0.60%) Windows 10
5 1 (0.30%) Android
5 1 (0.30%) Apple iOS
Processes & Methodologies
1 111 (33.43%) Digital Marketing
2 68 (20.48%) Analytics
3 66 (19.88%) Collaborative Working
4 65 (19.58%) Project Management
5 60 (18.07%) Strategic Thinking
6 59 (17.77%) Marketing Strategy
6 59 (17.77%) Problem-Solving
7 46 (13.86%) Time Management
8 45 (13.55%) Customer Retention
9 44 (13.25%) SEO
10 43 (12.95%) Artificial Intelligence
11 39 (11.75%) Mentoring
11 39 (11.75%) Pay per click
12 38 (11.45%) Process Improvement
13 32 (9.64%) Analytical Thinking
13 32 (9.64%) Continuous Improvement
14 31 (9.34%) Computer Science
15 30 (9.04%) Epics
16 27 (8.13%) Digital Strategy
16 27 (8.13%) User Experience
Programming Languages
1 30 (9.04%) SQL
2 19 (5.72%) Python
3 18 (5.42%) PowerShell
4 17 (5.12%) Java
5 13 (3.92%) JavaScript
6 11 (3.31%) TypeScript
7 9 (2.71%) C#
8 4 (1.20%) MATLAB
8 4 (1.20%) PL/SQL
8 4 (1.20%) Shell Script
9 3 (0.90%) Data Analysis Expressions
10 2 (0.60%) PHP
10 2 (0.60%) SQR
10 2 (0.60%) T-SQL
10 2 (0.60%) VB.NET
11 1 (0.30%) Bash
11 1 (0.30%) C
11 1 (0.30%) C++
11 1 (0.30%) Go
11 1 (0.30%) Groovy
Qualifications
1 72 (21.69%) Degree
2 28 (8.43%) Security Cleared
3 21 (6.33%) SC Cleared
4 17 (5.12%) Computer Science Degree
5 11 (3.31%) DV Cleared
6 6 (1.81%) Master's Degree
7 5 (1.51%) Azure Certification
7 5 (1.51%) DBS Check
8 4 (1.20%) CCNA
8 4 (1.20%) CCNP
8 4 (1.20%) Cisco Certification
9 3 (0.90%) HNC
9 3 (0.90%) Microsoft Certification
10 2 (0.60%) BPSS Clearance
10 2 (0.60%) JNCIS
11 1 (0.30%) AWS Certification
11 1 (0.30%) CCIE
11 1 (0.30%) Microsoft Certified Master
11 1 (0.30%) PhD
11 1 (0.30%) Postgraduate
Quality Assurance & Compliance
1 10 (3.01%) Data Quality
2 7 (2.11%) GDPR
3 5 (1.51%) Accessibility
4 3 (0.90%) PCI DSS
5 2 (0.60%) ISO/IEC 27001
5 2 (0.60%) QA
6 1 (0.30%) California Consumer Privacy Act
6 1 (0.30%) Cyber Essentials
6 1 (0.30%) Cyber Essentials PLUS
6 1 (0.30%) DO-254
6 1 (0.30%) ISO 9000
6 1 (0.30%) PMO
System Software
1 16 (4.82%) Active Directory
2 8 (2.41%) Docker
3 6 (1.81%) Hyper-V
3 6 (1.81%) VMware Infrastructure
4 2 (0.60%) Virtual Machines
5 1 (0.30%) Firmware
5 1 (0.30%) ISA Server
Systems Management
1 11 (3.31%) Terraform
2 8 (2.41%) Ansible
3 7 (2.11%) Kubernetes
4 3 (0.90%) Grafana
4 3 (0.90%) WMI
5 2 (0.60%) Control-M
5 2 (0.60%) Docker Swarm
5 2 (0.60%) Prometheus
5 2 (0.60%) SCCM
5 2 (0.60%) SCOM
5 2 (0.60%) SCSM
6 1 (0.30%) FortiGate
6 1 (0.30%) Kibana
6 1 (0.30%) Microsoft Intune
6 1 (0.30%) Nessus
6 1 (0.30%) WSUS
Vendors
1 60 (18.07%) Google
2 57 (17.17%) Microsoft
3 27 (8.13%) Facebook
4 18 (5.42%) VMware
5 13 (3.92%) Cisco
5 13 (3.92%) Instagram
6 9 (2.71%) Salesforce
7 8 (2.41%) Adobe
7 8 (2.41%) Oracle
7 8 (2.41%) Siemens
8 6 (1.81%) Juniper
8 6 (1.81%) TikTok
9 5 (1.51%) Allen-Bradley
9 5 (1.51%) Fortinet
9 5 (1.51%) YouTube
10 4 (1.20%) Databricks
10 4 (1.20%) Nimble Storage
10 4 (1.20%) Pinterest
10 4 (1.20%) Talend
10 4 (1.20%) WooCommerce