Algorithms Jobs in the UK excluding London

Algorithms
UK > UK excluding London

The table below looks at the prevalence of the term Algorithms in permanent job vacancies in the UK excluding London. Included is a benchmarking guide to the salaries offered in vacancies that cited Algorithms over the 6 months leading up to 26 July 2024, comparing them to the same period in the previous two years.

6 months to
26 Jul 2024
Same period 2023 Same period 2022
Rank 117 211 172
Rank change year-on-year +94 -39 +53
Permanent jobs citing Algorithms 1,382 822 1,716
As % of all permanent jobs advertised in the UK excluding London 2.12% 1.71% 2.19%
As % of the Miscellaneous category 6.83% 4.27% 5.03%
Number of salaries quoted 381 304 445
10th Percentile £38,620 £36,250 £38,850
25th Percentile £47,250 £46,250 £46,500
Median annual salary (50th Percentile) £60,000 £60,000 £65,000
Median % change year-on-year - -7.69% +18.18%
75th Percentile £72,500 £75,625 £75,000
90th Percentile £85,000 £89,852 £82,000
UK median annual salary £65,000 £70,000 £75,000
% change year-on-year -7.14% -6.67% +15.38%

All Generic Skills
UK excluding London

Algorithms falls under the General and Transferable Skills category. For comparison with the information above, the following table provides summary statistics for all permanent job vacancies requiring generic IT skills in the UK excluding London.

Permanent vacancies with a requirement for generic IT skills 20,220 19,230 34,139
As % of all permanent jobs advertised in the UK excluding London 30.98% 39.94% 43.59%
Number of salaries quoted 11,541 10,409 17,070
10th Percentile £27,500 £31,250 £30,000
25th Percentile £36,250 £40,625 £40,000
Median annual salary (50th Percentile) £50,000 £55,000 £52,500
Median % change year-on-year -9.09% +4.76% +5.00%
75th Percentile £65,000 £70,000 £69,375
90th Percentile £80,000 £85,000 £82,970
UK median annual salary £55,000 £64,000 £62,500
% change year-on-year -14.06% +2.40% +4.17%

Algorithms
Job Vacancy Trend in the UK excluding London

Job postings citing Algorithms as a proportion of all IT jobs advertised in the UK excluding London.
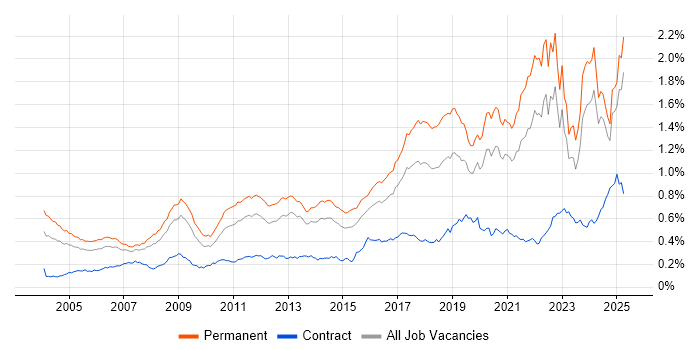
Job vacancy trend for Algorithms in the UK excluding London

Algorithms
Salary Trend in the UK excluding London

3-month moving average salary quoted in jobs citing Algorithms in the UK excluding London.

Salary trend for Algorithms in the UK excluding London

Algorithms
Salary Histogram in the UK excluding London

Salary distribution for jobs citing Algorithms in the UK excluding London over the 6 months to 26 July 2024.

Salary histogram for Algorithms in the UK excluding London

Algorithms
Job Locations in the UK excluding London

The table below looks at the demand and provides a guide to the median salaries quoted in IT jobs citing Algorithms within the UK excluding London region over the 6 months to 26 July 2024. The 'Rank Change' column provides an indication of the change in demand within each location based on the same 6 month period last year.

Location Rank Change
on Same Period
Last Year
Matching
Permanent
IT Job Ads
Median Salary
Past 6 Months
Median Salary
% Change
on Same Period
Last Year
Live
Jobs
Scotland +117 596 £65,000 +30.00% 3
South East +84 347 £60,000 -2.76% 46
North of England -65 141 £55,000 -12.00% 26
Midlands -23 129 £60,000 +14.29% 19
North West -40 126 £60,000 -2.04% 16
South West -11 88 £55,000 -12.00% 16
East Midlands +32 80 £60,000 +26.32% 6
East of England -19 73 £63,750 -1.92% 24
West Midlands -61 49 £60,000 - 13
Yorkshire +4 14 £50,000 -16.67% 4
Wales +33 6 £55,000 +53.85%
Northern Ireland - 2 £58,750 - 10
North East -16 1 £105,000 +61.54% 6
Algorithms
UK

Algorithms
Co-occurring Skills and Capabilities in the UK excluding London by Category

The follow tables expand on the table above by listing co-occurrences grouped by category. The same employment type, locality and period is covered with up to 20 co-occurrences shown in each of the following categories:

Application Platforms
1 124 (8.97%) Apache Spark
2 39 (2.82%) Apache
3 21 (1.52%) FileNet
4 6 (0.43%) SAS
5 3 (0.22%) Apache Airflow
5 3 (0.22%) Confluence
5 3 (0.22%) OpenStack
6 2 (0.14%) Luigi
6 2 (0.14%) Tomcat
7 1 (0.072%) CMS
7 1 (0.072%) Ethereum
7 1 (0.072%) Hyperledger
Applications
1 65 (4.70%) Simulink
2 27 (1.95%) Stateflow
3 10 (0.72%) GNU Octave
4 8 (0.58%) Microsoft Office
5 7 (0.51%) Microsoft Excel
6 4 (0.29%) Spreadsheet
7 2 (0.14%) Microsoft PowerPoint
8 1 (0.072%) Revit
Business Applications
1 3 (0.22%) ProductWriter
2 1 (0.072%) Distributed Ledger
2 1 (0.072%) Infor M3
2 1 (0.072%) SAP S/4HANA
Cloud Services
1 351 (25.40%) Azure
2 333 (24.10%) AWS
3 231 (16.71%) IBM Cloud
4 158 (11.43%) Serverless
5 122 (8.83%) Azure Functions
6 118 (8.54%) Azure DevOps
7 115 (8.32%) Azure API Management
7 115 (8.32%) Azure Logic Apps
7 115 (8.32%) Azure Service Bus
8 70 (5.07%) GCP
9 47 (3.40%) Amazon ECS
10 38 (2.75%) AWS Lambda
11 35 (2.53%) Cloud Computing
12 34 (2.46%) Datadog
13 33 (2.39%) Amazon EC2
13 33 (2.39%) Amazon SQS
14 32 (2.32%) Amazon EKS
15 29 (2.10%) Amazon EMR
16 26 (1.88%) Amazon S3
17 25 (1.81%) Google Play
Communications & Networking
1 12 (0.87%) OFDM
2 11 (0.80%) Ethernet
3 9 (0.65%) Wireless
4 8 (0.58%) Firewall
4 8 (0.58%) J1939
5 7 (0.51%) HTTP
5 7 (0.51%) LAN
5 7 (0.51%) Network Security
5 7 (0.51%) VLAN
5 7 (0.51%) VPN
5 7 (0.51%) WAN
6 6 (0.43%) Software-Defined Radio
7 5 (0.36%) 5G
7 5 (0.36%) SSL
7 5 (0.36%) TCP/IP
8 4 (0.29%) BGP
8 4 (0.29%) Intrusion Detection
8 4 (0.29%) IPsec
8 4 (0.29%) NGFW
8 4 (0.29%) OSPF
Database & Business Intelligence
1 431 (31.19%) NoSQL
2 244 (17.66%) PostgreSQL
3 236 (17.08%) MongoDB
4 231 (16.71%) DB2
5 192 (13.89%) Relational Database
6 108 (7.81%) Big Data
7 89 (6.44%) Hadoop
8 60 (4.34%) Apache Hive
8 60 (4.34%) HBase
9 53 (3.84%) Data Lake
10 35 (2.53%) Qlik Sense
11 33 (2.39%) Elasticsearch
12 29 (2.10%) Electronic Patient Records
13 26 (1.88%) MySQL
14 25 (1.81%) Data Warehouse
14 25 (1.81%) Power BI
14 25 (1.81%) SQL Server
15 21 (1.52%) Apache Cassandra
16 16 (1.16%) Redis
17 15 (1.09%) RDBMS
Development Applications
1 87 (6.30%) Git
2 84 (6.08%) Jenkins
3 66 (4.78%) JUnit
4 60 (4.34%) Bitbucket Server
5 25 (1.81%) Android Studio
6 24 (1.74%) Cypress.io
7 21 (1.52%) Jasmine
7 21 (1.52%) JIRA
7 21 (1.52%) Karma Test Runner
7 21 (1.52%) Protractor
7 21 (1.52%) Selenium
7 21 (1.52%) WebDriver
8 18 (1.30%) GitLab
9 10 (0.72%) Subversion
10 9 (0.65%) ClearCase
10 9 (0.65%) CMake
11 8 (0.58%) Plastic SCM
12 6 (0.43%) Maven
13 5 (0.36%) ClearQuest
14 4 (0.29%) LabVIEW
General
1 699 (50.58%) Inclusion and Diversity
2 617 (44.65%) Finance
3 572 (41.39%) Law
4 386 (27.93%) Legal
5 242 (17.51%) Public Sector
6 183 (13.24%) Social Skills
7 126 (9.12%) Marketing
8 114 (8.25%) Banking
9 112 (8.10%) Investment Banking
10 89 (6.44%) Analytical Skills
11 60 (4.34%) Electronics
12 34 (2.46%) Automotive
12 34 (2.46%) Manufacturing
13 31 (2.24%) Military
14 19 (1.37%) Organisational Skills
15 18 (1.30%) Retail
15 18 (1.30%) Telecoms
16 15 (1.09%) Aerospace
17 14 (1.01%) Pharmaceutical
18 10 (0.72%) Front Office
Job Titles
1 682 (49.35%) Software Engineer
2 267 (19.32%) Developer
3 218 (15.77%) Full Stack Engineer
4 186 (13.46%) Java Engineer
4 186 (13.46%) Java Software Engineer
5 145 (10.49%) Senior
6 142 (10.27%) AWS Engineer
6 142 (10.27%) AWS Software Engineer
7 126 (9.12%) Full Stack Developer
8 123 (8.90%) Data Engineer
9 122 (8.83%) Azure Developer
10 116 (8.39%) Azure Engineer
11 105 (7.60%) Python Engineer
12 101 (7.31%) Full Stack Software Engineer
13 100 (7.24%) Python Software Engineer
14 80 (5.79%) Big Data Engineer
14 80 (5.79%) Big Data Software Engineer
15 61 (4.41%) Software Developer
16 55 (3.98%) Lead
17 46 (3.33%) Senior Software Engineer
Libraries, Frameworks & Software Standards
1 396 (28.65%) React
2 349 (25.25%) AngularJS
3 331 (23.95%) HTML
4 315 (22.79%) Twitter Bootstrap
5 308 (22.29%) CSS
6 295 (21.35%) jQuery
7 288 (20.84%) Web Services
8 277 (20.04%) .NET
9 248 (17.95%) Vue
10 243 (17.58%) REST
11 235 (17.00%) ASP.NET
12 231 (16.71%) ASP.NET Core
12 231 (16.71%) Backbone.js
12 231 (16.71%) Ember.js
13 218 (15.77%) Node.js
14 155 (11.22%) Spring
15 93 (6.73%) J2EE
16 91 (6.58%) JMS
17 84 (6.08%) Kafka
18 75 (5.43%) Hibernate
Miscellaneous
1 348 (25.18%) Data Structures
2 244 (17.66%) Blockchain
3 235 (17.00%) Hybrid Cloud
4 124 (8.97%) Onboarding
5 116 (8.39%) e-Learning
6 77 (5.57%) Cloud Native
7 41 (2.97%) Embedded Systems
8 32 (2.32%) FPGA
9 26 (1.88%) VHDL
10 22 (1.59%) Distributed Systems
11 21 (1.52%) Legacy Code
11 21 (1.52%) Public Cloud
12 20 (1.45%) Greenfield Project
13 17 (1.23%) Analytical Mindset
14 16 (1.16%) Self-Motivation
15 15 (1.09%) CUDA
16 13 (0.94%) Credit Risk
16 13 (0.94%) Management Information System
17 11 (0.80%) Analogue Electronics
17 11 (0.80%) Reference Data
Operating Systems
1 366 (26.48%) Linux
2 276 (19.97%) Windows
3 263 (19.03%) Android
4 236 (17.08%) Apple iOS
5 127 (9.19%) Unix
6 11 (0.80%) Embedded Linux
7 7 (0.51%) FreeRTOS
8 6 (0.43%) Mac OS
8 6 (0.43%) Windows Server 2019
9 5 (0.36%) Windows Server 2008
9 5 (0.36%) Windows Server 2012
9 5 (0.36%) Windows Server 2016
10 3 (0.22%) Red Hat Enterprise Linux
10 3 (0.22%) SUSE Linux Enterprise Server
10 3 (0.22%) Ubuntu
11 2 (0.14%) VMS
12 1 (0.072%) Windows 10
12 1 (0.072%) Windows Server
Processes & Methodologies
1 807 (58.39%) Artificial Intelligence
2 774 (56.01%) Agile
3 769 (55.64%) Software Engineering
4 585 (42.33%) Machine Learning
4 585 (42.33%) SDLC
5 583 (42.19%) CI/CD
6 559 (40.45%) Visualisation
7 541 (39.15%) Continuous Improvement
8 494 (35.75%) Community of Practice
9 475 (34.37%) Operational Stability
10 361 (26.12%) Risk Management
11 349 (25.25%) Full Stack Development
12 317 (22.94%) OO
13 278 (20.12%) User Experience
14 262 (18.96%) Web Development
15 258 (18.67%) Design Patterns
16 256 (18.52%) MVVM
17 253 (18.31%) OOP
18 236 (17.08%) MVC
19 235 (17.00%) SOLID
Programming Languages
1 628 (45.44%) Python
2 555 (40.16%) SQL
3 545 (39.44%) Java
4 367 (26.56%) JavaScript
5 307 (22.21%) C#
6 182 (13.17%) C++
7 152 (11.00%) C
8 118 (8.54%) MATLAB
9 115 (8.32%) TypeScript
10 86 (6.22%) PL/SQL
11 61 (4.41%) Fortran
12 44 (3.18%) Bash
13 35 (2.53%) Scala
14 29 (2.10%) R
15 25 (1.81%) Kotlin
16 21 (1.52%) Go
17 20 (1.45%) Embedded C
18 18 (1.30%) Haskell
19 12 (0.87%) PHP
20 10 (0.72%) Rust
Qualifications
1 278 (20.12%) Degree
2 181 (13.10%) Security Cleared
3 113 (8.18%) PhD
4 109 (7.89%) Master's Degree
5 70 (5.07%) Computer Science Degree
6 56 (4.05%) SC Cleared
7 30 (2.17%) DV Cleared
8 25 (1.81%) BPSS Clearance
9 14 (1.01%) Numerate Degree
10 9 (0.65%) Cisco Certification
11 7 (0.51%) DBS Check
11 7 (0.51%) HND
12 5 (0.36%) CCNA
12 5 (0.36%) MBA
13 4 (0.29%) CCIE
13 4 (0.29%) JNCIE
14 3 (0.22%) Network+ Certification
15 2 (0.14%) AWS Certification
15 2 (0.14%) Azure Certification
15 2 (0.14%) CompTIA Security+
Quality Assurance & Compliance
1 18 (1.30%) Data Quality
2 16 (1.16%) GDPR
3 12 (0.87%) ISO 26262
4 10 (0.72%) AUTOSAR
4 10 (0.72%) MISRA
5 8 (0.58%) Automotive SPICE
6 7 (0.51%) HIPAA
7 5 (0.36%) QA
8 4 (0.29%) Accessibility
8 4 (0.29%) Actionable Recommendations
9 2 (0.14%) ISO/IEC 12207
9 2 (0.14%) ISO/IEC 15288
9 2 (0.14%) MISRA C
10 1 (0.072%) JTAG
System Software
1 60 (4.34%) HDFS
2 48 (3.47%) Docker
3 21 (1.52%) Firmware
4 11 (0.80%) Active Directory
5 6 (0.43%) Hyper-V
5 6 (0.43%) VMware ESXi
6 5 (0.36%) VMware Infrastructure
7 3 (0.22%) Ceph
7 3 (0.22%) GPFS
7 3 (0.22%) Lustre
7 3 (0.22%) Slurm Workload Manager
8 2 (0.14%) Apache ZooKeeper
8 2 (0.14%) Embedded Firmware
9 1 (0.072%) Microsoft Virtual Server
9 1 (0.072%) Virtual Servers
Systems Management
1 108 (7.81%) Kubernetes
2 87 (6.30%) Terraform
3 34 (2.46%) Grafana
3 34 (2.46%) Prometheus
4 10 (0.72%) Functional Safety
5 6 (0.43%) SCCM
6 5 (0.36%) SCOM
7 4 (0.29%) Ansible
7 4 (0.29%) Tivoli Identity Manager
8 3 (0.22%) Kibana
8 3 (0.22%) Podman
9 1 (0.072%) FTK
9 1 (0.072%) SELinux
Vendors
1 249 (18.02%) IBM
2 231 (16.71%) Red Hat
3 142 (10.27%) Databricks
4 87 (6.30%) Microsoft
5 84 (6.08%) Oracle
6 76 (5.50%) Google
7 63 (4.56%) Informatica
8 41 (2.97%) Alteryx
9 37 (2.68%) Dynatrace
9 37 (2.68%) Splunk
10 30 (2.17%) Cloudera
11 16 (1.16%) Xilinx
12 8 (0.58%) Ahrefs
12 8 (0.58%) Dell
12 8 (0.58%) Lauterbach
12 8 (0.58%) SAP
12 8 (0.58%) Screaming Frog
13 6 (0.43%) Instagram
13 6 (0.43%) Pega
13 6 (0.43%) UiPath