C Jobs in the UK excluding London

C
UK > UK excluding London

The table below provides summary statistics for permanent job vacancies advertised in the UK excluding London requiring C skills. It includes a benchmarking guide to the annual salaries offered in vacancies that cited C over the 6 months leading up to 23 May 2025, comparing them to the same period in the previous two years.

6 months to
23 May 2025
Same period 2024 Same period 2023
Rank 228 102 167
Rank change year-on-year -126 +65 -51
Permanent jobs citing C 484 1,808 1,236
As % of all permanent jobs advertised in the UK excluding London 1.25% 2.52% 2.10%
As % of the Programming Languages category 4.77% 8.04% 5.26%
Number of salaries quoted 347 1,439 669
10th Percentile £42,500 £37,500 £34,324
25th Percentile £47,500 £45,000 £42,500
Median annual salary (50th Percentile) £57,000 £55,000 £60,000
Median % change year-on-year +3.64% -8.33% +14.29%
75th Percentile £67,500 £66,250 £72,500
90th Percentile £77,500 £81,250 £81,250
UK median annual salary £60,000 £55,000 £62,500
% change year-on-year +9.09% -12.00% +8.70%

All Programming Languages
UK excluding London

C falls under the Programming Languages category. For comparison with the information above, the following table provides summary statistics for all permanent job vacancies requiring coding skills in the UK excluding London.

Permanent vacancies with a requirement for coding skills 10,156 22,501 23,499
As % of all permanent jobs advertised in the UK excluding London 26.22% 31.33% 39.96%
Number of salaries quoted 6,570 16,347 13,247
10th Percentile £33,250 £32,500 £35,000
25th Percentile £45,000 £41,250 £42,500
Median annual salary (50th Percentile) £55,000 £54,000 £55,000
Median % change year-on-year +1.85% -1.82% +4.76%
75th Percentile £66,340 £67,500 £71,250
90th Percentile £80,000 £80,000 £84,056
UK median annual salary £60,000 £60,000 £65,000
% change year-on-year - -7.69% +4.00%

C
Job Vacancy Trend in the UK excluding London

Job postings citing C as a proportion of all IT jobs advertised in the UK excluding London.
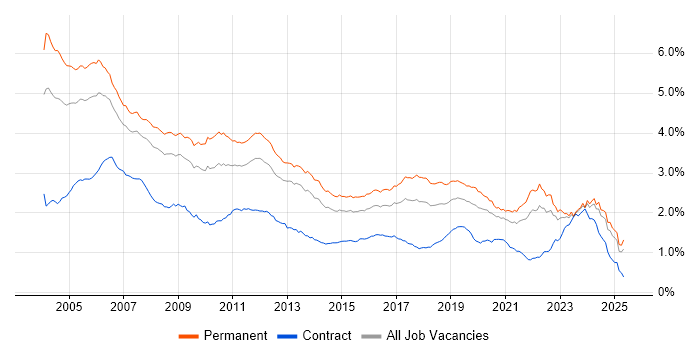
Job vacancy trend for C in the UK excluding London

C
Salary Trend in the UK excluding London

3-month moving average salary quoted in jobs citing C in the UK excluding London.

Salary trend for C in the UK excluding London

C
Salary Histogram in the UK excluding London

Salary distribution for jobs citing C in the UK excluding London over the 6 months to 23 May 2025.

Salary histogram for C in the UK excluding London

C
Job Locations in the UK excluding London

The table below looks at the demand and provides a guide to the median salaries quoted in IT jobs citing C within the UK excluding London region over the 6 months to 23 May 2025. The 'Rank Change' column provides an indication of the change in demand within each location based on the same 6 month period last year.

Location Rank Change
on Same Period
Last Year
Matching
Permanent
IT Job Ads
Median Salary
Past 6 Months
Median Salary
% Change
on Same Period
Last Year
Live
Jobs
South East -77 154 £60,000 +9.09% 633
North of England -88 73 £55,000 - 477
East of England -72 67 £55,000 -8.33% 514
Scotland +6 60 £65,000 +23.81% 222
South West -40 60 £46,500 -19.13% 359
North West -75 50 £57,560 +4.65% 202
Midlands -71 47 £53,750 +2.38% 437
East Midlands -40 24 £52,500 +10.53% 188
West Midlands -21 23 £65,000 +8.33% 226
Wales +10 22 £65,000 +30.00% 87
Yorkshire +1 20 £46,000 -8.00% 195
North East +26 3 £61,000 +1.67% 80
Northern Ireland +28 1 £50,000 -9.09% 46
C
UK

C
Co-occurring Skills and Capabilities in the UK excluding London by Category

The follow tables expand on the table above by listing co-occurrences grouped by category. The same employment type, locality and period is covered with up to 20 co-occurrences shown in each of the following categories:

Application Platforms
1 11 (2.27%) Kinematics
2 3 (0.62%) Apache
2 3 (0.62%) OpenStack
3 1 (0.21%) Apache Airflow
3 1 (0.21%) NetWeaver
3 1 (0.21%) SharePoint
3 1 (0.21%) Tomcat
Applications
1 16 (3.31%) Simulink
2 7 (1.45%) GNU Octave
3 6 (1.24%) Microsoft Office
4 4 (0.83%) SOLIDWORKS
5 2 (0.41%) OrCAD
6 1 (0.21%) CANalyzer
Business Applications
1 1 (0.21%) LabWindows
1 1 (0.21%) Oracle Subledger Accounting
1 1 (0.21%) Sage 200
1 1 (0.21%) Sage 50
1 1 (0.21%) SAP Oil and Gas
Cloud Services
1 23 (4.75%) Azure
2 9 (1.86%) AWS
3 6 (1.24%) GitHub
4 4 (0.83%) Dynamics 365
4 4 (0.83%) Power Platform
4 4 (0.83%) SaaS
5 2 (0.41%) Azure DevOps
5 2 (0.41%) GCP
6 1 (0.21%) AWS IoT
6 1 (0.21%) Datadog
6 1 (0.21%) IaaS
6 1 (0.21%) Microsoft 365
6 1 (0.21%) PaaS
6 1 (0.21%) WhatsApp
Communications & Networking
1 40 (8.26%) Wireless
2 32 (6.61%) TCP/IP
3 31 (6.40%) Modbus
4 15 (3.10%) Bluetooth
5 14 (2.89%) Software-Defined Radio
6 13 (2.69%) Network Security
7 12 (2.48%) MQTT
7 12 (2.48%) RS-232
7 12 (2.48%) RS-485
7 12 (2.48%) ZigBee
8 9 (1.86%) Ethernet
9 8 (1.65%) GSM
9 8 (1.65%) Wi-Fi
10 7 (1.45%) HTTP
10 7 (1.45%) Profibus
10 7 (1.45%) WAN
11 5 (1.03%) HTTPS
12 4 (0.83%) 5G
12 4 (0.83%) SD-WAN
13 3 (0.62%) LTE
Database & Business Intelligence
1 8 (1.65%) PostgreSQL
2 7 (1.45%) SQL Server
3 6 (1.24%) RDBMS
3 6 (1.24%) Relational Database
4 5 (1.03%) MySQL
5 4 (0.83%) SQL Server Integration Services
6 2 (0.41%) Geospatial Data
6 2 (0.41%) GIS
6 2 (0.41%) Metadata
6 2 (0.41%) MongoDB
6 2 (0.41%) Scylla
6 2 (0.41%) SQLite
7 1 (0.21%) Apache Cassandra
7 1 (0.21%) Azure SQL Database
7 1 (0.21%) Big Data
7 1 (0.21%) CockroachDB
7 1 (0.21%) Couchbase
7 1 (0.21%) Redis
7 1 (0.21%) SAP Data Services
7 1 (0.21%) SAP HANA
Development Applications
1 54 (11.16%) JIRA
2 50 (10.33%) Git
3 47 (9.71%) Visual Studio
4 24 (4.96%) Rational DOORS
5 17 (3.51%) Bitbucket
6 16 (3.31%) Atlassian Bamboo
6 16 (3.31%) Subversion
7 9 (1.86%) Jenkins
8 6 (1.24%) LabVIEW
9 5 (1.03%) Eclipse
9 5 (1.03%) GDB
10 4 (0.83%) CppUnit
10 4 (0.83%) GitLab
10 4 (0.83%) SQL Server Management Studio (SSMS)
11 3 (0.62%) CMake
11 3 (0.62%) IDA Disassembler
12 2 (0.41%) Fiddler
12 2 (0.41%) Rational Rhapsody
12 2 (0.41%) Visual Studio Code
13 1 (0.21%) GCC
General
1 102 (21.07%) Electronics
2 99 (20.45%) Social Skills
3 48 (9.92%) Aerospace
3 48 (9.92%) Manufacturing
4 44 (9.09%) Finance
5 28 (5.79%) Avionics
5 28 (5.79%) Inclusion and Diversity
6 21 (4.34%) Analytical Skills
6 21 (4.34%) Telecoms
7 19 (3.93%) Automotive
8 14 (2.89%) Marketing
9 10 (2.07%) Military
10 9 (1.86%) Presentation Skills
11 8 (1.65%) Aviation
12 7 (1.45%) Public Sector
13 6 (1.24%) Law
13 6 (1.24%) Organisational Skills
14 5 (1.03%) Wearables
15 4 (0.83%) Retail
16 3 (0.62%) Legal
Job Titles
1 180 (37.19%) Software Engineer
2 165 (34.09%) Senior
3 123 (25.41%) Embedded Engineer
4 91 (18.80%) Embedded Software Engineer
5 75 (15.50%) Lead
6 73 (15.08%) Senior Software Engineer
7 41 (8.47%) Senior Embedded Engineer
8 34 (7.02%) Developer
9 29 (5.99%) Systems Engineer
10 28 (5.79%) Senior Embedded Software Engineer
11 26 (5.37%) Firmware Engineer
12 18 (3.72%) Electronics Engineer
13 17 (3.51%) Embedded Firmware Engineer
13 17 (3.51%) Principal Engineer
14 16 (3.31%) Principal Software Engineer
14 16 (3.31%) Senior Firmware Engineer
14 16 (3.31%) Software Team Leader
14 16 (3.31%) Team Leader
15 15 (3.10%) Lead Systems Engineer
15 15 (3.10%) Senior Data Warehouse Specialist
Libraries, Frameworks & Software Standards
1 75 (15.50%) HTML
2 25 (5.17%) .NET
3 16 (3.31%) XML
4 15 (3.10%) CSS
4 15 (3.10%) Middleware
4 15 (3.10%) Qt
5 13 (2.69%) Yocto
6 12 (2.48%) .NET Framework
7 6 (1.24%) React
8 4 (0.83%) HTML5
8 4 (0.83%) Node.js
8 4 (0.83%) REST
8 4 (0.83%) WebSockets
9 3 (0.62%) .NET Core
9 3 (0.62%) LAMP
9 3 (0.62%) OpenCL
9 3 (0.62%) OpenEmbedded
10 2 (0.41%) Flutter
10 2 (0.41%) Redux
10 2 (0.41%) Web Services
Miscellaneous
1 102 (21.07%) Embedded Systems
2 55 (11.36%) Algorithms
3 36 (7.44%) Device Driver
4 27 (5.58%) FPGA
5 25 (5.17%) Self-Motivation
6 21 (4.34%) IoT
7 18 (3.72%) e-Learning
8 16 (3.31%) Management Information System
8 16 (3.31%) MicroBlaze
8 16 (3.31%) Robotics
9 14 (2.89%) Analogue Electronics
9 14 (2.89%) VHDL
10 13 (2.69%) RISC-V
11 9 (1.86%) Mobile App
11 9 (1.86%) Product Ownership
11 9 (1.86%) Verilog
12 8 (1.65%) GNSS
13 6 (1.24%) CPLD
13 6 (1.24%) Greenfield Project
13 6 (1.24%) Life Science
Operating Systems
1 154 (31.82%) Linux
2 35 (7.23%) Embedded Linux
3 25 (5.17%) Windows
4 24 (4.96%) Unix
5 18 (3.72%) Android
6 11 (2.27%) Apple iOS
7 10 (2.07%) FreeRTOS
8 5 (1.03%) Mac OS
9 2 (0.41%) AIX
9 2 (0.41%) Red Hat Enterprise Linux
9 2 (0.41%) VxWorks
10 1 (0.21%) CentOS
10 1 (0.21%) Debian
10 1 (0.21%) Oracle Linux
10 1 (0.21%) Rocky
10 1 (0.21%) SafeRTOS
10 1 (0.21%) ThreadX
10 1 (0.21%) Windows Server
Processes & Methodologies
1 268 (55.37%) Software Engineering
2 105 (21.69%) Computer Science
3 99 (20.45%) Agile
4 72 (14.88%) Mathematics
5 66 (13.64%) Mentoring
6 63 (13.02%) Physics
7 59 (12.19%) Artificial Intelligence
8 55 (11.36%) Problem-Solving
9 53 (10.95%) Validation
10 52 (10.74%) OO
10 52 (10.74%) UML
11 51 (10.54%) Machine Learning
12 48 (9.92%) Data Privacy
13 43 (8.88%) SDLC
14 42 (8.68%) Quality Management
15 41 (8.47%) Test Automation
16 38 (7.85%) Software Architecture
16 38 (7.85%) Verification and Validation
17 37 (7.64%) Software Testing
18 36 (7.44%) Continuous Improvement
Programming Languages
1 313 (64.67%) C++
2 154 (31.82%) Python
3 138 (28.51%) C#
4 117 (24.17%) Java
5 78 (16.12%) MATLAB
6 75 (15.50%) SQL
7 71 (14.67%) JavaScript
8 59 (12.19%) PHP
9 58 (11.98%) Rust
10 54 (11.16%) TypeScript
11 50 (10.33%) Ruby
12 48 (9.92%) Dart
12 48 (9.92%) R
13 47 (9.71%) Ada
14 41 (8.47%) Embedded C
15 22 (4.55%) VB
16 17 (3.51%) Bash
17 13 (2.69%) Embedded C++
17 13 (2.69%) Objective-C
18 11 (2.27%) Fortran
Qualifications
1 228 (47.11%) Degree
2 58 (11.98%) Computer Science Degree
3 57 (11.78%) Security Cleared
4 38 (7.85%) BPSS Clearance
5 36 (7.44%) SC Cleared
6 25 (5.17%) PhD
7 20 (4.13%) Master's Degree
8 17 (3.51%) DV Cleared
9 16 (3.31%) HND
10 4 (0.83%) Chartered Engineer
11 1 (0.21%) HNC
11 1 (0.21%) Microsoft Certification
11 1 (0.21%) Postgraduate
Quality Assurance & Compliance
1 7 (1.45%) QA
2 4 (0.83%) ISO 9001
2 4 (0.83%) PMO
3 3 (0.62%) Accessibility
3 3 (0.62%) AUTOSAR
3 3 (0.62%) Def Stans
3 3 (0.62%) IEC 61508
4 2 (0.41%) DO-178B
4 2 (0.41%) ECSS
4 2 (0.41%) ISO 13485
4 2 (0.41%) ISO 26262
4 2 (0.41%) JTAG
4 2 (0.41%) MISRA
4 2 (0.41%) MISRA C
5 1 (0.21%) Automotive SPICE
5 1 (0.21%) IEC 62304
5 1 (0.21%) ISO/IEC 27001
System Software
1 95 (19.63%) Firmware
2 56 (11.57%) Embedded Firmware
3 15 (3.10%) Virtual Machines
4 12 (2.48%) Docker
5 1 (0.21%) KVM
5 1 (0.21%) Postfix
5 1 (0.21%) Sendmail
5 1 (0.21%) Xen
Systems Management
1 12 (2.48%) Kubernetes
2 3 (0.62%) Terraform
3 2 (0.41%) Grafana
4 1 (0.21%) Ansible
4 1 (0.21%) Functional Safety
4 1 (0.21%) Nagios
4 1 (0.21%) Nessus
4 1 (0.21%) Tivoli Storage Manager
Vendors
1 34 (7.02%) Microsoft
2 13 (2.69%) EMC
3 8 (1.65%) SAP
4 7 (1.45%) Xilinx
5 6 (1.24%) Intel
6 5 (1.03%) IBM
7 4 (0.83%) Agilent
7 4 (0.83%) Cadence
7 4 (0.83%) Siemens
8 3 (0.62%) Altera
8 3 (0.62%) Atmel
8 3 (0.62%) Graphcore
8 3 (0.62%) Green Hills
8 3 (0.62%) NVIDIA
8 3 (0.62%) Oracle
8 3 (0.62%) Red Hat
8 3 (0.62%) Xamarin
9 2 (0.41%) Microsemi
9 2 (0.41%) QNX
10 1 (0.21%) Tenable