Validation Jobs in the UK excluding London

Validation
UK > UK excluding London

The table below provides summary statistics for permanent job vacancies advertised in the UK excluding London requiring Validation skills. It includes a benchmarking guide to the annual salaries offered in vacancies that cited Validation over the 6 months leading up to 26 July 2024, comparing them to the same period in the previous two years.

6 months to
26 Jul 2024
Same period 2023 Same period 2022
Rank 148 148 135
Rank change year-on-year 0 -13 +38
Permanent jobs citing Validation 1,169 1,153 2,033
As % of all permanent jobs advertised in the UK excluding London 1.79% 2.39% 2.60%
As % of the Processes & Methodologies category 2.25% 2.51% 2.72%
Number of salaries quoted 423 377 737
10th Percentile £35,100 £33,825 £34,825
25th Percentile £40,000 £45,000 £38,750
Median annual salary (50th Percentile) £52,500 £55,043 £47,000
Median % change year-on-year -4.62% +17.11% -3.89%
75th Percentile £65,000 £72,500 £62,500
90th Percentile £76,000 £82,797 £77,500
UK median annual salary £57,002 £62,500 £55,000
% change year-on-year -8.80% +13.64% -

All Process and Methodology Skills
UK excluding London

Validation falls under the Processes and Methodologies category. For comparison with the information above, the following table provides summary statistics for all permanent job vacancies requiring process or methodology skills in the UK excluding London.

Permanent vacancies with a requirement for process or methodology skills 51,975 45,995 74,754
As % of all permanent jobs advertised in the UK excluding London 79.63% 95.53% 95.46%
Number of salaries quoted 33,355 26,900 43,045
10th Percentile £28,371 £30,500 £30,076
25th Percentile £37,500 £40,000 £39,000
Median annual salary (50th Percentile) £50,000 £55,000 £52,500
Median % change year-on-year -9.09% +4.76% +6.06%
75th Percentile £65,000 £69,500 £67,500
90th Percentile £80,000 £82,050 £81,250
UK median annual salary £55,000 £60,000 £60,000
% change year-on-year -8.33% - +9.09%

Validation
Job Vacancy Trend in the UK excluding London

Job postings citing Validation as a proportion of all IT jobs advertised in the UK excluding London.
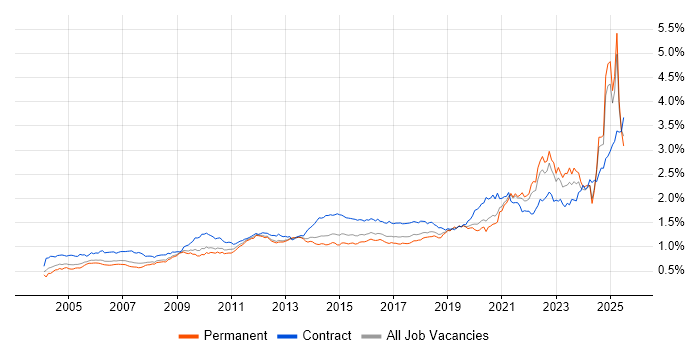
Job vacancy trend for Validation in the UK excluding London

Validation
Salary Trend in the UK excluding London

3-month moving average salary quoted in jobs citing Validation in the UK excluding London.

Salary trend for Validation in the UK excluding London

Validation
Salary Histogram in the UK excluding London

Salary distribution for jobs citing Validation in the UK excluding London over the 6 months to 26 July 2024.

Salary histogram for Validation in the UK excluding London

Validation
Job Locations in the UK excluding London

The table below looks at the demand and provides a guide to the median salaries quoted in IT jobs citing Validation within the UK excluding London region over the 6 months to 26 July 2024. The 'Rank Change' column provides an indication of the change in demand within each location based on the same 6 month period last year.

Location Rank Change
on Same Period
Last Year
Matching
Permanent
IT Job Ads
Median Salary
Past 6 Months
Median Salary
% Change
on Same Period
Last Year
Live
Jobs
South East +20 297 £52,500 -12.50% 93
North of England +30 241 £50,000 -9.16% 75
South West +6 212 £60,000 -12.73% 59
Midlands -64 174 £47,450 -9.01% 67
North West +44 172 £50,000 -7.01% 49
Scotland -24 97 £52,000 -25.12% 5
West Midlands -72 93 £49,000 -6.04% 41
East of England -35 84 £55,000 -12.00% 41
East Midlands +14 81 £42,500 -23.31% 26
Yorkshire +20 61 £52,500 -20.45% 14
Wales +34 32 £42,500 -1.32% 9
Northern Ireland +32 32 £87,500 - 9
North East -10 8 £46,600 -39.87% 14
Isle of Man - 1 - - 1
Channel Islands - 1 £55,000 -
Validation
UK

Validation
Co-occurring Skills and Capabilities in the UK excluding London by Category

The follow tables expand on the table above by listing co-occurrences grouped by category. The same employment type, locality and period is covered with up to 20 co-occurrences shown in each of the following categories:

Application Platforms
1 14 (1.20%) SharePoint
2 12 (1.03%) Documentum
3 11 (0.94%) Confluence
4 7 (0.60%) CMS
4 7 (0.60%) Kinematics
5 3 (0.26%) SAS
6 2 (0.17%) IIS
7 1 (0.086%) Adobe Experience Manager
7 1 (0.086%) Jupyter
7 1 (0.086%) WordPress
Applications
1 96 (8.21%) Microsoft Excel
2 79 (6.76%) Microsoft Office
3 42 (3.59%) Simulink
4 34 (2.91%) Microsoft PowerPoint
5 18 (1.54%) MS Visio
6 14 (1.20%) Stateflow
7 13 (1.11%) OrCAD
8 12 (1.03%) Sketch
9 7 (0.60%) SOLIDWORKS
10 6 (0.51%) Microsoft Project
11 5 (0.43%) Fusion 360
12 3 (0.26%) Siemens NX
13 2 (0.17%) CANalyzer
13 2 (0.17%) Maya
13 2 (0.17%) NUKE
13 2 (0.17%) Photoshop
13 2 (0.17%) Spreadsheet
14 1 (0.086%) Acrobat
14 1 (0.086%) Autodesk Inventor
14 1 (0.086%) Trello
Business Applications
1 29 (2.48%) iTrent
2 15 (1.28%) TrackWise
3 5 (0.43%) Salesforce CRM
4 4 (0.34%) SAP WM
5 3 (0.26%) NEC Housing
6 2 (0.17%) SAP S/4HANA
7 1 (0.086%) Dynamics AX
7 1 (0.086%) Infor LN
7 1 (0.086%) Lorenzo
7 1 (0.086%) NetSuite
7 1 (0.086%) SAP MDG
7 1 (0.086%) SAP MDG-BP
7 1 (0.086%) SAP MDG-F
7 1 (0.086%) Workfront
Cloud Services
1 103 (8.81%) Azure
2 82 (7.01%) AWS
3 68 (5.82%) Power Platform
4 29 (2.48%) SuccessFactors
5 27 (2.31%) GitHub
6 18 (1.54%) Microsoft 365
7 15 (1.28%) SaaS
8 13 (1.11%) Figma
9 12 (1.03%) GCP
9 12 (1.03%) OCI
9 12 (1.03%) PowerApps
10 11 (0.94%) OneDrive
10 11 (0.94%) Power Automate
10 11 (0.94%) ShareGate
11 10 (0.86%) Azure DevOps
12 9 (0.77%) BlazeMeter
12 9 (0.77%) Salesforce Sales Cloud
12 9 (0.77%) Salesforce Service Cloud
13 7 (0.60%) Azure Data Factory
14 5 (0.43%) Mavenlink
Communications & Networking
1 242 (20.70%) VSAT
2 30 (2.57%) 5G
3 22 (1.88%) Firewall
4 21 (1.80%) Ethernet
5 16 (1.37%) Internet
6 15 (1.28%) VPN
7 14 (1.20%) WAN
8 12 (1.03%) DHCP
8 12 (1.03%) DNS
9 11 (0.94%) 4G
9 11 (0.94%) SD-WAN
9 11 (0.94%) TCP/IP
9 11 (0.94%) Wireless
10 9 (0.77%) RS-232
11 8 (0.68%) Network Security
12 7 (0.60%) RFID
13 6 (0.51%) IPv4
14 5 (0.43%) 3G
14 5 (0.43%) J1939
15 4 (0.34%) Wi-Fi
Database & Business Intelligence
1 61 (5.22%) Power BI
2 33 (2.82%) Data Warehouse
3 26 (2.22%) SQL Server
4 23 (1.97%) Tableau
5 21 (1.80%) Big Data
6 16 (1.37%) Qlik Sense
7 14 (1.20%) SQL Server Integration Services
8 13 (1.11%) GIS
8 13 (1.11%) SQL Server Reporting Services
9 10 (0.86%) Relational Database
10 9 (0.77%) Data Mining
11 8 (0.68%) Crystal Reports
11 8 (0.68%) Power Query
12 7 (0.60%) BusinessObjects
12 7 (0.60%) Oracle Reports
13 6 (0.51%) Data Lake
13 6 (0.51%) Metadata
14 3 (0.26%) PostgreSQL
15 2 (0.17%) Azure SQL Database
15 2 (0.17%) NoSQL
Development Applications
1 114 (9.75%) JIRA
2 37 (3.17%) Git
3 18 (1.54%) Jenkins
3 18 (1.54%) Subversion
4 17 (1.45%) Visual Studio
5 14 (1.20%) Cucumber
5 14 (1.20%) Rational DOORS
6 9 (0.77%) Cypress.io
6 9 (0.77%) Gradle
6 9 (0.77%) JMeter
6 9 (0.77%) Maven
6 9 (0.77%) Selenium
6 9 (0.77%) Trac
7 8 (0.68%) GitLab
8 7 (0.60%) LabVIEW
8 7 (0.60%) Rational Rhapsody
9 6 (0.51%) SQL Server Management Studio (SSMS)
10 4 (0.34%) CANoe
11 2 (0.17%) Katalon Studio
11 2 (0.17%) Visual Studio Code
General
1 296 (25.32%) Social Skills
2 205 (17.54%) Analytical Skills
3 158 (13.52%) Finance
4 107 (9.15%) Aerospace
5 106 (9.07%) Inclusion and Diversity
6 105 (8.98%) Electronics
7 93 (7.96%) Manufacturing
8 86 (7.36%) Pharmaceutical
9 67 (5.73%) Law
10 61 (5.22%) Automotive
11 58 (4.96%) Legal
12 56 (4.79%) Marketing
12 56 (4.79%) Retail
13 49 (4.19%) Telecoms
14 40 (3.42%) Banking
15 37 (3.17%) Presentation Skills
16 34 (2.91%) Military
17 24 (2.05%) Organisational Skills
18 23 (1.97%) Influencing Skills
18 23 (1.97%) Investment Banking
Job Titles
1 267 (22.84%) Architect
2 243 (20.79%) Software Architect
3 134 (11.46%) Systems Engineer
4 119 (10.18%) Senior
5 117 (10.01%) Lead
6 114 (9.75%) Analyst
7 68 (5.82%) Software Engineer
8 45 (3.85%) DevOps Engineer
9 40 (3.42%) IT Manager
10 39 (3.34%) Developer
11 34 (2.91%) Hardware Engineer
12 30 (2.57%) Validation Engineer
13 29 (2.48%) HR Analyst
14 28 (2.40%) Embedded Engineer
15 26 (2.22%) Technical Leader
16 25 (2.14%) Senior Systems Engineer
17 21 (1.80%) Senior Software Engineer
18 20 (1.71%) Design Engineer
19 19 (1.63%) Systems Manager
19 19 (1.63%) Test Engineer
Libraries, Frameworks & Software Standards
1 23 (1.97%) React
2 22 (1.88%) HTML
3 19 (1.63%) CSS
4 13 (1.11%) XML
5 11 (0.94%) Hugging Face
6 10 (0.86%) EDI
6 10 (0.86%) Spring
7 9 (0.77%) .NET
7 9 (0.77%) Ext JS
7 9 (0.77%) Spring Boot
8 8 (0.68%) Middleware
8 8 (0.68%) WPF
9 7 (0.60%) JSON
9 7 (0.60%) REST
10 6 (0.51%) AngularJS
10 6 (0.51%) Gherkin
10 6 (0.51%) Vue
11 4 (0.34%) Unreal Engine
12 3 (0.26%) HTML5 Canvas
12 3 (0.26%) PyTorch
Miscellaneous
1 59 (5.05%) Management Information System
2 48 (4.11%) Life Science
3 44 (3.76%) Algorithms
4 41 (3.51%) Self-Motivation
5 23 (1.97%) FPGA
5 23 (1.97%) IoT
6 22 (1.88%) Legacy Systems
6 22 (1.88%) Product Ownership
7 19 (1.63%) GNSS
7 19 (1.63%) Robotics
8 17 (1.45%) Data Structures
9 14 (1.20%) Embedded Systems
10 13 (1.11%) LIMS
11 12 (1.03%) PDA
12 11 (0.94%) Analogue Electronics
13 10 (0.86%) Market Risk
13 10 (0.86%) PCIe
14 9 (0.77%) Analytical Mindset
15 8 (0.68%) Biopharmaceutical
16 7 (0.60%) Onboarding
Operating Systems
1 107 (9.15%) Linux
2 21 (1.80%) Windows
3 9 (0.77%) Ubuntu
3 9 (0.77%) Windows Server
4 8 (0.68%) Debian
5 2 (0.17%) Android
5 2 (0.17%) Embedded Linux
5 2 (0.17%) VxWorks
6 1 (0.086%) Apple iOS
6 1 (0.086%) FreeRTOS
6 1 (0.086%) Unix
Processes & Methodologies
1 277 (23.70%) Model Validation
2 273 (23.35%) Requirements Management
3 267 (22.84%) Actionable Insight
4 255 (21.81%) TOGAF
5 246 (21.04%) Network Architecture
6 243 (20.79%) Network Management
7 242 (20.70%) Technical Architecture
8 228 (19.50%) Verification and Validation
9 216 (18.48%) Agile
10 202 (17.28%) Problem-Solving
11 119 (10.18%) Software Engineering
12 117 (10.01%) Continuous Improvement
13 115 (9.84%) Project Management
13 115 (9.84%) Systems Engineering
14 112 (9.58%) DevOps
15 109 (9.32%) Analytics
16 107 (9.15%) SDLC
17 102 (8.73%) Computer Science
18 97 (8.30%) Collaborative Working
19 88 (7.53%) Decision-Making
Programming Languages
1 135 (11.55%) SQL
2 129 (11.04%) Python
3 71 (6.07%) MATLAB
4 69 (5.90%) C++
5 62 (5.30%) C
6 48 (4.11%) C#
7 43 (3.68%) JavaScript
8 32 (2.74%) VBA
9 25 (2.14%) Bash
10 22 (1.88%) PowerShell
10 22 (1.88%) R
11 21 (1.80%) Java
12 18 (1.54%) Perl
13 14 (1.20%) Julia
14 9 (0.77%) Data Analysis Expressions
14 9 (0.77%) TypeScript
15 8 (0.68%) Ada
16 7 (0.60%) Apex Code
16 7 (0.60%) Fortran
16 7 (0.60%) XAML
Qualifications
1 374 (31.99%) Degree
2 175 (14.97%) Security Cleared
3 68 (5.82%) SC Cleared
4 62 (5.30%) DV Cleared
5 46 (3.93%) Master's Degree
6 33 (2.82%) BPSS Clearance
6 33 (2.82%) Computer Science Degree
7 22 (1.88%) DBS Check
7 22 (1.88%) HND
8 19 (1.63%) HNC
9 14 (1.20%) CISM
9 14 (1.20%) CISSP
9 14 (1.20%) Numerate Degree
10 12 (1.03%) CISA
11 11 (0.94%) ITIL Certification
11 11 (0.94%) PCI QSA
12 10 (0.86%) PhD
13 8 (0.68%) AWS Certification
14 7 (0.60%) ISTQB
14 7 (0.60%) TOGAF Certification
Quality Assurance & Compliance
1 93 (7.96%) QA
2 34 (2.91%) Data Quality
3 32 (2.74%) PMO
4 28 (2.40%) GMP
5 26 (2.22%) GLP
5 26 (2.22%) ISO/IEC 27001
6 21 (1.80%) GxP
6 21 (1.80%) NIST
7 18 (1.54%) Good Clinical Practice
8 15 (1.28%) ISO/IEC 15288
9 11 (0.94%) Accessibility
9 11 (0.94%) ISO 26262
9 11 (0.94%) PCI DSS
10 10 (0.86%) MISRA
11 9 (0.77%) IEC 62304
12 8 (0.68%) Automotive SPICE
12 8 (0.68%) AUTOSAR
12 8 (0.68%) Cyber Essentials
12 8 (0.68%) MISRA C
13 6 (0.51%) NIST 800
System Software
1 60 (5.13%) Docker
2 36 (3.08%) Firmware
3 23 (1.97%) Active Directory
4 22 (1.88%) Virtual Machines
5 15 (1.28%) Hyper-V
5 15 (1.28%) pfSense
6 9 (0.77%) NFS
7 8 (0.68%) Embedded Firmware
8 4 (0.34%) VMware Infrastructure
9 2 (0.17%) VMware Server
Systems Management
1 54 (4.62%) Ansible
2 48 (4.11%) Kubernetes
3 46 (3.93%) Terraform
4 15 (1.28%) Functional Safety
4 15 (1.28%) Grafana
4 15 (1.28%) ZABBIX
5 9 (0.77%) Microsoft Data Protection Manager
5 9 (0.77%) SCDPM
6 1 (0.086%) SysTrack
Vendors
1 122 (10.44%) Microsoft
2 53 (4.53%) SAP
3 27 (2.31%) EMC
4 20 (1.71%) Salesforce
4 20 (1.71%) VMware
5 19 (1.63%) Oracle
6 17 (1.45%) ServiceNow
7 16 (1.37%) Google
8 15 (1.28%) Fortinet
8 15 (1.28%) Juniper
9 13 (1.11%) Databricks
10 12 (1.03%) Veeam
11 11 (0.94%) Nintex
12 9 (0.77%) McAfee
12 9 (0.77%) TOWER Software
13 8 (0.68%) MuleSoft
14 7 (0.60%) Remedy
15 6 (0.51%) Apple
15 6 (0.51%) Civica
16 4 (0.34%) MathWorks