Mathematics Jobs in the UK excluding London

Mathematics (Maths)
UK > UK excluding London

The table below provides summary statistics for permanent job vacancies advertised in the UK excluding London requiring Mathematics skills. It includes a benchmarking guide to the annual salaries offered in vacancies that cited Mathematics over the 6 months leading up to 30 May 2025, comparing them to the same period in the previous two years.

6 months to
30 May 2025
Same period 2024 Same period 2023
Rank 17 99 21
Rank change year-on-year +82 -78 +104
Permanent jobs citing Mathematics 3,447 1,970 5,765
As % of all permanent jobs advertised in the UK excluding London 8.75% 2.64% 9.94%
As % of the Processes & Methodologies category 9.45% 3.21% 10.40%
Number of salaries quoted 1,215 1,065 534
10th Percentile £25,313 £20,000 £24,000
25th Percentile £37,574 £25,300 £33,063
Median annual salary (50th Percentile) £50,055 £40,000 £45,196
Median % change year-on-year +25.14% -11.50% -0.67%
75th Percentile £59,375 £61,250 £72,500
90th Percentile £60,265 £70,750 £92,500
UK median annual salary £52,600 £45,000 £62,500
% change year-on-year +16.89% -28.00% +4.17%

All Process and Methodology Skills
UK excluding London

Mathematics falls under the Processes and Methodologies category. For comparison with the information above, the following table provides summary statistics for all permanent job vacancies requiring process or methodology skills in the UK excluding London.

Permanent vacancies with a requirement for process or methodology skills 36,483 61,419 55,450
As % of all permanent jobs advertised in the UK excluding London 92.65% 82.37% 95.58%
Number of salaries quoted 17,392 42,187 28,711
10th Percentile £26,250 £27,250 £30,500
25th Percentile £36,750 £36,250 £40,000
Median annual salary (50th Percentile) £51,574 £50,000 £55,000
Median % change year-on-year +3.15% -9.09% +4.76%
75th Percentile £65,000 £65,000 £70,000
90th Percentile £77,500 £77,500 £82,500
UK median annual salary £57,443 £55,000 £60,899
% change year-on-year +4.44% -9.69% +1.50%

Mathematics
Job Vacancy Trend in the UK excluding London

Job postings citing Mathematics as a proportion of all IT jobs advertised in the UK excluding London.
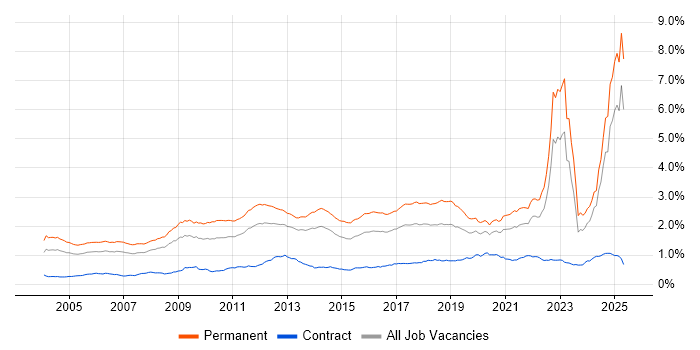
Job vacancy trend for Mathematics in the UK excluding London

Mathematics
Salary Trend in the UK excluding London

3-month moving average salary quoted in jobs citing Mathematics in the UK excluding London.

Salary trend for Mathematics in the UK excluding London

Mathematics
Salary Histogram in the UK excluding London

Salary distribution for jobs citing Mathematics in the UK excluding London over the 6 months to 30 May 2025.

Salary histogram for Mathematics in the UK excluding London

Mathematics
Job Locations in the UK excluding London

The table below looks at the demand and provides a guide to the median salaries quoted in IT jobs citing Mathematics within the UK excluding London region over the 6 months to 30 May 2025. The 'Rank Change' column provides an indication of the change in demand within each location based on the same 6 month period last year.

Location Rank Change
on Same Period
Last Year
Matching
Permanent
IT Job Ads
Median Salary
Past 6 Months
Median Salary
% Change
on Same Period
Last Year
Live
Jobs
North of England +187 1,599 £47,683 +40.63% 688
North West +146 1,110 £47,863 +27.63% 322
Midlands +54 544 £40,101 +43.22% 511
Yorkshire +147 469 £25,625 -26.79% 264
Scotland +64 407 £58,033 +10.54% 117
South East +2 399 £52,250 +16.11% 1,045
South West +107 335 £52,600 +5.20% 380
West Midlands +46 334 £30,000 - 273
East Midlands +48 210 £40,101 +44.51% 210
East of England +38 115 £40,101 +31.48% 425
Wales +44 39 £47,550 +11.88% 75
North East +52 20 £40,000 +33.33% 107
Northern Ireland +48 10 £26,000 -62.86% 45
Mathematics
UK

Mathematics
Co-occurring Skills and Capabilities in the UK excluding London by Category

The follow tables expand on the table above by listing co-occurrences grouped by category. The same employment type, locality and period is covered with up to 20 co-occurrences shown in each of the following categories:

Application Platforms
1 27 (0.78%) Apache
2 23 (0.67%) Jupyter
3 22 (0.64%) SAS
4 4 (0.12%) SharePoint
5 2 (0.058%) Apache Spark
5 2 (0.058%) CMS
5 2 (0.058%) Confluence
6 1 (0.029%) Apache Airflow
6 1 (0.029%) Microsoft Exchange
Applications
1 736 (21.35%) Simulink
2 170 (4.93%) Chatbot
3 117 (3.39%) Mathcad
4 39 (1.13%) Microsoft Office
5 31 (0.90%) Microsoft Excel
6 26 (0.75%) Mathematica
7 3 (0.087%) GNU Octave
7 3 (0.087%) Microsoft PowerPoint
8 2 (0.058%) LaTeX
8 2 (0.058%) OrCAD
8 2 (0.058%) SPSS
Business Applications
1 138 (4.00%) Teamcenter
Cloud Services
1 225 (6.53%) AWS
2 62 (1.80%) Azure
3 37 (1.07%) Amazon EKS
4 36 (1.04%) AWS CloudFormation
5 26 (0.75%) Power Platform
6 18 (0.52%) SaaS
7 17 (0.49%) Microsoft 365
8 16 (0.46%) Amazon SageMaker
9 14 (0.41%) Cloud Computing
10 9 (0.26%) Azure DevOps
11 7 (0.20%) GitHub
12 6 (0.17%) Azure Synapse Analytics
12 6 (0.17%) GCP
13 4 (0.12%) AWS Lambda
13 4 (0.12%) Serverless
13 4 (0.12%) Snowflake
14 2 (0.058%) IaaS
14 2 (0.058%) PowerApps
15 1 (0.029%) Amazon EC2
15 1 (0.029%) Azure Service Bus
Communications & Networking
1 651 (18.89%) VPN
2 391 (11.34%) DNS
3 260 (7.54%) Cisco IOS
4 12 (0.35%) Network Security
5 3 (0.087%) Software-Defined Radio
6 2 (0.058%) Internet
6 2 (0.058%) Intranet
7 1 (0.029%) DWDM
7 1 (0.029%) Ethernet
7 1 (0.029%) Firewall
7 1 (0.029%) GPON
7 1 (0.029%) IPv4
7 1 (0.029%) IPv6
7 1 (0.029%) MPLS
7 1 (0.029%) SMS
7 1 (0.029%) TCP/IP
7 1 (0.029%) Wideband
Database & Business Intelligence
1 97 (2.81%) Big Data
2 45 (1.31%) Elasticsearch
3 30 (0.87%) SQL Server
4 26 (0.75%) Power BI
5 22 (0.64%) Tableau
6 15 (0.44%) Relational Database
7 10 (0.29%) PostgreSQL
8 8 (0.23%) Data Mining
9 5 (0.15%) NoSQL
9 5 (0.15%) Redis
10 4 (0.12%) Data Warehouse
10 4 (0.12%) MySQL
10 4 (0.12%) Oracle Database
11 3 (0.087%) Amazon Aurora
11 3 (0.087%) DynamoDB
11 3 (0.087%) GIS
12 2 (0.058%) CockroachDB
12 2 (0.058%) Geospatial Data
12 2 (0.058%) Hadoop
12 2 (0.058%) MongoDB
Development Applications
1 158 (4.58%) Rational DOORS
2 42 (1.22%) JIRA
3 36 (1.04%) Visual Studio
4 26 (0.75%) Git
5 25 (0.73%) Eclipse
5 25 (0.73%) Eclipse RCP
6 5 (0.15%) Subversion
7 3 (0.087%) RStudio
8 2 (0.058%) Jenkins
8 2 (0.058%) SQL Server Management Studio (SSMS)
9 1 (0.029%) Bitbucket
9 1 (0.029%) CMake
9 1 (0.029%) GitLab
9 1 (0.029%) gulp
9 1 (0.029%) LabVIEW
9 1 (0.029%) PostCSS
9 1 (0.029%) Postman
9 1 (0.029%) rollup.js
9 1 (0.029%) Vite
General
1 797 (23.12%) Analytical Skills
2 748 (21.70%) Inclusion and Diversity
3 737 (21.38%) Social Skills
4 634 (18.39%) Finance
5 430 (12.47%) Electronics
6 389 (11.29%) Presentation Skills
7 345 (10.01%) Manufacturing
8 300 (8.70%) Aerospace
9 253 (7.34%) Marketing
10 181 (5.25%) Law
11 162 (4.70%) Aeronautics
12 143 (4.15%) Banking
13 98 (2.84%) Documentation Skills
14 90 (2.61%) Legal
15 68 (1.97%) Automotive
16 63 (1.83%) Organisational Skills
17 53 (1.54%) Retail
18 33 (0.96%) Esports
19 28 (0.81%) Avionics
20 22 (0.64%) Military
Job Titles
1 1,022 (29.65%) Systems Engineer
2 837 (24.28%) Senior
3 458 (13.29%) Developer
4 438 (12.71%) Software Developer
5 364 (10.56%) Senior Systems Engineer
6 260 (7.54%) Infrastructure Engineer
7 240 (6.96%) Principal Engineer
8 205 (5.95%) Principal Systems Engineer
9 177 (5.13%) IT Support
10 172 (4.99%) Trainer
11 171 (4.96%) Junior
12 151 (4.38%) Technical Manager
13 138 (4.00%) Junior Systems Engineer
14 136 (3.95%) Help Desk Manager
15 135 (3.92%) Software Engineer
16 115 (3.34%) Analyst
16 115 (3.34%) Lead
17 101 (2.93%) Products Support Manager
18 88 (2.55%) Lead Systems Engineer
18 88 (2.55%) Team Leader
Libraries, Frameworks & Software Standards
1 260 (7.54%) Elastic Stack
2 60 (1.74%) Software Packaging
3 53 (1.54%) .NET
3 53 (1.54%) Node.js
4 37 (1.07%) Pandas
5 34 (0.99%) HTML
6 27 (0.78%) CSS
7 25 (0.73%) JSP
7 25 (0.73%) Middleware
8 15 (0.44%) React
9 13 (0.38%) PyTorch
9 13 (0.38%) scikit-learn
9 13 (0.38%) TensorFlow
10 11 (0.32%) NumPy
11 9 (0.26%) Keras
12 8 (0.23%) AngularJS
13 7 (0.20%) ASP.NET
13 7 (0.20%) Kafka
13 7 (0.20%) RESTful
14 6 (0.17%) ASP.NET MVC
Miscellaneous
1 733 (21.26%) Cyberattack
2 133 (3.86%) Enterprise Software
3 127 (3.68%) Algorithms
4 44 (1.28%) SCADA
5 40 (1.16%) Self-Motivation
6 38 (1.10%) Social Media
7 37 (1.07%) Management Information System
8 23 (0.67%) Driving Licence
9 19 (0.55%) Mobile App
10 15 (0.44%) Cloud Native
10 15 (0.44%) EPoS
11 9 (0.26%) Data Structures
11 9 (0.26%) e-Learning
11 9 (0.26%) Public Cloud
12 8 (0.23%) FPGA
13 6 (0.17%) Mainframe
13 6 (0.17%) Product Ownership
14 5 (0.15%) 3D Graphics
14 5 (0.15%) Credit Risk
14 5 (0.15%) Embedded Systems
Operating Systems
1 778 (22.57%) Linux
2 707 (20.51%) Android
3 493 (14.30%) Windows
4 33 (0.96%) Windows Vista
5 12 (0.35%) Unix
6 2 (0.058%) Apple iOS
6 2 (0.058%) FreeRTOS
7 1 (0.029%) Embedded Linux
7 1 (0.029%) Red Hat Enterprise Linux
7 1 (0.029%) SafeRTOS
7 1 (0.029%) VMS
7 1 (0.029%) VxWorks
Processes & Methodologies
1 1,420 (41.20%) Systems Engineering
2 1,303 (37.80%) Physics
3 939 (27.24%) Line Management
4 879 (25.50%) Model-Based Systems Engineering
5 797 (23.12%) Problem-Solving
6 773 (22.43%) Software Engineering
7 668 (19.38%) Validation
8 637 (18.48%) SysML
9 629 (18.25%) Verification and Validation
10 541 (15.69%) Agile
11 473 (13.72%) Digital Twin
12 461 (13.37%) OO
13 458 (13.29%) Computer Science
14 439 (12.74%) OOP
15 435 (12.62%) Design Patterns
16 428 (12.42%) Android Development
17 395 (11.46%) Continuous Improvement
18 370 (10.73%) Coaching
19 350 (10.15%) Artificial Intelligence
20 310 (8.99%) Statistics
Programming Languages
1 1,027 (29.79%) Python
2 741 (21.50%) MATLAB
3 547 (15.87%) Java
4 521 (15.11%) C++
5 431 (12.50%) Go
6 269 (7.80%) Bash
7 261 (7.57%) PowerShell
8 151 (4.38%) SQL
9 104 (3.02%) Rust
10 88 (2.55%) JavaScript
11 73 (2.12%) C
11 73 (2.12%) C#
12 26 (0.75%) Ada
13 24 (0.70%) R
14 12 (0.35%) TypeScript
15 10 (0.29%) Fortran
16 5 (0.15%) Embedded C
17 3 (0.087%) Embedded C++
17 3 (0.087%) PHP
17 3 (0.087%) VBA
Qualifications
1 2,375 (68.90%) Degree
2 1,046 (30.35%) BPSS Clearance
3 539 (15.64%) HND
4 518 (15.03%) Security Cleared
5 496 (14.39%) DV Cleared
6 475 (13.78%) HNC
7 232 (6.73%) Master's Degree
8 225 (6.53%) PhD
9 187 (5.43%) Numerate Degree
10 54 (1.57%) DBS Check
11 46 (1.33%) Computer Science Degree
12 34 (0.99%) SC Cleared
13 19 (0.55%) Chartered Engineer
14 6 (0.17%) Postgraduate
15 5 (0.15%) A+ Certification
16 3 (0.087%) AWS Certification
16 3 (0.087%) Azure Certification
16 3 (0.087%) Microsoft Certification
17 2 (0.058%) CISM
17 2 (0.058%) CISSP
Quality Assurance & Compliance
1 158 (4.58%) IEC 61508
2 156 (4.53%) ARP4754
2 156 (4.53%) DO-254
3 92 (2.67%) ISO/IEC 15288
4 6 (0.17%) Data Quality
4 6 (0.17%) GDPR
5 3 (0.087%) Def Stans
5 3 (0.087%) QA
6 2 (0.058%) Accessibility
6 2 (0.058%) DO-178B
6 2 (0.058%) ISO/IEC 27001
6 2 (0.058%) NIST
7 1 (0.029%) Actionable Recommendations
7 1 (0.029%) IEC 62304
7 1 (0.029%) ISO 26262
7 1 (0.029%) Sarbanes-Oxley
7 1 (0.029%) SLA
System Software
1 718 (20.83%) Docker
2 260 (7.54%) Hyper-V
2 260 (7.54%) VMware NSX
2 260 (7.54%) vSphere
3 7 (0.20%) Firmware
4 6 (0.17%) Active Directory
Systems Management
1 688 (19.96%) Ansible
2 303 (8.79%) Terraform
3 68 (1.97%) Kubernetes
4 4 (0.12%) Grafana
5 3 (0.087%) BMC PATROL
6 2 (0.058%) Netcool
6 2 (0.058%) Netcool/OMNIbus
6 2 (0.058%) Prometheus
6 2 (0.058%) Tivoli
7 1 (0.029%) Microsoft Intune
Vendors
1 263 (7.63%) Splunk
2 261 (7.57%) Cisco
3 260 (7.54%) 3PAR
3 260 (7.54%) Juniper
4 170 (4.93%) PayPal
5 140 (4.06%) IBM
6 107 (3.10%) Microsoft
7 101 (2.93%) MathWorks
8 20 (0.58%) Siemens
9 18 (0.52%) Zoho
10 12 (0.35%) Databricks
11 9 (0.26%) Oracle
12 7 (0.20%) SAP
12 7 (0.20%) ServiceNow
13 6 (0.17%) Google
14 4 (0.12%) EMC
14 4 (0.12%) Xilinx
15 2 (0.058%) Capita
15 2 (0.058%) Proofpoint
15 2 (0.058%) Salesforce