C++ Jobs in the UK excluding London

C++
UK > UK excluding London

The table below provides summary statistics for permanent job vacancies advertised in the UK excluding London requiring C++ skills. It includes a benchmarking guide to the annual salaries offered in vacancies that cited C++ over the 6 months leading up to 26 July 2024, comparing them to the same period in the previous two years.

6 months to
26 Jul 2024
Same period 2023 Same period 2022
Rank 84 134 78
Rank change year-on-year +50 -56 +12
Permanent jobs citing C++ 1,807 1,236 3,010
As % of all permanent jobs advertised in the UK excluding London 2.77% 2.57% 3.84%
As % of the Programming Languages category 9.91% 7.04% 8.83%
Number of salaries quoted 1,405 840 1,254
10th Percentile £37,500 £34,324 £32,500
25th Percentile £45,000 £43,000 £40,371
Median annual salary (50th Percentile) £57,500 £57,500 £55,000
Median % change year-on-year - +4.55% +4.76%
75th Percentile £68,750 £71,250 £71,250
90th Percentile £84,964 £81,250 £82,500
UK median annual salary £60,000 £62,500 £65,000
% change year-on-year -4.00% -3.85% +13.04%

All Programming Languages
UK excluding London

C++ falls under the Programming Languages category. For comparison with the information above, the following table provides summary statistics for all permanent job vacancies requiring coding skills in the UK excluding London.

Permanent vacancies with a requirement for coding skills 18,228 17,552 34,089
As % of all permanent jobs advertised in the UK excluding London 27.93% 36.46% 43.53%
Number of salaries quoted 12,662 11,914 21,248
10th Percentile £33,250 £35,000 £33,000
25th Percentile £42,500 £42,500 £41,250
Median annual salary (50th Percentile) £55,000 £55,000 £53,850
Median % change year-on-year - +2.14% +7.70%
75th Percentile £67,500 £71,231 £68,750
90th Percentile £80,000 £82,548 £82,500
UK median annual salary £60,000 £65,000 £62,500
% change year-on-year -7.69% +4.00% +8.70%

C++
Job Vacancy Trend in the UK excluding London

Job postings citing C++ as a proportion of all IT jobs advertised in the UK excluding London.
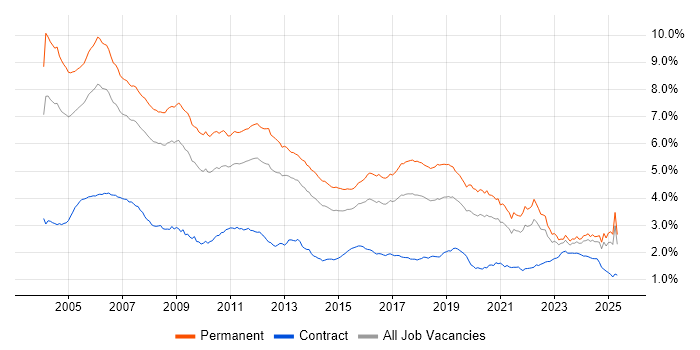
Job vacancy trend for C++ in the UK excluding London

C++
Salary Trend in the UK excluding London

3-month moving average salary quoted in jobs citing C++ in the UK excluding London.

Salary trend for C++ in the UK excluding London

C++
Salary Histogram in the UK excluding London

Salary distribution for jobs citing C++ in the UK excluding London over the 6 months to 26 July 2024.

Salary histogram for C++ in the UK excluding London

C++
Job Locations in the UK excluding London

The table below looks at the demand and provides a guide to the median salaries quoted in IT jobs citing C++ within the UK excluding London region over the 6 months to 26 July 2024. The 'Rank Change' column provides an indication of the change in demand within each location based on the same 6 month period last year.

Location Rank Change
on Same Period
Last Year
Matching
Permanent
IT Job Ads
Median Salary
Past 6 Months
Median Salary
% Change
on Same Period
Last Year
Live
Jobs
South East +30 600 £57,500 -4.17% 89
South West +39 313 £59,000 -1.67% 70
Midlands +17 256 £50,000 -9.09% 65
North of England +95 255 £60,000 +6.67% 51
East of England +26 170 £65,000 - 42
Scotland -42 154 £57,500 +4.55% 19
North West +56 143 £62,500 +8.70% 31
West Midlands -12 130 £61,500 +6.96% 33
East Midlands +43 126 £45,000 -18.18% 30
Yorkshire +87 88 £47,500 +11.76% 14
Wales +59 54 £50,000 +11.11% 4
North East +6 24 £60,000 -5.88% 6
Northern Ireland +15 5 - - 6
C++
UK

C++
Co-occurring Skills and Capabilities in the UK excluding London by Category

The follow tables expand on the table above by listing co-occurrences grouped by category. The same employment type, locality and period is covered with up to 20 co-occurrences shown in each of the following categories:

Application Platforms
1 53 (2.93%) Apache
2 11 (0.61%) Confluence
3 8 (0.44%) Kinematics
4 6 (0.33%) WinCC
5 3 (0.17%) CMS
5 3 (0.17%) nginx
5 3 (0.17%) OpenStack
5 3 (0.17%) ThingWorx
6 1 (0.055%) Apache Spark
6 1 (0.055%) IBM Domino
6 1 (0.055%) IBM Notes
6 1 (0.055%) IIS
6 1 (0.055%) Microsoft Exchange
6 1 (0.055%) SAS
6 1 (0.055%) Tomcat
6 1 (0.055%) WebLogic
Applications
1 123 (6.81%) Simulink
2 14 (0.77%) Microsoft Office
3 11 (0.61%) GNU Octave
3 11 (0.61%) Microsoft Excel
4 7 (0.39%) OrCAD
5 5 (0.28%) Fusion 360
5 5 (0.28%) SOLIDWORKS
6 3 (0.17%) MS Visio
6 3 (0.17%) Siemens NX
7 2 (0.11%) Maya
7 2 (0.11%) Microsoft PowerPoint
7 2 (0.11%) NUKE
7 2 (0.11%) Photoshop
8 1 (0.055%) CATIA
8 1 (0.055%) Revit
8 1 (0.055%) SketchUp
8 1 (0.055%) Spreadsheet
8 1 (0.055%) Stateflow
Business Applications
1 4 (0.22%) C-CURE
2 1 (0.055%) JDE EnterpriseOne
2 1 (0.055%) JDE World
2 1 (0.055%) NEC Housing
2 1 (0.055%) Oracle Applications
2 1 (0.055%) SAP Business One
Cloud Services
1 114 (6.31%) Azure
2 95 (5.26%) AWS
3 40 (2.21%) SaaS
4 21 (1.16%) Azure DevOps
4 21 (1.16%) GCP
5 14 (0.77%) GitHub
6 10 (0.55%) Cloud Computing
7 7 (0.39%) Power Platform
8 6 (0.33%) PowerApps
9 5 (0.28%) AWS IoT
9 5 (0.28%) Power Automate
9 5 (0.28%) Serverless
10 4 (0.22%) Amazon EC2
10 4 (0.22%) Amazon S3
10 4 (0.22%) AWS Lambda
10 4 (0.22%) IaaS
10 4 (0.22%) TestFlight
11 3 (0.17%) AWS CloudFormation
11 3 (0.17%) OpenShift
11 3 (0.17%) WhatsApp
Communications & Networking
1 46 (2.55%) TCP/IP
2 42 (2.32%) Wireless
3 38 (2.10%) Network Security
4 29 (1.60%) Internet
5 28 (1.55%) Ethernet
6 26 (1.44%) MQTT
6 26 (1.44%) RS-485
6 26 (1.44%) Wi-Fi
7 23 (1.27%) Bluetooth
8 22 (1.22%) 4G
8 22 (1.22%) 5G
9 18 (1.00%) 3G
9 18 (1.00%) HTTP
10 16 (0.89%) SD-WAN
10 16 (0.89%) WAN
10 16 (0.89%) Wireshark
11 14 (0.77%) RS-232
12 13 (0.72%) Modbus
13 12 (0.66%) DVB
14 10 (0.55%) DNS
Database & Business Intelligence
1 50 (2.77%) SQL Server
2 42 (2.32%) PostgreSQL
3 39 (2.16%) NoSQL
4 26 (1.44%) MongoDB
5 15 (0.83%) MySQL
6 11 (0.61%) Big Data
7 8 (0.44%) Relational Database
8 6 (0.33%) Power BI
9 4 (0.22%) Amazon RDS
9 4 (0.22%) BusinessObjects
9 4 (0.22%) SQLite
10 3 (0.17%) GIS
11 2 (0.11%) Azure SQL Database
11 2 (0.11%) Data Hub
11 2 (0.11%) Data Warehouse
11 2 (0.11%) Elasticsearch
11 2 (0.11%) RDBMS
12 1 (0.055%) Oracle Database
12 1 (0.055%) Oracle Database 12c
12 1 (0.055%) QGIS
Development Applications
1 150 (8.30%) Git
2 114 (6.31%) Visual Studio
3 59 (3.27%) Jenkins
4 51 (2.82%) JIRA
5 42 (2.32%) LabVIEW
6 41 (2.27%) Subversion
7 35 (1.94%) GitLab
8 32 (1.77%) Vagrant
9 24 (1.33%) CMake
10 14 (0.77%) Team Foundation Server
11 12 (0.66%) Rational Rhapsody
11 12 (0.66%) TestRail
12 11 (0.61%) IDA Disassembler
13 10 (0.55%) Eclipse
14 9 (0.50%) Ant
14 9 (0.50%) GDB
15 8 (0.44%) Bitbucket
15 8 (0.44%) GCC
15 8 (0.44%) Selenium
16 7 (0.39%) NetBeans
General
1 325 (17.99%) Social Skills
2 254 (14.06%) Electronics
3 166 (9.19%) Analytical Skills
4 127 (7.03%) Manufacturing
5 106 (5.87%) Automotive
6 70 (3.87%) Finance
7 64 (3.54%) Marketing
8 60 (3.32%) Inclusion and Diversity
9 50 (2.77%) Telecoms
10 48 (2.66%) Aerospace
11 40 (2.21%) Games
12 34 (1.88%) Military
13 33 (1.83%) Public Sector
14 30 (1.66%) Legal
15 28 (1.55%) Presentation Skills
16 21 (1.16%) Aviation
17 20 (1.11%) Law
18 18 (1.00%) Organisational Skills
19 14 (0.77%) Mandarin Language
20 8 (0.44%) Advertising
Job Titles
1 917 (50.75%) Software Engineer
2 403 (22.30%) Senior
3 343 (18.98%) Embedded Engineer
4 333 (18.43%) Developer
5 312 (17.27%) C++ Software Engineer
6 262 (14.50%) Senior Software Engineer
7 254 (14.06%) Embedded Software Engineer
8 169 (9.35%) C++ Developer
9 144 (7.97%) Lead
9 144 (7.97%) Software Developer
10 110 (6.09%) Senior Embedded Engineer
11 92 (5.09%) Senior C++ Software Engineer
12 90 (4.98%) Embedded C++ Engineer
13 79 (4.37%) Architect
13 79 (4.37%) C Software Engineer
13 79 (4.37%) C/C++ Software Engineer
13 79 (4.37%) Embedded Developer
14 77 (4.26%) Senior Embedded Software Engineer
15 73 (4.04%) Embedded C++ Software Engineer
16 68 (3.76%) Software Architect
Libraries, Frameworks & Software Standards
1 168 (9.30%) .NET
2 87 (4.81%) Qt
3 78 (4.32%) HTML
4 72 (3.98%) WPF
5 54 (2.99%) .NET Framework
6 53 (2.93%) REST
6 53 (2.93%) STL
7 41 (2.27%) React
8 40 (2.21%) CSS
9 38 (2.10%) Middleware
10 36 (1.99%) Web Services
10 36 (1.99%) Yocto
11 35 (1.94%) MFC
12 28 (1.55%) WinForms
13 27 (1.49%) OpenGL
13 27 (1.49%) SOAP
14 26 (1.44%) ASP.NET
15 25 (1.38%) XML
16 23 (1.27%) Apache NiFi
16 23 (1.27%) JSON
Miscellaneous
1 182 (10.07%) Algorithms
2 132 (7.30%) Embedded Systems
3 84 (4.65%) FPGA
4 77 (4.26%) IoT
5 71 (3.93%) Self-Motivation
6 64 (3.54%) VHDL
7 63 (3.49%) Robotics
8 37 (2.05%) GNSS
9 30 (1.66%) CUDA
9 30 (1.66%) Distributed Systems
10 29 (1.60%) Analogue Electronics
11 28 (1.55%) Enterprise Software
12 26 (1.44%) Device Driver
13 19 (1.05%) ARM Cortex
13 19 (1.05%) Greenfield Project
13 19 (1.05%) Verilog
13 19 (1.05%) Video\Live Streaming
14 18 (1.00%) Analytical Mindset
15 17 (0.94%) SCADA
16 16 (0.89%) Renewable Energy
Operating Systems
1 626 (34.64%) Linux
2 272 (15.05%) Windows
3 170 (9.41%) Embedded Linux
4 87 (4.81%) Android
5 65 (3.60%) Unix
6 51 (2.82%) Ubuntu
7 41 (2.27%) Red Hat Enterprise Linux
8 37 (2.05%) CentOS
9 21 (1.16%) AIX
10 19 (1.05%) FreeRTOS
11 15 (0.83%) Mac OS
12 14 (0.77%) Windows Server
13 12 (0.66%) Windows 10
14 11 (0.61%) Kali Linux
15 9 (0.50%) Apple iOS
16 5 (0.28%) Debian
16 5 (0.28%) VxWorks
16 5 (0.28%) Windows Embedded Compact
17 3 (0.17%) Rocky
17 3 (0.17%) SUSE Linux Enterprise Server
Processes & Methodologies
1 1,165 (64.47%) Software Engineering
2 374 (20.70%) Computer Science
3 358 (19.81%) Problem-Solving
4 279 (15.44%) Agile
5 215 (11.90%) Mathematics
6 191 (10.57%) Artificial Intelligence
7 175 (9.68%) Machine Learning
8 144 (7.97%) Signal Processing
9 143 (7.91%) SDLC
10 141 (7.80%) Multithreading
11 133 (7.36%) Software Testing
12 126 (6.97%) OO
12 126 (6.97%) Physics
13 125 (6.92%) Collaborative Working
14 118 (6.53%) DevOps
15 117 (6.47%) Mentoring
16 106 (5.87%) Test Automation
17 83 (4.59%) Code Quality
18 76 (4.21%) Open Source
19 72 (3.98%) Unit Testing
Programming Languages
1 949 (52.52%) C
2 584 (32.32%) Python
3 436 (24.13%) C#
4 350 (19.37%) Java
5 177 (9.80%) JavaScript
6 172 (9.52%) SQL
7 117 (6.47%) Embedded C
8 101 (5.59%) Embedded C++
8 101 (5.59%) MATLAB
9 87 (4.81%) Bash
10 79 (4.37%) Fortran
11 56 (3.10%) VB
12 51 (2.82%) Perl
13 44 (2.43%) Rust
14 36 (1.99%) TypeScript
15 34 (1.88%) Go
16 33 (1.83%) PowerShell
17 32 (1.77%) Kotlin
18 29 (1.60%) COBOL
18 29 (1.60%) Micro Focus COBOL
Qualifications
1 590 (32.65%) Degree
2 343 (18.98%) Security Cleared
3 176 (9.74%) Computer Science Degree
4 145 (8.02%) SC Cleared
5 88 (4.87%) DV Cleared
6 73 (4.04%) PhD
7 63 (3.49%) Master's Degree
8 15 (0.83%) BPSS Clearance
9 13 (0.72%) HND
10 9 (0.50%) PMI Certification
11 5 (0.28%) Numerate Degree
12 4 (0.22%) HNC
12 4 (0.22%) ITIL Foundation Certificate
13 3 (0.17%) CompTIA Security+
13 3 (0.17%) Microsoft Certification
14 2 (0.11%) AWS Certification
14 2 (0.11%) Azure Certification
14 2 (0.11%) CCNA
14 2 (0.11%) Cisco Certification
14 2 (0.11%) DBS Check
Quality Assurance & Compliance
1 44 (2.43%) QA
2 20 (1.11%) PMO
3 17 (0.94%) MISRA
4 16 (0.89%) GDPR
5 15 (0.83%) ISO 9001
6 11 (0.61%) Software Quality Assurance
7 10 (0.55%) IEC 61131
8 8 (0.44%) MISRA C
9 7 (0.39%) AUTOSAR
9 7 (0.39%) ISO 13485
9 7 (0.39%) ISO 9000
10 6 (0.33%) Def Stans
10 6 (0.33%) IEC 61508
10 6 (0.33%) ISO 26262
10 6 (0.33%) TickIT
11 5 (0.28%) JTAG
12 4 (0.22%) 21 CFR Part 11
13 2 (0.11%) IEC 62304
13 2 (0.11%) NIST
14 1 (0.055%) NIST 800
System Software
1 184 (10.18%) Firmware
2 97 (5.37%) Embedded Firmware
3 60 (3.32%) Docker
4 7 (0.39%) Lustre
4 7 (0.39%) Slurm Workload Manager
5 5 (0.28%) VMware Infrastructure
6 3 (0.17%) Active Directory
6 3 (0.17%) Ceph
6 3 (0.17%) GPFS
6 3 (0.17%) VirtualBox
7 2 (0.11%) VMware ESXi
8 1 (0.055%) Oracle RAC
8 1 (0.055%) QEMU
Systems Management
1 49 (2.71%) Ansible
2 46 (2.55%) Terraform
3 37 (2.05%) Kubernetes
4 6 (0.33%) Puppet
5 4 (0.22%) Podman
6 2 (0.11%) Grafana
6 2 (0.11%) Prometheus
7 1 (0.055%) Docker Swarm
7 1 (0.055%) Oracle Enterprise Manager
7 1 (0.055%) Progress Chef
7 1 (0.055%) SELinux
7 1 (0.055%) ZENworks
Vendors
1 131 (7.25%) Microsoft
2 88 (4.87%) Xilinx
3 36 (1.99%) Oracle
4 33 (1.83%) SAP
5 29 (1.60%) Micro Focus
6 15 (0.83%) Atlassian
6 15 (0.83%) EMC
7 11 (0.61%) Google
8 10 (0.55%) ANSYS
9 8 (0.44%) Altera
9 8 (0.44%) Green Hills
9 8 (0.44%) Motorola
10 7 (0.39%) Cisco
10 7 (0.39%) Siemens
11 6 (0.33%) IBM
11 6 (0.33%) Remedy
12 5 (0.28%) Red Hat
12 5 (0.28%) VMware
13 4 (0.22%) Apple
13 4 (0.22%) Cadence