Software Engineer Job Trends in the UK excluding London

Software Engineer
UK > UK excluding London

The median Software Engineer salary in the UK excluding London is £65,000 per year, according to job vacancies posted during the 6 months leading to 18 September 2025.

The table below provides salary benchmarking and summary statistics, comparing them to the same period in the previous two years.

6 months to
18 Sep 2025
Same period 2024 Same period 2023
Rank 62 15 66
Rank change year-on-year -47 +51 -32
Permanent jobs requiring a Software Engineer 1,340 4,424 1,477
As % of all permanent jobs advertised in the UK excluding London 3.89% 7.98% 4.29%
As % of the Job Titles category 4.36% 8.38% 4.60%
Number of salaries quoted 510 2,444 1,113
10th Percentile £45,000 £40,000 £40,000
25th Percentile £55,000 £45,000 £47,500
Median annual salary (50th Percentile) £65,000 £55,000 £60,000
Median % change year-on-year +18.18% -8.33% +4.35%
75th Percentile £80,000 £69,500 £71,250
90th Percentile £95,000 £80,000 £81,250
UK median annual salary £80,000 £62,500 £67,529
% change year-on-year +28.00% -7.45% +0.04%

All Permanent IT Job Vacancies
UK excluding London

For comparison with the information above, the following table provides summary statistics for all permanent IT job vacancies in the UK excluding London. Most job vacancies include a discernible job title that can be normalized. As such, the figures in the second row provide an indication of the number of permanent jobs in our overall sample.

Permanent vacancies in the UK excluding London with a recognized job title 30,736 52,765 32,139
% of permanent jobs with a recognized job title 89.30% 95.21% 93.34%
Number of salaries quoted 17,476 30,933 24,084
10th Percentile £26,750 £30,000 £28,250
25th Percentile £32,500 £38,620 £38,750
Median annual salary (50th Percentile) £47,500 £50,000 £52,500
Median % change year-on-year -5.00% -4.76% -
75th Percentile £65,000 £65,000 £68,750
90th Percentile £80,000 £80,000 £80,000
UK median annual salary £55,000 £55,000 £60,000
% change year-on-year - -8.33% -

Software Engineer
Job Vacancy Trend in the UK excluding London

Job postings that featured Software Engineer in the job title as a proportion of all IT jobs advertised in the UK excluding London.
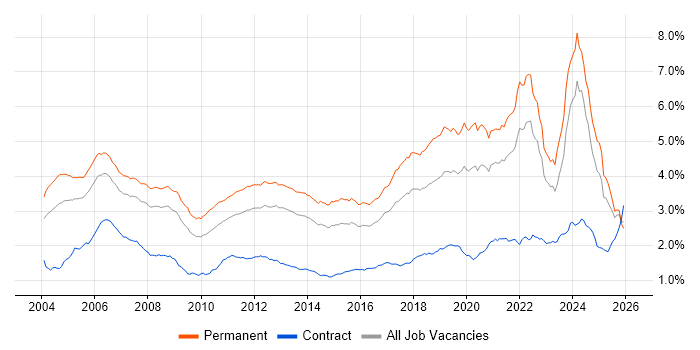
Job vacancy trend for Software Engineer in the UK excluding London

Software Engineer
Salary Trend in the UK excluding London

Salary distribution trend for Software Engineer job vacancies in the UK excluding London.

Salary distribution trend for Software Engineer job vacancies in the UK excluding London

Software Engineer
Salary Histogram in the UK excluding London

Salary distribution for jobs citing Software Engineer in the UK excluding London over the 6 months to 18 September 2025.

Salary histogram for Software Engineer in the UK excluding London

Software Engineer
Job Locations in the UK excluding London

The table below looks at the demand and provides a guide to the median salaries quoted in IT jobs citing Software Engineer within the UK excluding London region over the 6 months to 18 September 2025. The 'Rank Change' column provides an indication of the change in demand within each location based on the same 6 month period last year.

Location Rank Change
on Same Period
Last Year
Matching
Permanent
IT Job Ads
Median Salary
Past 6 Months
Median Salary
% Change
on Same Period
Last Year
Live
Jobs
North of England -26 469 £70,000 +25.56% 193
North West -13 387 £75,000 +25.00% 104
Scotland -15 298 £64,500 +7.50% 55
South East -91 219 £70,000 +27.27% 204
South West -36 146 £65,000 +13.04% 92
Midlands -67 146 £65,000 +30.00% 92
East Midlands -37 79 £67,500 +38.46% 33
West Midlands -54 69 £62,500 +4.17% 58
East of England -106 53 £65,000 - 123
Yorkshire -80 52 £62,500 +25.00% 68
North East -21 30 £56,500 +2.73% 24
Wales -39 12 £55,000 -8.33% 20
Software Engineer
UK

Software Engineer Skill Set
Top 30 Co-occurring Skills and Capabilities in the UK excluding London

For the 6 months to 18 September 2025, Software Engineer job roles required the following skills and capabilities in order of popularity. The figures indicate the absolute number co-occurrences and as a proportion of all permanent job ads across the UK excluding London region featuring Software Engineer in the job title.

1 1,333 (99.48%) Software Engineering
2 867 (64.70%) Agile
3 733 (54.70%) Java
4 678 (50.60%) AWS
5 639 (47.69%) Inclusion and Diversity
6 569 (42.46%) Finance
7 562 (41.94%) Azure
8 561 (41.87%) JavaScript
9 553 (41.27%) Microservices
10 537 (40.07%) CI/CD
11 456 (34.03%) SDLC
12 441 (32.91%) React
13 421 (31.42%) SQL
14 403 (30.07%) Full-Stack Development
15 401 (29.93%) Spring
16 393 (29.33%) Kubernetes
17 388 (28.96%) DevOps
18 382 (28.51%) GCP
19 378 (28.21%) Banking
20 374 (27.91%) Mentoring
21 362 (27.01%) Python
22 353 (26.34%) Docker
23 350 (26.12%) Spring Boot
24 348 (25.97%) Kafka
25 337 (25.15%) Machine Learning
26 321 (23.96%) Test Automation
27 304 (22.69%) Containerisation
28 302 (22.54%) C++
29 290 (21.64%) HTML
30 286 (21.34%) .NET

Software Engineer Skill Set
Co-occurring Skills and Capabilities in the UK excluding London by Category

The follow tables expand on the table above by listing co-occurrences grouped by category. The same employment type, locality and period is covered with up to 20 co-occurrences shown in each of the following categories:

Application Platforms
1 165 (12.31%) Confluence
2 25 (1.87%) Apache Spark
3 16 (1.19%) Apache
4 8 (0.60%) Camunda
4 8 (0.60%) Oracle Workflow
5 7 (0.52%) CMS
6 4 (0.30%) Apache Airflow
6 4 (0.30%) Cloud Foundry
6 4 (0.30%) Tomcat
7 3 (0.22%) FactoryTalk
7 3 (0.22%) WinCC
8 2 (0.15%) ArchestrA
9 1 (0.075%) Adobe Experience Manager
9 1 (0.075%) Apache Solr
9 1 (0.075%) ColdFusion
9 1 (0.075%) Headless CMS
Applications
1 8 (0.60%) Simulink
2 4 (0.30%) Chatbot
3 2 (0.15%) Microsoft Excel
4 1 (0.075%) GNU Octave
4 1 (0.075%) Photoshop
4 1 (0.075%) Trello
Business Applications
1 7 (0.52%) Q-Pulse
2 1 (0.075%) BASE24
2 1 (0.075%) Payment Gateway
2 1 (0.075%) Shopify
Cloud Services
1 678 (50.60%) AWS
2 562 (41.94%) Azure
3 382 (28.51%) GCP
4 40 (2.99%) GitHub
5 37 (2.76%) Serverless
6 35 (2.61%) SaaS
7 29 (2.16%) Amazon S3
8 28 (2.09%) AWS Lambda
9 27 (2.01%) Azure DevOps
10 19 (1.42%) Amazon ECS
11 17 (1.27%) GitHub Actions
12 13 (0.97%) Amazon EKS
13 10 (0.75%) Amazon EC2
13 10 (0.75%) Cloud Computing
14 7 (0.52%) Amazon Bedrock
14 7 (0.52%) Apigee
14 7 (0.52%) Google Kubernetes Engine
14 7 (0.52%) npm
14 7 (0.52%) Yarn
15 6 (0.45%) GitHub Copilot
Communications & Networking
1 46 (3.43%) Wireless
2 35 (2.61%) Software-Defined Radio
3 13 (0.97%) Bluetooth
4 10 (0.75%) Internet
5 9 (0.67%) RS-232
6 7 (0.52%) Modbus
7 6 (0.45%) Ethernet
8 5 (0.37%) WAN
9 4 (0.30%) MQTT
10 3 (0.22%) Profibus
11 2 (0.15%) Broadband
11 2 (0.15%) Firewall
11 2 (0.15%) FTP
11 2 (0.15%) HTTP
11 2 (0.15%) HTTPS
11 2 (0.15%) LoRaWAN
11 2 (0.15%) LTE
11 2 (0.15%) Reverse Proxy
11 2 (0.15%) UWB
11 2 (0.15%) Wi-Fi
Database & Business Intelligence
1 274 (20.45%) SQL Server
2 64 (4.78%) NoSQL
3 48 (3.58%) MongoDB
4 38 (2.84%) PostgreSQL
5 33 (2.46%) Relational Database
6 30 (2.24%) Big Data
7 27 (2.01%) MySQL
8 21 (1.57%) Elasticsearch
9 19 (1.42%) Apache Cassandra
10 17 (1.27%) Amazon Athena
11 16 (1.19%) DynamoDB
12 14 (1.04%) Redis
13 12 (0.90%) KDB
13 12 (0.90%) Kdb+
14 11 (0.82%) Amazon RDS
15 10 (0.75%) Oracle Database
16 9 (0.67%) Amazon Redshift
16 9 (0.67%) Apache Hive
16 9 (0.67%) Apache Iceberg
16 9 (0.67%) RDBMS
Development Applications
1 272 (20.30%) Maven
2 268 (20.00%) GitLab
3 266 (19.85%) JIRA
4 259 (19.33%) Selenium
5 253 (18.88%) SonarQube
5 253 (18.88%) Sonatype Nexus
6 250 (18.66%) Cucumber
7 248 (18.51%) Bitbucket
8 74 (5.52%) Git
9 45 (3.36%) Jenkins
10 31 (2.31%) JUnit
11 18 (1.34%) Cypress.io
12 12 (0.90%) webpack
13 8 (0.60%) Subversion
14 7 (0.52%) Visual Studio
14 7 (0.52%) Vite
15 5 (0.37%) Gradle
16 4 (0.30%) LabVIEW
16 4 (0.30%) Locust
17 3 (0.22%) CircleCI
General
1 639 (47.69%) Inclusion and Diversity
2 569 (42.46%) Finance
3 378 (28.21%) Banking
4 221 (16.49%) Law
5 116 (8.66%) Social Skills
6 109 (8.13%) Retail
7 106 (7.91%) Investment Banking
8 100 (7.46%) Marketing
9 90 (6.72%) Corporate Banking
10 44 (3.28%) Analytical Skills
11 40 (2.99%) Manufacturing
12 22 (1.64%) Legal
13 21 (1.57%) Aerospace
13 21 (1.57%) Electronics
14 19 (1.42%) Public Sector
15 15 (1.12%) Automotive
16 13 (0.97%) Military
17 12 (0.90%) Tech for Good
18 9 (0.67%) Games
18 9 (0.67%) Organisational Skills
Libraries, Frameworks & Software Standards
1 441 (32.91%) React
2 401 (29.93%) Spring
3 350 (26.12%) Spring Boot
4 348 (25.97%) Kafka
5 290 (21.64%) HTML
6 286 (21.34%) .NET
7 284 (21.19%) CSS
8 255 (19.03%) JPA
9 254 (18.96%) Redux
10 214 (15.97%) Node.js
11 181 (13.51%) Hibernate
12 154 (11.49%) RESTful
13 143 (10.67%) REST
14 106 (7.91%) Jest
15 98 (7.31%) HTML5
16 96 (7.16%) CSS3
17 90 (6.72%) Sass
18 84 (6.27%) AngularJS
19 33 (2.46%) .NET Core
20 22 (1.64%) Web Services
Miscellaneous
1 276 (20.60%) Product Ownership
2 251 (18.73%) Enterprise Software
3 177 (13.21%) Self-Motivation
4 172 (12.84%) Cyberattack
4 172 (12.84%) Linux Command Line
5 106 (7.91%) Algorithms
6 103 (7.69%) Cloud Native
7 61 (4.55%) Embedded Systems
8 50 (3.73%) Distributed Systems
9 44 (3.28%) e-Learning
10 36 (2.69%) RISC-V
11 34 (2.54%) MicroBlaze
12 29 (2.16%) Greenfield Project
13 26 (1.94%) Public Cloud
14 22 (1.64%) Reference Data
15 18 (1.34%) IoT
16 12 (0.90%) Manufacturing Execution System
16 12 (0.90%) Mobile App
16 12 (0.90%) Renewable Energy
17 10 (0.75%) ARM Cortex
Operating Systems
1 255 (19.03%) Linux
2 40 (2.99%) Embedded Linux
3 17 (1.27%) Unix
4 12 (0.90%) Windows
5 6 (0.45%) Android
5 6 (0.45%) Apple iOS
6 4 (0.30%) FreeRTOS
7 2 (0.15%) Windows Server
8 1 (0.075%) CentOS
8 1 (0.075%) Debian
8 1 (0.075%) SafeRTOS
Processes & Methodologies
1 1,333 (99.48%) Software Engineering
2 867 (64.70%) Agile
3 553 (41.27%) Microservices
4 537 (40.07%) CI/CD
5 456 (34.03%) SDLC
6 403 (30.07%) Full-Stack Development
7 388 (28.96%) DevOps
8 374 (27.91%) Mentoring
9 337 (25.15%) Machine Learning
10 321 (23.96%) Test Automation
11 304 (22.69%) Containerisation
12 283 (21.12%) User Experience
13 281 (20.97%) Continuous Improvement
14 262 (19.55%) Front End Development
15 256 (19.10%) Performance Optimisation
16 241 (17.99%) TDD
17 209 (15.60%) Scrum
18 200 (14.93%) Data Engineering
19 193 (14.40%) Artificial Intelligence
20 191 (14.25%) Clean Code
Programming Languages
1 733 (54.70%) Java
2 561 (41.87%) JavaScript
3 421 (31.42%) SQL
4 362 (27.01%) Python
5 302 (22.54%) C++
6 213 (15.90%) TypeScript
7 201 (15.00%) Go
8 176 (13.13%) Rust
9 145 (10.82%) C#
10 93 (6.94%) C
11 19 (1.42%) Ruby
12 16 (1.19%) PL/SQL
13 14 (1.04%) MATLAB
14 13 (0.97%) Ada
15 12 (0.90%) Ada 95
16 11 (0.82%) Embedded C
16 11 (0.82%) PHP
17 10 (0.75%) Bash
18 7 (0.52%) Objective-C
18 7 (0.52%) T-SQL
Qualifications
1 275 (20.52%) Security Cleared
2 201 (15.00%) DV Cleared
3 178 (13.28%) AWS Certification
4 176 (13.13%) AWS Certified Developer
5 172 (12.84%) AWS Certified Solutions Architect
6 72 (5.37%) Degree
7 64 (4.78%) SC Cleared
8 24 (1.79%) Computer Science Degree
9 19 (1.42%) BPSS Clearance
10 13 (0.97%) Chartered Engineer
11 10 (0.75%) Master's Degree
12 9 (0.67%) PhD
13 2 (0.15%) Azure Certification
14 1 (0.075%) CREST Certified
14 1 (0.075%) DBS Check
14 1 (0.075%) HND
14 1 (0.075%) Postgraduate
Quality Assurance & Compliance
1 258 (19.25%) QA
2 95 (7.09%) Accessibility
3 15 (1.12%) Data Quality
4 12 (0.90%) ISO/IEC 12207
5 5 (0.37%) JTAG
6 4 (0.30%) IEC 61131
6 4 (0.30%) IEC 61508
6 4 (0.30%) PCI DSS
7 3 (0.22%) GDPR
7 3 (0.22%) ISO 9001
7 3 (0.22%) ISO/IEC 27001
7 3 (0.22%) SOC 2
7 3 (0.22%) WCAG
8 2 (0.15%) ISO 9000
8 2 (0.15%) MISRA
8 2 (0.15%) NIST
9 1 (0.075%) Actionable Recommendations
9 1 (0.075%) DO-178B
9 1 (0.075%) IEC 62304
9 1 (0.075%) ISO 26262
System Software
1 353 (26.34%) Docker
2 61 (4.55%) Firmware
3 44 (3.28%) Embedded Firmware
4 5 (0.37%) HDFS
5 2 (0.15%) Hyper-V
5 2 (0.15%) VMware Infrastructure
Systems Management
1 393 (29.33%) Kubernetes
2 59 (4.40%) Terraform
3 16 (1.19%) Grafana
4 8 (0.60%) Istio
4 8 (0.60%) Kibana
5 6 (0.45%) Ansible
5 6 (0.45%) Single Sign-On
6 4 (0.30%) ITRS Geneos
6 4 (0.30%) Netcool
6 4 (0.30%) Netcool/OMNIbus
6 4 (0.30%) Tivoli
7 3 (0.22%) Prometheus
8 2 (0.15%) Argo
8 2 (0.15%) Graylog
8 2 (0.15%) Progress Chef
9 1 (0.075%) Opsgenie
Vendors
1 246 (18.36%) Solace
2 64 (4.78%) Oracle
3 28 (2.09%) Databricks
4 27 (2.01%) Microsoft
5 21 (1.57%) Splunk
6 18 (1.34%) Dynatrace
7 16 (1.19%) Guidewire
8 14 (1.04%) Google
9 12 (0.90%) ServiceNow
10 10 (0.75%) Ping Identity
11 9 (0.67%) Atlassian
12 7 (0.52%) IBM
13 6 (0.45%) Facebook
13 6 (0.45%) Sage
13 6 (0.45%) Siemens
14 5 (0.37%) Atmel
14 5 (0.37%) Cloudera
14 5 (0.37%) Rockwell
14 5 (0.37%) SAP
15 4 (0.30%) Sybase