BPSS Clearance Jobs in the UK excluding London

Baseline Personnel Security Standard (BPSS) Clearance
UK > UK excluding London

The table below provides summary statistics for permanent job vacancies advertised in the UK excluding London with a requirement for BPSS Clearance qualifications. It includes a benchmarking guide to the salaries offered over the 6 months leading up to 26 July 2024, comparing them to the same period in the previous two years.

6 months to
26 Jul 2024
Same period 2023 Same period 2022
Rank 359 485 634
Rank change year-on-year +126 +149 +9
Permanent jobs citing BPSS Clearance 385 197 250
As % of all permanent jobs advertised in the UK excluding London 0.59% 0.41% 0.32%
As % of the Qualifications category 2.28% 1.08% 0.96%
Number of salaries quoted 294 143 136
10th Percentile £25,750 £24,000 £23,750
25th Percentile £30,133 £37,250 £29,625
Median annual salary (50th Percentile) £52,500 £50,000 £47,500
Median % change year-on-year +5.00% +5.26% -7.32%
75th Percentile £63,750 £70,954 £62,500
90th Percentile £70,000 £82,500 £83,750
UK median annual salary £55,000 £56,000 £50,000
% change year-on-year -1.79% +12.00% -9.09%

All Academic and Professional Certifications
UK excluding London

BPSS Clearance falls under the Academic Qualifications and Professional Certifications category. For comparison with the information above, the following table provides summary statistics for all permanent job vacancies requiring academic qualifications or professional certifications in the UK excluding London.

Permanent vacancies requiring academic qualifications or professional certifications 16,873 18,275 26,124
As % of all permanent jobs advertised in the UK excluding London 25.85% 37.96% 33.36%
Number of salaries quoted 9,460 7,807 11,272
10th Percentile £28,500 £29,000 £28,109
25th Percentile £37,500 £37,500 £36,250
Median annual salary (50th Percentile) £50,000 £52,500 £48,500
Median % change year-on-year -4.76% +8.25% +2.11%
75th Percentile £65,000 £67,500 £63,750
90th Percentile £80,000 £80,000 £77,500
UK median annual salary £55,000 £60,000 £55,000
% change year-on-year -8.33% +9.09% -

BPSS Clearance
Job Vacancy Trend in the UK excluding London

Job postings citing BPSS Clearance as a proportion of all IT jobs advertised in the UK excluding London.
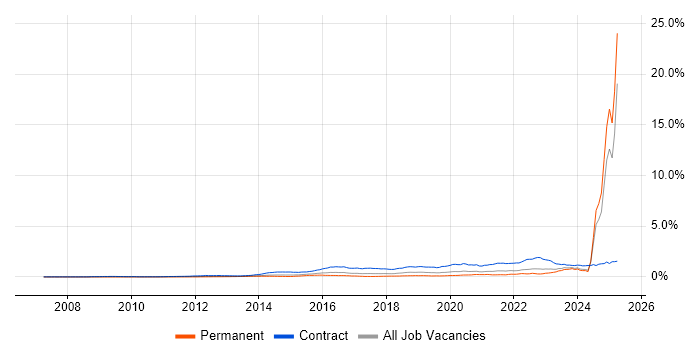
Job vacancy trend for BPSS Clearance in the UK excluding London

BPSS Clearance
Salary Trend in the UK excluding London

3-month moving average salary quoted in jobs citing BPSS Clearance in the UK excluding London.

Salary trend for BPSS Clearance in the UK excluding London

BPSS Clearance
Salary Histogram in the UK excluding London

Salary distribution for jobs citing BPSS Clearance in the UK excluding London over the 6 months to 26 July 2024.

Salary histogram for BPSS Clearance in the UK excluding London

BPSS Clearance
Job Locations in the UK excluding London

The table below looks at the demand and provides a guide to the median salaries quoted in IT jobs citing BPSS Clearance within the UK excluding London region over the 6 months to 26 July 2024. The 'Rank Change' column provides an indication of the change in demand within each location based on the same 6 month period last year.

Location Rank Change
on Same Period
Last Year
Matching
Permanent
IT Job Ads
Median Salary
Past 6 Months
Median Salary
% Change
on Same Period
Last Year
Live
Jobs
South West +73 140 £55,000 +22.22% 25
East of England +68 82 £52,500 - 3
South East +47 65 £50,845 -7.56% 17
Midlands -11 45 £51,500 +3.00% 13
West Midlands +16 35 £60,000 +4.35% 3
North of England -8 30 £28,000 -51.30% 17
North West -14 24 £28,000 -30.00% 13
East Midlands -37 10 £24,811 -50.38% 10
Scotland -47 9 £24,240 -51.52% 6
Wales +16 7 £41,067 -11.13%
Northern Ireland - 7 £28,000 - 1
Yorkshire +52 4 - - 2
North East -17 2 £65,000 -13.33% 2
BPSS Clearance
UK

BPSS Clearance
Co-occurring Skills and Capabilities in the UK excluding London by Category

The follow tables expand on the table above by listing co-occurrences grouped by category. The same employment type, locality and period is covered with up to 20 co-occurrences shown in each of the following categories:

Application Platforms
1 24 (6.23%) Confluence
2 19 (4.94%) Microsoft Exchange
3 18 (4.68%) Exchange Server 2010
4 9 (2.34%) SharePoint
5 6 (1.56%) ArcGIS
6 3 (0.78%) OpenStack
7 2 (0.52%) Anypoint
8 1 (0.26%) Apache
8 1 (0.26%) SharePoint 2010
8 1 (0.26%) SharePoint 2013
8 1 (0.26%) WebLogic
Applications
1 20 (5.19%) Microsoft Office
2 14 (3.64%) Microsoft Excel
2 14 (3.64%) Simulink
3 12 (3.12%) Microsoft Project
4 6 (1.56%) Trello
5 2 (0.52%) Microsoft PowerPoint
5 2 (0.52%) Stateflow
6 1 (0.26%) 1Password
6 1 (0.26%) Acrobat
6 1 (0.26%) Adobe Illustrator
6 1 (0.26%) InDesign
6 1 (0.26%) Photoshop
Business Applications
1 17 (4.42%) Sparx Enterprise Architect
2 9 (2.34%) Primavera
3 3 (0.78%) Maximo
4 1 (0.26%) ContrOCC
4 1 (0.26%) Oracle Applications
Cloud Services
1 82 (21.30%) Azure
2 48 (12.47%) Microsoft 365
3 38 (9.87%) AWS
4 34 (8.83%) Azure DevOps
5 19 (4.94%) GitHub
6 18 (4.68%) Azure Monitor
7 17 (4.42%) GitHub Actions
8 16 (4.16%) IaaS
8 16 (4.16%) PaaS
8 16 (4.16%) SaaS
9 10 (2.60%) Power Platform
10 7 (1.82%) Cloud Computing
11 6 (1.56%) GCP
12 5 (1.30%) OCI
12 5 (1.30%) Slack
13 3 (0.78%) Azure Synapse Analytics
13 3 (0.78%) Entra ID
13 3 (0.78%) Miro
13 3 (0.78%) Snowflake
14 1 (0.26%) Adobe Creative Cloud
Communications & Networking
1 25 (6.49%) Wi-Fi
2 24 (6.23%) Firewall
3 22 (5.71%) VPN
4 13 (3.38%) VLAN
5 11 (2.86%) WAN
6 10 (2.60%) TCP/IP
7 9 (2.34%) 5G
8 7 (1.82%) 4G
8 7 (1.82%) MPLS
9 5 (1.30%) LAN
9 5 (1.30%) SAN
10 4 (1.04%) Ethernet
10 4 (1.04%) Network Security
11 2 (0.52%) 5G NR
11 2 (0.52%) 802.11
11 2 (0.52%) LTE
11 2 (0.52%) Software-Defined Radio
11 2 (0.52%) Wireless
12 1 (0.26%) RS-232
12 1 (0.26%) RS-485
Database & Business Intelligence
1 10 (2.60%) Power BI
2 7 (1.82%) Relational Database
3 6 (1.56%) Big Data
3 6 (1.56%) Snowflake Schema
3 6 (1.56%) Star Schema
3 6 (1.56%) Tableau
4 5 (1.30%) Oracle Reports
5 4 (1.04%) Data Warehouse
6 2 (0.52%) GIS
6 2 (0.52%) Oracle BI Publisher
7 1 (0.26%) Oracle Database
7 1 (0.26%) Oracle Database 11g
7 1 (0.26%) Oracle Database 12c
7 1 (0.26%) Oracle9i Database
7 1 (0.26%) OrientDB
7 1 (0.26%) PostgreSQL
7 1 (0.26%) Redis
Development Applications
1 34 (8.83%) JIRA
2 28 (7.27%) Git
3 24 (6.23%) Bitbucket
3 24 (6.23%) Visual Studio
4 23 (5.97%) Sourcetree
5 15 (3.90%) Rational Rhapsody
5 15 (3.90%) SonarQube
6 14 (3.64%) Rational DOORS
7 5 (1.30%) Rational Team Concert
8 2 (0.52%) Eclipse
8 2 (0.52%) GitLab
8 2 (0.52%) Subversion
9 1 (0.26%) Jenkins
9 1 (0.26%) Postman
9 1 (0.26%) Visual Studio Code
General
1 107 (27.79%) Social Skills
2 42 (10.91%) Finance
3 40 (10.39%) Analytical Skills
4 33 (8.57%) Presentation Skills
5 28 (7.27%) Games
5 28 (7.27%) Organisational Skills
6 25 (6.49%) Retail
7 23 (5.97%) Manufacturing
8 21 (5.45%) Aerospace
9 19 (4.94%) Military
10 16 (4.16%) Inclusion and Diversity
11 13 (3.38%) Public Sector
12 10 (2.60%) Telecoms
13 9 (2.34%) Electronics
14 3 (0.78%) Back Office
14 3 (0.78%) Documentation Skills
14 3 (0.78%) French Language
14 3 (0.78%) Law
14 3 (0.78%) Turkish Language
14 3 (0.78%) Welsh Language
Job Titles
1 56 (14.55%) Senior
2 42 (10.91%) Systems Engineer
3 37 (9.61%) Lead
4 35 (9.09%) Architect
5 32 (8.31%) Developer
6 28 (7.27%) Field Engineer
7 26 (6.75%) Field Service Engineer
8 25 (6.49%) Software Engineer
9 24 (6.23%) Senior Field Engineer
9 24 (6.23%) Senior Field Service Engineer
10 23 (5.97%) 3D Developer
10 23 (5.97%) Games Developer
10 23 (5.97%) Unity 3D Developer
11 22 (5.71%) Mobile Engineer
12 19 (4.94%) Solutions Architect
13 18 (4.68%) Analyst
13 18 (4.68%) Consultant
14 16 (4.16%) Junior
14 16 (4.16%) Support Engineer
15 14 (3.64%) Desktop Support Engineer
Libraries, Frameworks & Software Standards
1 23 (5.97%) Unity (Game Engine)
2 19 (4.94%) .NET
3 18 (4.68%) EDI
4 15 (3.90%) ARM Templates
4 15 (3.90%) Azure Blueprints
5 7 (1.82%) SGML
6 5 (1.30%) OpenMP
7 4 (1.04%) Middleware
8 3 (0.78%) ADO
8 3 (0.78%) OpenACC
9 2 (0.52%) 802.1X
9 2 (0.52%) CSS
9 2 (0.52%) HTML
9 2 (0.52%) Lambda Expressions
9 2 (0.52%) MUnit
9 2 (0.52%) PyTorch
9 2 (0.52%) RAML
9 2 (0.52%) TensorFlow
10 1 (0.26%) Web Services
10 1 (0.26%) XML
Miscellaneous
1 63 (16.36%) Driving Licence
2 39 (10.13%) Self-Motivation
3 32 (8.31%) Management Information System
4 26 (6.75%) Virtual Reality
5 25 (6.49%) Algorithms
6 24 (6.23%) EPoS
7 23 (5.97%) Onboarding
8 8 (2.08%) CMDB
9 6 (1.56%) ARM Cortex
9 6 (1.56%) Data Centre
9 6 (1.56%) IoT
10 5 (1.30%) CUDA
10 5 (1.30%) FPGA
10 5 (1.30%) VHDL
11 4 (1.04%) Cyber Threat
11 4 (1.04%) Product Ownership
12 3 (0.78%) Analytical Mindset
12 3 (0.78%) Augmented Reality
12 3 (0.78%) Distributed Computing
12 3 (0.78%) PCIe
Operating Systems
1 58 (15.06%) Windows
2 19 (4.94%) Linux
3 5 (1.30%) Ubuntu
3 5 (1.30%) Unix
4 4 (1.04%) Windows 10
4 4 (1.04%) Windows Server
5 3 (0.78%) Red Hat Enterprise Linux
5 3 (0.78%) SUSE Linux Enterprise Server
6 2 (0.52%) Android
6 2 (0.52%) Apple iOS
6 2 (0.52%) Mac OS
6 2 (0.52%) VMS
6 2 (0.52%) Windows Server 2012
7 1 (0.26%) Embedded Linux
7 1 (0.26%) Solaris
Processes & Methodologies
1 94 (24.42%) Problem-Solving
2 80 (20.78%) Software Engineering
3 70 (18.18%) DevOps
4 69 (17.92%) Project Management
5 60 (15.58%) ITIL
6 53 (13.77%) UML
7 49 (12.73%) Analytics
8 42 (10.91%) Customer Service
8 42 (10.91%) Cybersecurity
9 41 (10.65%) Agile
9 41 (10.65%) Systems Engineering
10 33 (8.57%) Validation
11 32 (8.31%) Use Case
12 31 (8.05%) Asset Management
12 31 (8.05%) Time Management
13 30 (7.79%) Scrum
14 29 (7.53%) Innovative Thinking
15 26 (6.75%) Break/Fix
15 26 (6.75%) Design Patterns
16 24 (6.23%) Roadmaps
Programming Languages
1 35 (9.09%) C#
2 25 (6.49%) C
3 19 (4.94%) Python
4 17 (4.42%) Ada
5 15 (3.90%) C++
6 11 (2.86%) MATLAB
7 8 (2.08%) R
8 7 (1.82%) Fortran
8 7 (1.82%) SQL
9 6 (1.56%) T-SQL
10 5 (1.30%) Bash
10 5 (1.30%) C-shell
10 5 (1.30%) Java
10 5 (1.30%) PowerShell
11 3 (0.78%) JavaScript
12 2 (0.52%) Apex Code
12 2 (0.52%) Julia
12 2 (0.52%) Rust
13 1 (0.26%) ProC
13 1 (0.26%) Shell Script
Qualifications
1 296 (76.88%) Security Cleared
2 118 (30.65%) SC Cleared
3 116 (30.13%) Degree
4 39 (10.13%) DBS Check
5 17 (4.42%) TOGAF Certification
6 13 (3.38%) Master's Degree
7 12 (3.12%) CompTIA Security+
8 11 (2.86%) Microsoft Certification
9 10 (2.60%) CEH
10 8 (2.08%) APMG
10 8 (2.08%) CTC Cleared
11 6 (1.56%) Azure Certification
11 6 (1.56%) CCNA
11 6 (1.56%) Cisco Certification
11 6 (1.56%) DV Cleared
11 6 (1.56%) IIBA
12 4 (1.04%) PhD
13 3 (0.78%) Network+ Certification
14 2 (0.52%) AWS Certification
14 2 (0.52%) Computer Science Degree
Quality Assurance & Compliance
1 46 (11.95%) SLA
2 22 (5.71%) PCI DSS
3 15 (3.90%) NCSC
4 11 (2.86%) GDPR
5 7 (1.82%) COSHH
5 7 (1.82%) Cyber Essentials
6 5 (1.30%) Accessibility
7 4 (1.04%) Data Quality
7 4 (1.04%) Def Stans
8 3 (0.78%) ISO 9001
8 3 (0.78%) ISO/IEC 20000
8 3 (0.78%) ISO/IEC 27001
8 3 (0.78%) MISRA
9 2 (0.52%) QA
10 1 (0.26%) Disclosure Scotland
10 1 (0.26%) DO-178B
10 1 (0.26%) IEC 61508
10 1 (0.26%) MISRA C
10 1 (0.26%) PMO
System Software
1 41 (10.65%) Firmware
2 22 (5.71%) KVM
3 20 (5.19%) Docker
4 18 (4.68%) Hyper-V
5 5 (1.30%) Embedded Firmware
6 4 (1.04%) Active Directory
7 3 (0.78%) Ceph
7 3 (0.78%) GPFS
7 3 (0.78%) Lustre
7 3 (0.78%) Slurm Workload Manager
8 2 (0.52%) Microsoft Virtual Server
8 2 (0.52%) Virtual Servers
9 1 (0.26%) Oracle RAC
9 1 (0.26%) VMware Infrastructure
9 1 (0.26%) XenApp
9 1 (0.26%) XenDesktop
Systems Management
1 23 (5.97%) Ansible
2 22 (5.71%) Terraform
3 19 (4.94%) Microsoft Intune
4 18 (4.68%) Kubernetes
5 7 (1.82%) FortiGate
6 3 (0.78%) Podman
7 2 (0.52%) Active Directory Federation Services
7 2 (0.52%) SCCM
8 1 (0.26%) AirWatch
8 1 (0.26%) Grafana
8 1 (0.26%) Kibana
8 1 (0.26%) Oracle Enterprise Manager
Vendors
1 127 (32.99%) Microsoft
2 52 (13.51%) Dell
3 41 (10.65%) IBM
4 35 (9.09%) HP
5 24 (6.23%) NetApp
6 17 (4.42%) Sparx
7 13 (3.38%) Cisco
7 13 (3.38%) Sun
8 11 (2.86%) VMware
9 7 (1.82%) Oracle
10 6 (1.56%) Darktrace
10 6 (1.56%) Mitel
10 6 (1.56%) NEC
10 6 (1.56%) Ribbon
11 5 (1.30%) ServiceNow
12 4 (1.04%) MuleSoft
13 3 (0.78%) EMC
13 3 (0.78%) ESRI
13 3 (0.78%) Meraki
14 2 (0.52%) Apple