Java Jobs in the UK excluding London

Java
UK > UK excluding London

The following table provides summary statistics for permanent job vacancies advertised in the UK excluding London with a requirement for Java skills. Included is a benchmarking guide to the salaries offered in vacancies that have cited Java over the 6 months to 7 December 2023 with a comparison to the same period in the previous 2 years.

6 months to
7 Dec 2023
Same period 2022 Same period 2021
Rank 26 18 19
Rank change year-on-year -8 +1 -3
Permanent jobs citing Java 2,647 7,271 6,899
As % of all permanent jobs advertised in the UK excluding London 8.43% 11.06% 10.62%
As % of the Programming Languages category 21.82% 25.71% 22.33%
Number of salaries quoted 1,441 3,481 4,271
10th Percentile £37,750 £38,750 £35,750
25th Percentile £48,750 £46,250 £43,750
Median annual salary (50th Percentile) £61,500 £60,000 £55,000
Median % change year-on-year +2.50% +9.09% -
75th Percentile £77,500 £76,385 £70,200
90th Percentile £87,419 £87,500 £82,500
UK median annual salary £75,000 £72,500 £70,000
% change year-on-year +3.45% +3.57% +7.69%

All Programming Languages
UK excluding London

Java is in the Programming Languages category. The following table is for comparison with the above and provides summary statistics for all permanent job vacancies advertised in the UK excluding London with a requirement for coding skills.

Permanent vacancies with a requirement for coding skills 12,133 28,285 30,901
As % of all permanent jobs advertised in the UK excluding London 38.62% 43.01% 47.55%
Number of salaries quoted 8,772 17,250 22,606
10th Percentile £35,000 £34,825 £32,500
25th Percentile £43,000 £42,500 £39,000
Median annual salary (50th Percentile) £55,000 £55,000 £50,000
Median % change year-on-year - +10.00% -
75th Percentile £70,000 £70,000 £65,000
90th Percentile £82,500 £83,750 £77,500
UK median annual salary £65,000 £65,000 £60,000
% change year-on-year - +8.33% +9.09%

Java
Job Vacancy Trend in the UK excluding London

Job postings citing Java as a proportion of all IT jobs advertised in the UK excluding London.
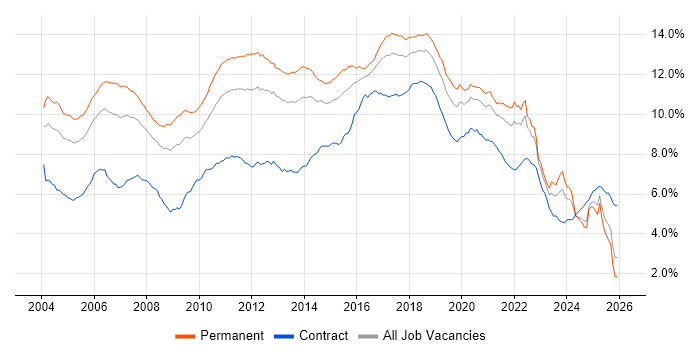
Job vacancy trend for Java in the UK excluding London

Java
Salary Trend in the UK excluding London

3-month moving average salary quoted in jobs citing Java in the UK excluding London.

Salary trend for Java in the UK excluding London

Java
Salary Histogram in the UK excluding London

Salary distribution for jobs citing Java in the UK excluding London over the 6 months to 7 December 2023.

Salary histogram for Java in the UK excluding London

Java
Job Locations in the UK excluding London

The table below looks at the demand and provides a guide to the median salaries quoted in IT jobs citing Java within the UK excluding London region over the 6 months to 7 December 2023. The 'Rank Change' column provides an indication of the change in demand within each location based on the same 6 month period last year.

Location Rank Change
on Same Period
Last Year
Matching
Permanent
IT Job Ads
Median Salary
Past 6 Months
Median Salary
% Change
on Same Period
Last Year
Live
Jobs
North of England -10 643 £62,500 +4.17% 203
South West -3 566 £62,500 +8.70% 140
Scotland +1 487 £66,000 +1.54% 68
South East -8 475 £60,000 -4.00% 306
North West +1 373 £61,250 +2.08% 121
Yorkshire -13 235 £65,351 +8.92% 60
Midlands -40 206 £57,500 -2.95% 92
Wales +13 134 £49,355 -16.58% 20
West Midlands -41 127 £57,500 -4.17% 64
Northern Ireland -8 86 £72,500 +20.83% 27
East Midlands -37 78 £60,000 +9.09% 28
East of England -41 66 £75,000 +15.38% 88
North East -13 35 £61,500 -1.60% 24
Java
UK

Java
Co-occurring Skills and Capabilities in the UK excluding London by Category

The follow tables expand on the table above by listing co-occurrences grouped by category. The same employment type, locality and period is covered with up to 20 co-occurrences shown in each of the following categories:

Application Platforms
1 90 (3.40%) Apache Spark
1 90 (3.40%) JBoss
2 89 (3.36%) WebLogic
3 85 (3.21%) Red Hat Fuse
4 49 (1.85%) IIS
5 47 (1.78%) Confluence
6 40 (1.51%) Tomcat
7 39 (1.47%) WebSphere
8 33 (1.25%) Apache
9 20 (0.76%) FileNet
10 18 (0.68%) Captiva
11 17 (0.64%) WebSphere Application Server
12 16 (0.60%) OpenStack
13 15 (0.57%) Oracle SOA Suite
14 13 (0.49%) Jetty
14 13 (0.49%) Jupyter
15 9 (0.34%) CMS
16 8 (0.30%) Apache Airflow
17 6 (0.23%) nginx
18 5 (0.19%) Mule
Applications
1 7 (0.26%) Microsoft Office
2 6 (0.23%) Adobe XD
2 6 (0.23%) Simulink
3 5 (0.19%) SOLIDWORKS
4 4 (0.15%) Adobe Premiere
5 2 (0.076%) CANalyzer
5 2 (0.076%) Microsoft Excel
5 2 (0.076%) Microsoft Project
6 1 (0.038%) Adobe Creative Suite
6 1 (0.038%) CATIA
6 1 (0.038%) InDesign
6 1 (0.038%) MS Visio
6 1 (0.038%) Photoshop
6 1 (0.038%) Spreadsheet
Business Applications
1 8 (0.30%) SAP S/4HANA
2 2 (0.076%) Magento
2 2 (0.076%) Oracle Cash Management
2 2 (0.076%) Payment Gateway
2 2 (0.076%) Shopify
2 2 (0.076%) Temenos T24
3 1 (0.038%) Distributed Ledger
3 1 (0.038%) Dynamics CRM
3 1 (0.038%) Oracle Applications
3 1 (0.038%) Oracle EBS
3 1 (0.038%) SAP ERP
3 1 (0.038%) SAP Hybris
3 1 (0.038%) Sparx Enterprise Architect
Cloud Services
1 1,072 (40.50%) AWS
2 599 (22.63%) Azure
3 393 (14.85%) Serverless
4 326 (12.32%) GCP
5 214 (8.08%) OpenShift
6 159 (6.01%) SaaS
7 149 (5.63%) GitHub
8 74 (2.80%) Amazon EKS
9 72 (2.72%) Amazon EC2
10 69 (2.61%) AWS Lambda
11 62 (2.34%) Amazon S3
12 61 (2.30%) Azure DevOps
13 49 (1.85%) Cloud Computing
14 37 (1.40%) Amazon ECS
15 34 (1.28%) PaaS
16 24 (0.91%) Amazon SQS
16 24 (0.91%) Google Kubernetes Engine
17 23 (0.87%) Apigee
18 22 (0.83%) AWS CloudFormation
19 21 (0.79%) Amazon CloudWatch
Communications & Networking
1 85 (3.21%) HTTP
2 84 (3.17%) DNS
3 77 (2.91%) TCP/IP
4 66 (2.49%) DHCP
5 50 (1.89%) Internet
6 25 (0.94%) WAN
7 22 (0.83%) Firewall
8 9 (0.34%) AMQP
8 9 (0.34%) Wireless
9 7 (0.26%) FTP
9 7 (0.26%) SMTP
10 6 (0.23%) VPN
11 4 (0.15%) DSL
11 4 (0.15%) Network Security
11 4 (0.15%) Software-Defined Networking
11 4 (0.15%) SSH
12 3 (0.11%) Kerberos
12 3 (0.11%) Modbus
12 3 (0.11%) SSL
13 2 (0.076%) Ethernet
Database & Business Intelligence
1 192 (7.25%) Relational Database
2 187 (7.06%) Big Data
3 160 (6.04%) Elasticsearch
4 150 (5.67%) MySQL
5 142 (5.36%) NoSQL
6 127 (4.80%) PostgreSQL
7 115 (4.34%) SQL Server
8 112 (4.23%) Oracle Database
9 108 (4.08%) MongoDB
10 94 (3.55%) RDBMS
11 68 (2.57%) Amazon RDS
12 66 (2.49%) Hadoop
13 34 (1.28%) Data Warehouse
14 31 (1.17%) Redis
15 29 (1.10%) BigQuery
15 29 (1.10%) Oracle Reports
16 28 (1.06%) Data Lake
17 26 (0.98%) DynamoDB
18 20 (0.76%) JasperReports
19 18 (0.68%) Apache Hive
Development Applications
1 540 (20.40%) Git
2 401 (15.15%) Jenkins
3 203 (7.67%) JIRA
4 163 (6.16%) Selenium
5 161 (6.08%) Maven
6 137 (5.18%) GitLab
7 129 (4.87%) Cucumber
8 122 (4.61%) IntelliJ
9 73 (2.76%) Cypress.io
10 65 (2.46%) JUnit
11 64 (2.42%) Sonatype Nexus
12 60 (2.27%) SonarQube
13 39 (1.47%) Bitbucket
14 38 (1.44%) Oracle Forms
15 35 (1.32%) Oracle APEX
16 34 (1.28%) Artifactory
17 31 (1.17%) Spinnaker
18 30 (1.13%) Gradle
18 30 (1.13%) JDeveloper
19 28 (1.06%) JMeter
General
1 642 (24.25%) Finance
2 481 (18.17%) Social Skills
3 322 (12.16%) Inclusion and Diversity
4 312 (11.79%) Banking
5 212 (8.01%) Public Sector
6 183 (6.91%) Analytical Skills
7 149 (5.63%) Law
8 148 (5.59%) Police
9 115 (4.34%) Aerospace
10 102 (3.85%) Marketing
11 93 (3.51%) Retail
12 71 (2.68%) Legal
13 36 (1.36%) Manufacturing
14 35 (1.32%) Telecoms
15 34 (1.28%) Financial Institution
16 33 (1.25%) Retail Banking
17 30 (1.13%) Aviation
18 29 (1.10%) Tech for Good
19 24 (0.91%) Electronics
20 22 (0.83%) Presentation Skills
Job Titles
1 954 (36.04%) Software Engineer
2 709 (26.79%) Developer
3 659 (24.90%) Senior
4 409 (15.45%) Java Developer
5 392 (14.81%) Java Engineer
6 331 (12.50%) Java Software Engineer
7 244 (9.22%) Senior Software Engineer
8 239 (9.03%) Senior Developer
9 209 (7.90%) Lead
10 176 (6.65%) Architect
11 144 (5.44%) Senior Java Developer
12 134 (5.06%) Analyst
13 125 (4.72%) DevOps Engineer
14 110 (4.16%) Solutions Architect
15 107 (4.04%) Applications Support
16 100 (3.78%) Support Analyst
17 98 (3.70%) Applications Support Analyst
18 95 (3.59%) Software Developer
19 89 (3.36%) Lead Software Engineer
20 88 (3.32%) Senior Java Engineer
Libraries, Frameworks & Software Standards
1 795 (30.03%) Spring
2 521 (19.68%) React
3 399 (15.07%) Spring Boot
4 314 (11.86%) AngularJS
5 288 (10.88%) Node.js
6 287 (10.84%) REST
7 282 (10.65%) HTML
8 260 (9.82%) J2EE
9 226 (8.54%) .NET
10 217 (8.20%) Kafka
11 208 (7.86%) RESTful
12 206 (7.78%) Web Services
13 199 (7.52%) XML
14 194 (7.33%) CSS
15 182 (6.88%) Hibernate
15 182 (6.88%) JSON
16 166 (6.27%) SOAP
17 165 (6.23%) Java EE
18 153 (5.78%) Ruby on Rails
19 104 (3.93%) JPA
Miscellaneous
1 125 (4.72%) Product Ownership
2 116 (4.38%) Public Cloud
3 106 (4.00%) Algorithms
4 80 (3.02%) Distributed Systems
5 78 (2.95%) Private Cloud
6 71 (2.68%) Self-Motivation
7 70 (2.64%) Cloud Native
8 57 (2.15%) Cyberattack
9 56 (2.12%) Greenfield Project
10 52 (1.96%) Hybrid Cloud
11 36 (1.36%) Robotics
12 33 (1.25%) Enterprise Software
13 31 (1.17%) Linux Command Line
13 31 (1.17%) Mobile App
14 29 (1.10%) Data Structures
15 28 (1.06%) Management Information System
16 27 (1.02%) Legacy Systems
17 24 (0.91%) Blockchain
18 23 (0.87%) Clustering
19 22 (0.83%) Online Banking
Operating Systems
1 461 (17.42%) Linux
2 219 (8.27%) Windows
3 169 (6.38%) Unix
4 89 (3.36%) Android
5 80 (3.02%) Red Hat Enterprise Linux
6 43 (1.62%) Mac OS
7 32 (1.21%) Apple iOS
8 27 (1.02%) Windows Server
9 15 (0.57%) Ubuntu
10 5 (0.19%) CentOS
10 5 (0.19%) Solaris
11 4 (0.15%) Windows 10
12 2 (0.076%) VMS
13 1 (0.038%) Debian
13 1 (0.038%) Embedded Linux
13 1 (0.038%) FreeBSD
13 1 (0.038%) Mac OS X
13 1 (0.038%) VxWorks
13 1 (0.038%) Windows Server 2008
13 1 (0.038%) Windows Server 2012
Processes & Methodologies
1 1,341 (50.66%) Agile
2 1,233 (46.58%) Software Engineering
3 833 (31.47%) Problem-Solving
4 813 (30.71%) Microservices
5 709 (26.79%) DevOps
6 677 (25.58%) Actionable Insight
7 555 (20.97%) CI/CD
8 528 (19.95%) Mentoring
9 468 (17.68%) Containerisation
10 425 (16.06%) Design Patterns
11 404 (15.26%) SDLC
12 384 (14.51%) Continuous Integration
13 347 (13.11%) Unit Testing
14 295 (11.14%) Test Automation
15 290 (10.96%) Scrum
16 277 (10.46%) TDD
17 271 (10.24%) Code Quality
18 250 (9.44%) Coaching
19 237 (8.95%) Clean Code
20 233 (8.80%) Full Stack Development
Programming Languages
1 1,141 (43.11%) Python
2 729 (27.54%) JavaScript
3 580 (21.91%) SQL
4 468 (17.68%) C#
5 276 (10.43%) Ruby
6 259 (9.78%) C++
7 254 (9.60%) Bash
8 200 (7.56%) Go
9 165 (6.23%) PowerShell
10 154 (5.82%) TypeScript
11 120 (4.53%) Perl
12 107 (4.04%) C
13 97 (3.66%) Shell Script
14 83 (3.14%) Scala
15 75 (2.83%) Kotlin
16 65 (2.46%) PL/SQL
17 51 (1.93%) Rust
18 42 (1.59%) PHP
19 33 (1.25%) Groovy
20 26 (0.98%) R
Qualifications
1 905 (34.19%) Security Cleared
2 652 (24.63%) SC Cleared
3 276 (10.43%) Degree
4 210 (7.93%) DV Cleared
5 134 (5.06%) Computer Science Degree
6 55 (2.08%) AWS Certification
7 26 (0.98%) AWS Certified Solutions Architect
8 25 (0.94%) AWS Certified Developer
9 24 (0.91%) AWS Certified Cloud Practitioner
10 22 (0.83%) BPSS Clearance
11 19 (0.72%) OCP
11 19 (0.72%) Oracle Certification
11 19 (0.72%) PhD
12 18 (0.68%) Azure Certification
13 17 (0.64%) Master's Degree
14 16 (0.60%) ITIL Certification
15 10 (0.38%) ISTQB
16 6 (0.23%) APMP
17 4 (0.15%) Sun Certification
18 2 (0.076%) ISEB
Quality Assurance & Compliance
1 257 (9.71%) QA
2 89 (3.36%) SLA
3 28 (1.06%) SEPA
4 25 (0.94%) Accessibility
5 20 (0.76%) GDPR
6 15 (0.57%) ISO 20022
7 7 (0.26%) Data Quality
8 5 (0.19%) Software Quality Assurance
9 4 (0.15%) ISO 9001
9 4 (0.15%) NCSC
10 3 (0.11%) GMP
10 3 (0.11%) IEC 61508
10 3 (0.11%) PCI DSS
11 2 (0.076%) California Consumer Privacy Act
11 2 (0.076%) Government Security Classifications
11 2 (0.076%) HIPAA
11 2 (0.076%) ISO 26262
11 2 (0.076%) ISO/IEC 27001
11 2 (0.076%) Sarbanes-Oxley
12 1 (0.038%) Def Stans
System Software
1 644 (24.33%) Docker
2 77 (2.91%) Hyper-V
3 69 (2.61%) VMware Infrastructure
4 23 (0.87%) VMware NSX
5 20 (0.76%) Active Directory
6 9 (0.34%) Firmware
7 8 (0.30%) HDFS
8 3 (0.11%) Oracle RAC
9 2 (0.076%) Apache ZooKeeper
9 2 (0.076%) Ceph
9 2 (0.076%) Embedded Firmware
9 2 (0.076%) Kamailio
9 2 (0.076%) NFS
9 2 (0.076%) OpenSIPS
9 2 (0.076%) Postfix
9 2 (0.076%) Virtual Machines
9 2 (0.076%) Virtual Servers
9 2 (0.076%) vSphere
10 1 (0.038%) QEMU
10 1 (0.038%) Virtual Desktop
Systems Management
1 617 (23.31%) Kubernetes
2 201 (7.59%) Ansible
3 173 (6.54%) Terraform
4 100 (3.78%) Puppet
5 83 (3.14%) Single Sign-On
6 79 (2.98%) OpenSSO
7 24 (0.91%) AirWatch
7 24 (0.91%) Grafana
8 22 (0.83%) Progress Chef
9 15 (0.57%) Kustomize
10 14 (0.53%) Istio
11 13 (0.49%) Packer
12 8 (0.30%) Prometheus
13 6 (0.23%) HP Quality Center
13 6 (0.23%) Nagios
14 5 (0.19%) Jamf Pro
14 5 (0.19%) Kibana
15 3 (0.11%) Data Guard
15 3 (0.11%) Oracle RMAN
16 2 (0.076%) ZABBIX
Vendors
1 361 (13.64%) Oracle
2 124 (4.68%) Microsoft
3 93 (3.51%) VMware
4 87 (3.29%) Google
5 82 (3.10%) Red Hat
6 63 (2.38%) IBM
7 55 (2.08%) Remedy
8 45 (1.70%) SAP
9 41 (1.55%) ServiceNow
10 38 (1.44%) Splunk
11 31 (1.17%) Dynatrace
12 27 (1.02%) Databricks
13 24 (0.91%) Atlassian
14 22 (0.83%) Pega
15 21 (0.79%) AppDynamics
16 19 (0.72%) Salesforce
17 18 (0.68%) Kofax
18 16 (0.60%) WSO2
19 15 (0.57%) Adobe
19 15 (0.57%) Confluent