Virtual Reality Jobs with Work from Home Options

Virtual Reality (VR)
UK > Work from Home

The table below looks at the prevalence of the term Virtual Reality in permanent job vacancies with an option to work from home (WFH). Included is a benchmarking guide to the salaries offered in vacancies that have cited Virtual Reality over the 6 months to 29 April 2024 with a comparison to the same period over the previous 2 years.

6 months to
29 Apr 2024
Same period 2023 Same period 2022
Rank 549 562 561
Rank change year-on-year +13 -1 -105
Permanent jobs citing Virtual Reality 42 107 293
As % of all permanent jobs with a WFH option 0.12% 0.25% 0.43%
As % of the Miscellaneous category 0.35% 0.65% 0.94%
Number of salaries quoted 33 63 66
10th Percentile £33,250 £42,500 £31,000
25th Percentile £63,750 £55,000 £41,250
Median annual salary (50th Percentile) £75,000 £82,500 £60,000
Median % change year-on-year -9.09% +37.50% +20.00%
75th Percentile £76,250 £115,000 £92,813
90th Percentile £87,000 £127,000 £113,750
UK median annual salary £50,000 £70,000 £60,000
% change year-on-year -28.57% +16.67% +23.08%

All Generic Skills
Work from Home

Virtual Reality is in the General and Transferable Skills category. The following table is for comparison with the above and provides summary statistics for all permanent job vacancies with a WFH option and a requirement for generic IT skills.

Permanent vacancies with a requirement for generic IT skills 12,005 16,466 31,198
As % of all permanent jobs with a WFH option 35.51% 38.50% 46.17%
Number of salaries quoted 9,233 11,897 16,786
10th Percentile £32,500 £39,000 £37,500
25th Percentile £42,500 £48,750 £47,500
Median annual salary (50th Percentile) £59,000 £65,000 £65,000
Median % change year-on-year -9.23% - +13.04%
75th Percentile £78,005 £86,250 £83,750
90th Percentile £100,000 £107,500 £100,000
UK median annual salary £55,000 £65,000 £62,500
% change year-on-year -15.38% +4.00% +4.17%

Virtual Reality
Trend for Jobs with a WFH Option

Job vacancies with a work from home option citing Virtual Reality as a proportion of all IT jobs advertised.
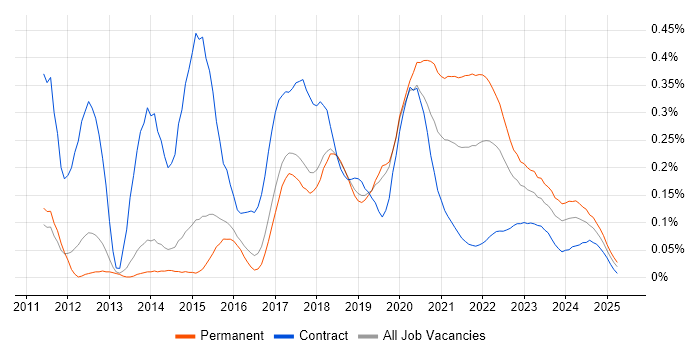
Virtual Reality trend for jobs with a WFH option

Virtual Reality
Salary Trend for Jobs with a WFH Option

3-month moving average salary quoted in job vacancies with a work from home option citing Virtual Reality.

Virtual Reality salary trend for jobs with a WFH option

Virtual Reality
Salary Histogram for Jobs with a WFH Option

Salary distribution for jobs with a work from home option citing Virtual Reality over the 6 months to 29 April 2024.

Virtual Reality salary histogram for jobs with a WFH option

Virtual Reality
Co-occurring Skills and Capabilities with WFH Options by Category

The follow tables expand on the table above by listing co-occurrences grouped by category. The same employment type, locality and period is covered with up to 20 co-occurrences shown in each of the following categories:

Application Platforms
1 1 (2.38%) Apache Spark
1 1 (2.38%) IIS
1 1 (2.38%) WordPress
Applications
1 1 (2.38%) Sketch
Cloud Services
1 10 (23.81%) GitHub
2 4 (9.52%) Cloud Computing
2 4 (9.52%) Dynamics 365
3 1 (2.38%) AWS
3 1 (2.38%) Azure
3 1 (2.38%) Azure DevOps
3 1 (2.38%) Figma
Database & Business Intelligence
1 1 (2.38%) Big Data
1 1 (2.38%) MongoDB
1 1 (2.38%) MySQL
1 1 (2.38%) NoSQL
1 1 (2.38%) SQL Server
Development Applications
1 3 (7.14%) JIRA
2 1 (2.38%) Git
2 1 (2.38%) Visual Studio
General
1 10 (23.81%) Inclusion and Diversity
2 9 (21.43%) Games
2 9 (21.43%) Multimedia
2 9 (21.43%) Social Skills
3 8 (19.05%) Finance
4 7 (16.67%) Analytical Skills
5 4 (9.52%) Manufacturing
5 4 (9.52%) Military
6 3 (7.14%) Legal
7 2 (4.76%) Aviation
7 2 (4.76%) Law
8 1 (2.38%) Health Technology
8 1 (2.38%) Retail
Job Titles
1 20 (47.62%) Developer
2 9 (21.43%) 3D Developer
2 9 (21.43%) JavaScript Developer
3 8 (19.05%) Lead
4 4 (9.52%) Analyst
4 4 (9.52%) Consultant
4 4 (9.52%) Lead Developer
4 4 (9.52%) Lead Software Developer
4 4 (9.52%) Software Developer
5 3 (7.14%) Procurement Analyst
6 2 (4.76%) C# Programmer
6 2 (4.76%) Engineering Manager
6 2 (4.76%) PHP Developer
6 2 (4.76%) Programmer
6 2 (4.76%) Project Manager
6 2 (4.76%) Research Manager
6 2 (4.76%) Software Engineering Team Leader
6 2 (4.76%) Software Team Leader
6 2 (4.76%) Team Leader
6 2 (4.76%) Technical Leader
Libraries, Frameworks & Software Standards
1 12 (28.57%) CSS
2 11 (26.19%) React
3 10 (23.81%) Node.js
4 9 (21.43%) WebGL
5 3 (7.14%) HTML
6 2 (4.76%) .NET
6 2 (4.76%) Unity (Game Engine)
6 2 (4.76%) Unreal Engine
7 1 (2.38%) AngularJS
7 1 (2.38%) Apache NiFi
7 1 (2.38%) jQuery
7 1 (2.38%) Kafka
7 1 (2.38%) PyTorch
7 1 (2.38%) Smart Contracts
7 1 (2.38%) Twitter Bootstrap
7 1 (2.38%) Vue
Miscellaneous
1 24 (57.14%) Augmented Reality
2 10 (23.81%) Algorithms
3 9 (21.43%) Data Structures
4 6 (14.29%) Over-the-Top Content
5 3 (7.14%) Blockchain
5 3 (7.14%) Client/Server
5 3 (7.14%) IoT
5 3 (7.14%) Robotics
6 2 (4.76%) Oculus
7 1 (2.38%) CUDA
7 1 (2.38%) e-Learning
7 1 (2.38%) Mixed Reality
7 1 (2.38%) Mobile App
Operating Systems
1 1 (2.38%) Android
Processes & Methodologies
1 13 (30.95%) Agile
1 13 (30.95%) Visualisation
2 12 (28.57%) Mentoring
2 12 (28.57%) Open Source
2 12 (28.57%) Software Engineering
3 9 (21.43%) Data Visualisation
3 9 (21.43%) Project Management
4 8 (19.05%) SDLC
5 7 (16.67%) Problem-Solving
6 6 (14.29%) Parallel Processing
6 6 (14.29%) Synthetic Environment
6 6 (14.29%) Technical Leadership
7 5 (11.90%) Computer Science
7 5 (11.90%) Situational Awareness
7 5 (11.90%) Stakeholder Management
8 4 (9.52%) Systems Engineering
8 4 (9.52%) Validation
8 4 (9.52%) Verification and Validation
9 3 (7.14%) Supply Chain Management
9 3 (7.14%) Technical Architecture
Programming Languages
1 12 (28.57%) JavaScript
2 10 (23.81%) TypeScript
3 9 (21.43%) C#
4 6 (14.29%) Python
5 5 (11.90%) C++
6 4 (9.52%) C
7 3 (7.14%) Java
7 3 (7.14%) PHP
8 2 (4.76%) SQL
9 1 (2.38%) T-SQL
Qualifications
1 9 (21.43%) Security Cleared
2 6 (14.29%) Degree
3 4 (9.52%) BPSS Clearance
4 3 (7.14%) DV Cleared
5 2 (4.76%) Computer Science Degree
5 2 (4.76%) Master's Degree
5 2 (4.76%) SC Cleared
6 1 (2.38%) Postgraduate
Quality Assurance & Compliance
1 1 (2.38%) QA
System Software
1 1 (2.38%) Docker
Vendors
1 4 (9.52%) Microsoft
2 1 (2.38%) Adobe