Hybrid/Remote Artificial Intelligence Job Trends

Artificial Intelligence (AI)
UK > Work from Home

The table below provides summary statistics and salary benchmarking for remote or hybrid work requiring Artificial Intelligence skills. It covers vacancies from the 6 months leading up to 17 September 2025, with comparisons to the same periods in the previous two years.

6 months to
17 Sep 2025
Same period 2024 Same period 2023
Rank 6 50 79
Rank change year-on-year +44 +29 +22
Permanent jobs citing Artificial Intelligence 3,031 1,104 943
As % of all permanent jobs with a WFH option 18.66% 4.73% 3.80%
As % of the Processes & Methodologies category 20.03% 5.39% 3.98%
Number of salaries quoted 668 563 513
10th Percentile £25,142 £40,000 £47,500
25th Percentile £40,438 £51,875 £56,250
Median annual salary (50th Percentile) £65,000 £75,000 £75,000
Median % change year-on-year -13.33% - +7.14%
75th Percentile £95,000 £86,250 £90,000
90th Percentile £122,500 £104,750 £105,000
UK median annual salary £70,000 £75,000 £75,000
% change year-on-year -6.67% - +7.14%

All Process and Methodology Skills
Work from Home

Artificial Intelligence falls under the Processes and Methodologies category. For comparison with the information above, the following table provides summary statistics for all permanent job vacancies with remote or hybrid options requiring process or methodology skills.

Permanent vacancies with a requirement for process or methodology skills 15,130 20,481 23,676
As % of all permanent jobs with a WFH option 93.15% 87.75% 95.30%
Number of salaries quoted 8,605 12,629 19,503
10th Percentile £30,000 £35,500 £37,500
25th Percentile £40,750 £45,000 £47,500
Median annual salary (50th Percentile) £60,000 £60,000 £62,500
Median % change year-on-year - -4.00% +1.63%
75th Percentile £78,750 £80,000 £81,250
90th Percentile £100,000 £100,000 £98,950
UK median annual salary £55,000 £57,500 £60,000
% change year-on-year -4.35% -4.17% -

Artificial Intelligence
Trend for Jobs with a WFH Option

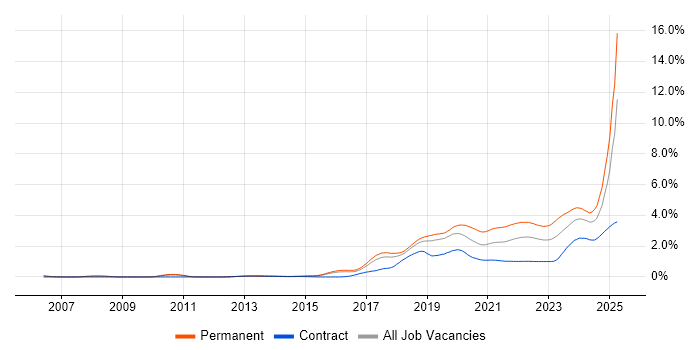
Job vacancies with remote working options citing Artificial Intelligence as a proportion of all IT jobs advertised.

Artificial Intelligence trend for jobs with Hybrid/Remote/WFH options

Artificial Intelligence
Salary Trend for Jobs with Hybrid Work Options

Salary distribution trend for jobs with remote work options citing Artificial Intelligence.

Salary distribution trend for jobs with remote work options citing Artificial Intelligence

Artificial Intelligence
Salary Histogram for Jobs with a WFH Option

Salary distribution for jobs with remote working options citing Artificial Intelligence over the 6 months to 17 September 2025.

Artificial Intelligence salary histogram for jobs with a WFH option

Artificial Intelligence
Co-occurring Skills and Capabilities with WFH Options by Category

The follow tables expand on the table above by listing co-occurrences grouped by category. The same employment type, locality and period is covered with up to 20 co-occurrences shown in each of the following categories:

Application Platforms
1 25 (0.82%) SharePoint
2 24 (0.79%) CMS
3 20 (0.66%) Apache Spark
4 18 (0.59%) Apache Airflow
5 16 (0.53%) Confluence
6 15 (0.49%) Microsoft Exchange
7 14 (0.46%) Apache
8 12 (0.40%) Apache Solr
9 6 (0.20%) Oracle SOA Suite
9 6 (0.20%) WordPress
10 4 (0.13%) Headless CMS
11 3 (0.099%) Luigi
12 2 (0.066%) Skype for Business
13 1 (0.033%) ArcGIS
13 1 (0.033%) IIS
Applications
1 1,328 (43.81%) Chatbot
2 49 (1.62%) Microsoft Excel
3 22 (0.73%) Microsoft Office
4 12 (0.40%) Adobe Premiere
4 12 (0.40%) Photoshop
5 8 (0.26%) Microsoft PowerPoint
6 7 (0.23%) Adobe Creative Suite
7 5 (0.16%) Adobe After Effects
7 5 (0.16%) Simulink
8 4 (0.13%) Spreadsheet
9 3 (0.099%) InDesign
9 3 (0.099%) Notion
10 2 (0.066%) Adobe XD
10 2 (0.066%) Civil 3D
10 2 (0.066%) Navisworks
10 2 (0.066%) Revit
10 2 (0.066%) Sketch
11 1 (0.033%) 3ds Max
11 1 (0.033%) Microsoft Project
11 1 (0.033%) MS Visio
Business Applications
1 7 (0.23%) Dynamics CRM
1 7 (0.23%) Oracle ERP
2 5 (0.16%) NetSuite
2 5 (0.16%) Shopify
3 3 (0.099%) SAP S/4HANA
4 2 (0.066%) Dynamics GP
4 2 (0.066%) Raiser’s Edge
4 2 (0.066%) Salesforce CRM
4 2 (0.066%) SAP SCM
4 2 (0.066%) SAP SD
5 1 (0.033%) Magento
5 1 (0.033%) Oracle Applications
5 1 (0.033%) SAP APO
5 1 (0.033%) SAP EWM
5 1 (0.033%) SAP IBP
5 1 (0.033%) SAP LE
5 1 (0.033%) SAP MM
5 1 (0.033%) SAP PP
5 1 (0.033%) SAP QM
5 1 (0.033%) Sparx Enterprise Architect
Cloud Services
1 295 (9.73%) Azure
2 184 (6.07%) AWS
3 143 (4.72%) Power Platform
4 136 (4.49%) SaaS
5 75 (2.47%) Azure DevOps
6 70 (2.31%) GCP
7 62 (2.05%) Microsoft 365
8 44 (1.45%) Entra ID
9 34 (1.12%) GitHub
10 30 (0.99%) Azure AI
10 30 (0.99%) Power Automate
10 30 (0.99%) Snowflake
11 24 (0.79%) Azure Monitor
11 24 (0.79%) PaaS
12 21 (0.69%) IaaS
12 21 (0.69%) Microsoft Copilot
13 20 (0.66%) Cloud Computing
13 20 (0.66%) Serverless
14 19 (0.63%) Azure Key Vault
14 19 (0.63%) Azure Synapse Analytics
Communications & Networking
1 24 (0.79%) DNS
2 23 (0.76%) WAN
3 22 (0.73%) Firewall
3 22 (0.73%) VPN
4 16 (0.53%) SD-WAN
5 12 (0.40%) Internet
6 11 (0.36%) Broadband
7 6 (0.20%) SAN
8 5 (0.16%) DHCP
8 5 (0.16%) Network Security
8 5 (0.16%) TCP/IP
9 4 (0.13%) InfiniBand
9 4 (0.13%) Wi-Fi
9 4 (0.13%) Wireless
10 3 (0.099%) ADSL
10 3 (0.099%) LAN
10 3 (0.099%) VoIP
11 2 (0.066%) Intranet
11 2 (0.066%) MQTT
11 2 (0.066%) TETRA
Database & Business Intelligence
1 99 (3.27%) Power BI
2 56 (1.85%) MySQL
3 49 (1.62%) Data Warehouse
4 39 (1.29%) NoSQL
4 39 (1.29%) SQL Server
5 33 (1.09%) MongoDB
5 33 (1.09%) Tableau
6 30 (0.99%) Data Lake
7 28 (0.92%) Elasticsearch
8 25 (0.82%) Big Data
8 25 (0.82%) PostgreSQL
9 12 (0.40%) Redis
10 11 (0.36%) Azure SQL Database
11 10 (0.33%) Looker
12 9 (0.30%) Snowflake Schema
13 8 (0.26%) BigQuery
13 8 (0.26%) DynamoDB
13 8 (0.26%) Relational Database
14 7 (0.23%) Amazon Redshift
15 6 (0.20%) Hadoop
Development Applications
1 67 (2.21%) Git
2 46 (1.52%) JIRA
3 10 (0.33%) Jenkins
4 6 (0.20%) Oracle Forms
5 4 (0.13%) Cypress.io
5 4 (0.13%) Selenium
6 3 (0.099%) GitLab
7 2 (0.066%) MLflow
8 1 (0.033%) JMeter
8 1 (0.033%) JUnit
8 1 (0.033%) Locust
8 1 (0.033%) Mercurial
8 1 (0.033%) PHPUnit
8 1 (0.033%) Postman
8 1 (0.033%) Rational DOORS
8 1 (0.033%) Robot Framework
8 1 (0.033%) TestNG
8 1 (0.033%) Visual Studio Code
8 1 (0.033%) Vite
General
1 755 (24.91%) Analytical Skills
2 593 (19.56%) Retail
3 556 (18.34%) Manufacturing
4 430 (14.19%) Social Skills
5 257 (8.48%) Finance
6 234 (7.72%) Inclusion and Diversity
7 206 (6.80%) Marketing
8 196 (6.47%) Dutch Language
8 196 (6.47%) Finnish Language
9 75 (2.47%) Legal
10 66 (2.18%) Law
11 49 (1.62%) Catalan Language
12 48 (1.58%) Public Sector
13 32 (1.06%) Organisational Skills
14 31 (1.02%) Aerospace
15 29 (0.96%) Advertising
16 25 (0.82%) Presentation Skills
17 23 (0.76%) Banking
18 20 (0.66%) Agriculture
18 20 (0.66%) Local Government
Job Titles
1 1,844 (60.84%) Trainer
2 145 (4.78%) Senior
3 140 (4.62%) Developer
4 94 (3.10%) Sales Executive
5 88 (2.90%) Content Editor
6 83 (2.74%) Architect
7 76 (2.51%) Analyst
8 62 (2.05%) Lead
9 56 (1.85%) Corporate Sales Executive
10 47 (1.55%) Microsoft Specialist
11 45 (1.48%) Biostatistician
11 45 (1.48%) Software Engineer
12 43 (1.42%) Data Engineer
13 42 (1.39%) Research Scientist
14 36 (1.19%) Engineering Manager
15 35 (1.15%) Communications Manager
15 35 (1.15%) Software Developer
16 34 (1.12%) Graduate
17 33 (1.09%) Customer Support Specialist
17 33 (1.09%) Support Specialist
Libraries, Frameworks & Software Standards
1 75 (2.47%) React
2 69 (2.28%) HTML
3 53 (1.75%) .NET
4 42 (1.39%) Node.js
5 31 (1.02%) Next.js
6 23 (0.76%) RESTful
7 22 (0.73%) Spring
8 20 (0.66%) Kafka
9 19 (0.63%) REST
10 18 (0.59%) Django
10 18 (0.59%) FastAPI
10 18 (0.59%) GraphQL
11 17 (0.56%) Flask
12 15 (0.49%) PyTorch
13 13 (0.43%) CSS
13 13 (0.43%) gRPC
13 13 (0.43%) Hugging Face
13 13 (0.43%) scikit-learn
13 13 (0.43%) TensorFlow
14 12 (0.40%) Spring Boot
Miscellaneous
1 552 (18.21%) Robotics
2 72 (2.38%) Product Ownership
3 67 (2.21%) Data Centre
4 63 (2.08%) Cloud Native
5 51 (1.68%) Onboarding
6 48 (1.58%) Molecular Biology
7 45 (1.48%) Greenfield Project
8 41 (1.35%) Analytical Mindset
9 31 (1.02%) Algorithms
10 30 (0.99%) Management Information System
10 30 (0.99%) Social Media
11 24 (0.79%) AI Agents
11 24 (0.79%) NHS
12 20 (0.66%) Enterprise Software
12 20 (0.66%) Reinsurance
13 18 (0.59%) Microsoft Licensing
14 17 (0.56%) Low-Code
15 15 (0.49%) Self-Motivation
16 14 (0.46%) Distributed Systems
16 14 (0.46%) Video Editing
Operating Systems
1 31 (1.02%) Windows
2 21 (0.69%) Linux
2 21 (0.69%) Windows Server
3 10 (0.33%) Apple iOS
4 7 (0.23%) Android
5 5 (0.16%) Windows Server 2019
6 3 (0.099%) Red Hat Enterprise Linux
7 2 (0.066%) Windows Server 2003
8 1 (0.033%) OpenVMS
8 1 (0.033%) Robot Operating System
8 1 (0.033%) Ubuntu
Processes & Methodologies
1 1,339 (44.18%) Conversational UI
2 805 (26.56%) Machine Learning
3 723 (23.85%) Problem-Solving
4 622 (20.52%) LLM
5 619 (20.42%) Chemistry
6 603 (19.89%) Data Privacy
7 596 (19.66%) Generative AI
8 539 (17.78%) Red Team
9 322 (10.62%) Mathematics
10 286 (9.44%) Computer Science
11 275 (9.07%) Agile
12 235 (7.75%) Roadmaps
13 228 (7.52%) Analytics
14 191 (6.30%) Statistics
15 176 (5.81%) Physics
16 153 (5.05%) DevOps
17 144 (4.75%) Software Engineering
18 134 (4.42%) Content Writing
19 129 (4.26%) CI/CD
20 128 (4.22%) Customer Experience
Programming Languages
1 302 (9.96%) Python
2 246 (8.12%) SQL
3 139 (4.59%) JavaScript
4 138 (4.55%) TypeScript
5 116 (3.83%) Java
6 74 (2.44%) C#
7 73 (2.41%) C++
8 71 (2.34%) R
9 62 (2.05%) MATLAB
10 61 (2.01%) C
11 59 (1.95%) PHP
12 50 (1.65%) PowerShell
12 50 (1.65%) Rust
13 49 (1.62%) Dart
13 49 (1.62%) Ruby
14 21 (0.69%) Bicep
15 16 (0.53%) Bash
16 14 (0.46%) Scala
17 10 (0.33%) Swift
18 8 (0.26%) Data Analysis Expressions
Qualifications
1 2,069 (68.26%) Degree
2 942 (31.08%) Master's Degree
3 934 (30.81%) PhD
4 65 (2.14%) Computer Science Degree
5 62 (2.05%) Security Cleared
6 48 (1.58%) SC Cleared
7 29 (0.96%) DBS Check
8 26 (0.86%) BPSS Clearance
9 20 (0.66%) ACCA
10 19 (0.63%) Azure Certification
10 19 (0.63%) Microsoft Certification
11 9 (0.30%) AWS Certification
12 8 (0.26%) ITIL Certification
13 7 (0.23%) Cisco Certification
14 6 (0.20%) CISA
14 6 (0.20%) CISM
14 6 (0.20%) CISSP
14 6 (0.20%) DV Cleared
15 5 (0.16%) CIMA
16 4 (0.13%) CCNP
Quality Assurance & Compliance
1 33 (1.09%) Data Quality
2 32 (1.06%) Accessibility
3 31 (1.02%) QA
4 21 (0.69%) GDPR
5 14 (0.46%) ISO/IEC 27001
6 12 (0.40%) GAAP
7 9 (0.30%) IFRS
8 8 (0.26%) Sarbanes-Oxley
9 7 (0.23%) Cyber Essentials
9 7 (0.23%) NIST
10 6 (0.20%) PCI DSS
11 5 (0.16%) NCSC
12 4 (0.13%) Cyber Essentials PLUS
12 4 (0.13%) WCAG
13 3 (0.099%) Actionable Recommendations
13 3 (0.099%) PERC
13 3 (0.099%) PMBOK
14 2 (0.066%) California Consumer Privacy Act
14 2 (0.066%) ISO 19650
14 2 (0.066%) ISO/IEC 42001
System Software
1 54 (1.78%) Docker
2 21 (0.69%) Virtual Machines
3 13 (0.43%) Virtual Desktop
4 12 (0.40%) Active Directory
5 6 (0.20%) VMware Infrastructure
6 4 (0.13%) Firmware
7 3 (0.099%) GPFS
7 3 (0.099%) Lustre
8 2 (0.066%) Hyper-V
9 1 (0.033%) Slurm Workload Manager
9 1 (0.033%) vSphere
Systems Management
1 46 (1.52%) Kubernetes
2 41 (1.35%) Terraform
3 22 (0.73%) Single Sign-On
4 13 (0.43%) Microsoft Intune
5 11 (0.36%) Ansible
6 7 (0.23%) SCCM
7 4 (0.13%) Progress Chef
7 4 (0.13%) Puppet
7 4 (0.13%) SCOM
8 3 (0.099%) Prometheus
8 3 (0.099%) SmoothWall
9 2 (0.066%) Kubeflow
9 2 (0.066%) SCOrch
9 2 (0.066%) SCSM
10 1 (0.033%) AppManager
10 1 (0.033%) Argo
10 1 (0.033%) Kibana
10 1 (0.033%) logstash
Vendors
1 1,307 (43.12%) PayPal
2 614 (20.26%) Google
3 596 (19.66%) Adobe
4 586 (19.33%) Databricks
5 327 (10.79%) Microsoft
6 116 (3.83%) Cisco
7 75 (2.47%) Dell
8 39 (1.29%) Apple
8 39 (1.29%) Salesforce
9 28 (0.92%) Blue Prism
10 26 (0.86%) Palo Alto
11 20 (0.66%) Oracle
12 17 (0.56%) Meraki
12 17 (0.56%) OpenAI
13 16 (0.53%) ServiceNow
13 16 (0.53%) VMware
14 15 (0.49%) HubSpot
15 13 (0.43%) SAP
16 10 (0.33%) Alteryx
16 10 (0.33%) Pardot