Performance Tuning Jobs with Hybrid/Remote/WFH Options

Performance Tuning
UK > Work from Home

The table below provides summary statistics for permanent remote or hybrid work requiring Performance Tuning skills. It includes a benchmarking guide to the annual salaries offered in vacancies that cited Performance Tuning over the 6 months leading up to 1 May 2025, comparing them to the same period in the previous two years.

6 months to
1 May 2025
Same period 2024 Same period 2023
Rank 263 268 381
Rank change year-on-year +5 +113 +19
Permanent jobs citing Performance Tuning 141 392 322
As % of all permanent jobs with a WFH option 0.94% 1.16% 0.75%
As % of the Processes & Methodologies category 1.01% 1.26% 0.78%
Number of salaries quoted 113 259 225
10th Percentile £46,250 £46,150 £41,056
25th Percentile £51,250 £53,750 £47,500
Median annual salary (50th Percentile) £60,000 £57,500 £60,000
Median % change year-on-year +4.35% -4.17% +4.35%
75th Percentile £70,000 £79,625 £77,500
90th Percentile £76,000 £91,934 £89,941
UK median annual salary £60,000 £57,500 £60,000
% change year-on-year +4.35% -4.17% -4.00%

All Process and Methodology Skills
Work from Home

Performance Tuning falls under the Processes and Methodologies category. For comparison with the information above, the following table provides summary statistics for all permanent job vacancies with remote or hybrid options requiring process or methodology skills.

Permanent vacancies with a requirement for process or methodology skills 13,930 31,014 41,082
As % of all permanent jobs with a WFH option 93.15% 91.65% 96.09%
Number of salaries quoted 9,709 23,583 28,561
10th Percentile £30,000 £33,930 £37,500
25th Percentile £45,000 £42,500 £47,500
Median annual salary (50th Percentile) £60,000 £57,500 £62,500
Median % change year-on-year +4.35% -8.00% +4.17%
75th Percentile £77,500 £75,000 £82,500
90th Percentile £102,500 £95,000 £100,000
UK median annual salary £57,500 £55,000 £61,500
% change year-on-year +4.55% -10.57% +2.50%

Performance Tuning
Trend for Jobs with a WFH Option

Job vacancies with remote working options citing Performance Tuning as a proportion of all IT jobs advertised.
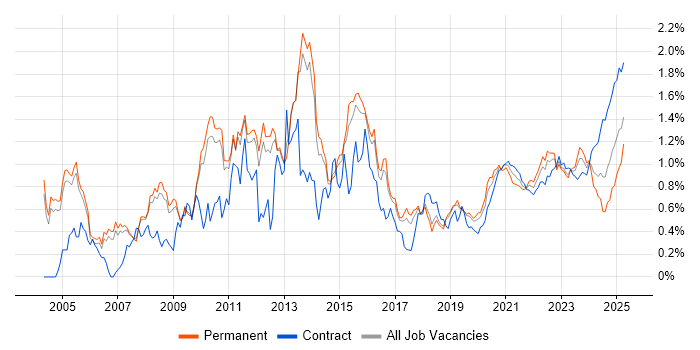
Performance Tuning trend for jobs with Hybrid/Remote/WFH options

Performance Tuning
Salary Trend for Jobs with a WFH Option

3-month moving average salary quoted in job vacancies with remote working options citing Performance Tuning.

Performance Tuning salary trend for jobs with a WFH option

Performance Tuning
Salary Histogram for Jobs with a WFH Option

Salary distribution for jobs with remote working options citing Performance Tuning over the 6 months to 1 May 2025.

Performance Tuning salary histogram for jobs with a WFH option

Performance Tuning
Co-occurring Skills and Capabilities with WFH Options by Category

The follow tables expand on the table above by listing co-occurrences grouped by category. The same employment type, locality and period is covered with up to 20 co-occurrences shown in each of the following categories:

Application Platforms
1 12 (8.51%) Apache Spark
1 12 (8.51%) Microsoft Exchange
2 4 (2.84%) Apache
2 4 (2.84%) IIS
3 3 (2.13%) GemFire
4 1 (0.71%) CMS
4 1 (0.71%) Tomcat
Applications
1 8 (5.67%) Microsoft Excel
Business Applications
1 4 (2.84%) Oracle Applications
1 4 (2.84%) Oracle EBS
2 3 (2.13%) SAP S/4HANA
3 1 (0.71%) Dynamics CRM
Cloud Services
1 51 (36.17%) Azure
2 36 (25.53%) AWS
3 34 (24.11%) Power Platform
4 22 (15.60%) SaaS
5 18 (12.77%) Serverless
6 16 (11.35%) AWS Lambda
7 13 (9.22%) AWS CloudFormation
7 13 (9.22%) AWS KMS
8 12 (8.51%) Azure Data Factory
9 11 (7.80%) GitHub
10 10 (7.09%) Azure DevOps
11 6 (4.26%) Azure Synapse Analytics
11 6 (4.26%) GCP
12 5 (3.55%) Amazon S3
13 4 (2.84%) Snowflake
14 3 (2.13%) Amazon CloudWatch
14 3 (2.13%) Amazon EC2
14 3 (2.13%) Azure Logic Apps
14 3 (2.13%) Power Automate
15 2 (1.42%) Dynamics 365
Communications & Networking
1 13 (9.22%) Network Security
2 7 (4.96%) DNS
3 4 (2.84%) DHCP
4 3 (2.13%) TCP/IP
5 2 (1.42%) VSAN
6 1 (0.71%) HTTP
6 1 (0.71%) MQTT
6 1 (0.71%) SSL
Database & Business Intelligence
1 63 (44.68%) SQL Server
2 33 (23.40%) Power BI
3 23 (16.31%) PostgreSQL
3 23 (16.31%) SQL Server Reporting Services
4 22 (15.60%) Data Warehouse
5 19 (13.48%) SQL Server Integration Services
6 12 (8.51%) Big Data
6 12 (8.51%) Data Hub
6 12 (8.51%) Metadata
6 12 (8.51%) SQL CLR
6 12 (8.51%) SQL Server Analysis Services
7 6 (4.26%) Azure SQL Database
7 6 (4.26%) Oracle Database
8 5 (3.55%) Amazon Redshift
8 5 (3.55%) Data Lake
9 4 (2.84%) Azure SQL Data Warehouse
9 4 (2.84%) BigQuery
9 4 (2.84%) Biml
9 4 (2.84%) Enterprise Data Warehouse
9 4 (2.84%) Oracle Exadata
Development Applications
1 14 (9.93%) Git
2 11 (7.80%) JIRA
3 10 (7.09%) Visual Studio
4 4 (2.84%) Oracle Forms
5 1 (0.71%) GitLab
5 1 (0.71%) Jenkins
5 1 (0.71%) Subversion
General
1 43 (30.50%) Social Skills
2 38 (26.95%) Finance
3 26 (18.44%) Analytical Skills
4 25 (17.73%) Law
5 12 (8.51%) Back Office
6 11 (7.80%) Banking
7 7 (4.96%) Inclusion and Diversity
7 7 (4.96%) Retail
8 4 (2.84%) Advertising
9 3 (2.13%) Front Office
10 2 (1.42%) Documentation Skills
10 2 (1.42%) Financial Institution
10 2 (1.42%) Tech for Good
11 1 (0.71%) Games
11 1 (0.71%) Health Technology
11 1 (0.71%) Military
11 1 (0.71%) Organisational Skills
11 1 (0.71%) Public Sector
Job Titles
1 33 (23.40%) Developer
2 26 (18.44%) Senior
3 21 (14.89%) Architect
4 19 (13.48%) DBA
5 17 (12.06%) Cloud Architect
5 17 (12.06%) Lead
6 14 (9.93%) SQL DBA
7 13 (9.22%) AWS Architect
7 13 (9.22%) SQL Developer
8 11 (7.80%) Database Team Leader
8 11 (7.80%) Development Team Leader
8 11 (7.80%) Senior Developer
8 11 (7.80%) Team Leader
9 9 (6.38%) Analyst
9 9 (6.38%) Microsoft Developer
9 9 (6.38%) Senior Microsoft Developer
9 9 (6.38%) Software Engineer
9 9 (6.38%) SQL Server DBA
10 8 (5.67%) Business Intelligence Analyst
10 8 (5.67%) Senior SQL Developer
Libraries, Frameworks & Software Standards
1 26 (18.44%) .NET
2 17 (12.06%) .NET Framework
2 17 (12.06%) Kafka
3 15 (10.64%) Elastic Stack
4 14 (9.93%) AngularJS
5 13 (9.22%) .NET Core
6 11 (7.80%) Entity Framework
7 8 (5.67%) Middleware
7 8 (5.67%) Pandas
8 7 (4.96%) Kendo UI
8 7 (4.96%) NgRx
8 7 (4.96%) RxJS
9 6 (4.26%) ASP.NET
9 6 (4.26%) ASP.NET MVC
10 5 (3.55%) Spring
11 4 (2.84%) Dapper ORM
11 4 (2.84%) Oracle Fusion
11 4 (2.84%) Oracle GoldenGate
11 4 (2.84%) REST
11 4 (2.84%) RESTful
Miscellaneous
1 16 (11.35%) Management Information System
2 14 (9.93%) Cloud Native
3 13 (9.22%) Private Cloud
4 11 (7.80%) Algorithms
4 11 (7.80%) Data Structures
5 7 (4.96%) Data Centre
5 7 (4.96%) Public Cloud
6 5 (3.55%) Replication
7 4 (2.84%) Team-Oriented Environment
8 3 (2.13%) Credit Derivative
8 3 (2.13%) Derivative
8 3 (2.13%) Equities
8 3 (2.13%) Fixed Income
8 3 (2.13%) Foreign Exchange (FX)
8 3 (2.13%) Mainframe
9 2 (1.42%) Blockchain
9 2 (1.42%) Clustering
9 2 (1.42%) Enterprise Software
9 2 (1.42%) Linux Command Line
9 2 (1.42%) Social Media
Operating Systems
1 31 (21.99%) Linux
2 16 (11.35%) Windows
3 10 (7.09%) Windows Server
4 7 (4.96%) Unix
5 6 (4.26%) Red Hat Enterprise Linux
6 3 (2.13%) AIX
6 3 (2.13%) Solaris
7 2 (1.42%) Windows Server 2019
8 1 (0.71%) Debian
8 1 (0.71%) Ubuntu
8 1 (0.71%) Windows Server 2012
8 1 (0.71%) Windows Server 2016
Processes & Methodologies
1 60 (42.55%) Problem-Solving
2 41 (29.08%) Mentoring
3 39 (27.66%) Agile
4 37 (26.24%) Software Engineering
5 36 (25.53%) High Availability
6 35 (24.82%) Business Intelligence
7 34 (24.11%) DevOps
7 34 (24.11%) Migration
8 31 (21.99%) CI/CD
9 29 (20.57%) Computer Science
10 25 (17.73%) Coaching
10 25 (17.73%) ETL
11 23 (16.31%) Database Tuning
12 22 (15.60%) Design Patterns
13 21 (14.89%) Microservices
14 19 (13.48%) Data Migration
15 18 (12.77%) Database Migration
16 17 (12.06%) Full-Stack Development
16 17 (12.06%) Infrastructure as Code
16 17 (12.06%) Infrastructure Engineering
Programming Languages
1 98 (69.50%) SQL
2 25 (17.73%) C#
2 25 (17.73%) T-SQL
3 19 (13.48%) Java
4 18 (12.77%) Python
5 16 (11.35%) PowerShell
6 11 (7.80%) Bash
6 11 (7.80%) Data Analysis Expressions
7 10 (7.09%) PL/SQL
8 8 (5.67%) JavaScript
9 4 (2.84%) Shell Script
10 2 (1.42%) C++
10 2 (1.42%) Perl
10 2 (1.42%) Rust
11 1 (0.71%) ABAP
11 1 (0.71%) PHP
11 1 (0.71%) SAPscript
11 1 (0.71%) SHACL
11 1 (0.71%) SPARQL
11 1 (0.71%) VC++
Qualifications
1 32 (22.70%) Degree
2 22 (15.60%) Computer Science Degree
3 17 (12.06%) Security Cleared
4 15 (10.64%) SC Cleared
5 14 (9.93%) AWS Certification
6 13 (9.22%) AWS Certified Solutions Architect
7 8 (5.67%) Oracle Certification
8 6 (4.26%) Numerate Degree
9 5 (3.55%) Master's Degree
10 4 (2.84%) OCA
10 4 (2.84%) OCP
11 3 (2.13%) DBS Check
11 3 (2.13%) Microsoft Certification
12 2 (1.42%) CCNA
12 2 (1.42%) CCNP
12 2 (1.42%) DV Cleared
12 2 (1.42%) MCP
12 2 (1.42%) MCSA
12 2 (1.42%) SAP Certification
12 2 (1.42%) VMware Certified Professional (VCP)
Quality Assurance & Compliance
1 16 (11.35%) GDPR
2 15 (10.64%) ISO 9001
3 13 (9.22%) HIPAA
4 9 (6.38%) Accessibility
5 5 (3.55%) Data Quality
6 4 (2.84%) QA
7 3 (2.13%) ISO/IEC 27001
8 1 (0.71%) PCI DSS
8 1 (0.71%) SLA
System Software
1 17 (12.06%) Docker
2 16 (11.35%) VMware Infrastructure
3 4 (2.84%) Active Directory
3 4 (2.84%) HDFS
4 3 (2.13%) Firmware
4 3 (2.13%) Virtual Machines
4 3 (2.13%) vSphere
5 2 (1.42%) EMC RecoverPoint
5 2 (1.42%) Oracle RAC
5 2 (1.42%) VMware NSX
6 1 (0.71%) Hyper-V
6 1 (0.71%) Virtual Servers
6 1 (0.71%) VMware ESXi
Systems Management
1 16 (11.35%) Kubernetes
1 16 (11.35%) Terraform
2 14 (9.93%) Grafana
2 14 (9.93%) Prometheus
3 10 (7.09%) Failover Clustering
4 4 (2.84%) Ansible
4 4 (2.84%) Oracle RMAN
5 3 (2.13%) vCenter Server
6 2 (1.42%) Dell DRAC
6 2 (1.42%) Progress Chef
6 2 (1.42%) Puppet
6 2 (1.42%) SCOM
6 2 (1.42%) vRealize
6 2 (1.42%) VxRail
6 2 (1.42%) WSUS
7 1 (0.71%) Microsoft Intune
7 1 (0.71%) Single Sign-On
Vendors
1 49 (34.75%) Microsoft
2 22 (15.60%) Oracle
3 16 (11.35%) VMware
4 7 (4.96%) SAP
4 7 (4.96%) Telerik
5 6 (4.26%) Red Hat
6 5 (3.55%) Databricks
6 5 (3.55%) Google
7 4 (2.84%) Teradata
8 3 (2.13%) Solace
8 3 (2.13%) TIBCO
9 2 (1.42%) ArcSight
9 2 (1.42%) Dell
9 2 (1.42%) EMC
9 2 (1.42%) Isilon
9 2 (1.42%) McAfee
9 2 (1.42%) ServiceNow
9 2 (1.42%) SolarWinds
9 2 (1.42%) Splunk
10 1 (0.71%) OpenAI