Social Media Jobs with Work from Home Options

Social Media
UK > Work from Home

The table below looks at the prevalence of the term Social Media in remote or hybrid work. Included is a benchmarking guide to the salaries offered in vacancies that cited Social Media over the 6 months leading up to 26 July 2024, comparing them to the same period in the previous two years.

6 months to
26 Jul 2024
Same period 2023 Same period 2022
Rank 195 419 295
Rank change year-on-year +224 -124 +49
Permanent jobs citing Social Media 486 163 987
As % of all permanent jobs with a WFH option 1.74% 0.50% 1.26%
As % of the Miscellaneous category 5.06% 1.28% 2.69%
Number of salaries quoted 232 121 503
10th Percentile £24,250 £30,000 £29,750
25th Percentile £27,750 £40,000 £42,500
Median annual salary (50th Percentile) £37,127 £55,000 £60,000
Median % change year-on-year -32.50% -8.33% +14.29%
75th Percentile £48,000 £75,000 £87,500
90th Percentile £65,000 £122,500 £92,500
UK median annual salary £38,000 £45,000 £55,000
% change year-on-year -15.56% -18.18% +4.76%

All Generic Skills
Work from Home

Social Media falls under the General and Transferable Skills category. For comparison with the information above, the following table provides summary statistics for all permanent job vacancies with remote or hybrid options requiring generic IT skills.

Permanent vacancies with a requirement for generic IT skills 9,605 12,729 36,632
As % of all permanent jobs with a WFH option 34.38% 38.79% 46.65%
Number of salaries quoted 6,855 9,924 18,426
10th Percentile £33,500 £40,000 £37,500
25th Percentile £45,000 £50,000 £47,500
Median annual salary (50th Percentile) £60,000 £65,000 £65,000
Median % change year-on-year -7.69% - +8.33%
75th Percentile £83,750 £85,000 £85,000
90th Percentile £117,500 £107,500 £100,000
UK median annual salary £55,000 £64,000 £62,500
% change year-on-year -14.06% +2.40% +4.17%

Social Media
Trend for Jobs with a WFH Option

Job vacancies with a work from home option citing Social Media as a proportion of all IT jobs advertised.
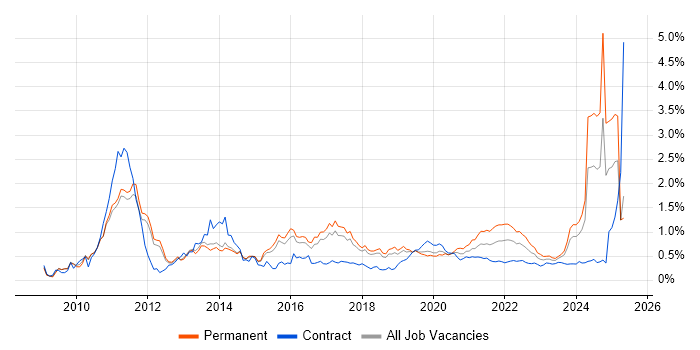
Social Media trend for jobs with a WFH option

Social Media
Salary Trend for Jobs with a WFH Option

3-month moving average salary quoted in job vacancies with a work from home option citing Social Media.

Social Media salary trend for jobs with a WFH option

Social Media
Salary Histogram for Jobs with a WFH Option

Salary distribution for jobs with a work from home option citing Social Media over the 6 months to 26 July 2024.

Social Media salary histogram for jobs with a WFH option

Social Media
Co-occurring Skills and Capabilities with WFH Options by Category

The follow tables expand on the table above by listing co-occurrences grouped by category. The same employment type, locality and period is covered with up to 20 co-occurrences shown in each of the following categories:

Application Platforms
1 27 (5.56%) CMS
2 14 (2.88%) WordPress
3 5 (1.03%) SharePoint
4 3 (0.62%) Drupal
5 2 (0.41%) Apache Spark
5 2 (0.41%) Microsoft Exchange
Applications
1 61 (12.55%) Microsoft Office
2 39 (8.02%) Microsoft Excel
3 32 (6.58%) Microsoft PowerPoint
4 22 (4.53%) Photoshop
5 18 (3.70%) Adobe Illustrator
6 14 (2.88%) Adobe Creative Suite
7 13 (2.67%) InDesign
8 7 (1.44%) Adobe Premiere
9 6 (1.23%) Adobe After Effects
10 3 (0.62%) Microsoft Project
11 2 (0.41%) Adobe XD
11 2 (0.41%) CapCut
12 1 (0.21%) Adobe Captivate
12 1 (0.21%) Sketch
12 1 (0.21%) Spreadsheet
12 1 (0.21%) Trello
Business Applications
1 3 (0.62%) Salesforce CRM
Cloud Services
1 229 (47.12%) Azure
2 211 (43.42%) Entra ID
3 27 (5.56%) Google Analytics
4 12 (2.47%) Canva
4 12 (2.47%) Microsoft 365
5 9 (1.85%) MailChimp
6 7 (1.44%) Google Ads
6 7 (1.44%) Power Platform
7 6 (1.23%) Google Docs
7 6 (1.23%) SaaS
8 5 (1.03%) Adobe Creative Cloud
9 4 (0.82%) Power Automate
10 3 (0.62%) Google Drive
10 3 (0.62%) Snowflake
10 3 (0.62%) Zapier
11 2 (0.41%) Figma
11 2 (0.41%) Google Workspace
12 1 (0.21%) Azure Functions
12 1 (0.21%) ClickUp
12 1 (0.21%) Serverless
Communications & Networking
1 232 (47.74%) Broadband
2 210 (43.21%) 5G
3 13 (2.67%) Internet
4 11 (2.26%) Wi-Fi
5 4 (0.82%) Intranet
5 4 (0.82%) Peer-to-Peer Networking
5 4 (0.82%) Unified Communications
5 4 (0.82%) VoIP
6 2 (0.41%) SNA
7 1 (0.21%) DKIM
7 1 (0.21%) DMARC
7 1 (0.21%) DNS
Database & Business Intelligence
1 7 (1.44%) Power BI
1 7 (1.44%) SQL Server
2 4 (0.82%) Data Warehouse
3 2 (0.41%) PostgreSQL
3 2 (0.41%) SQLite
4 1 (0.21%) Looker
4 1 (0.21%) Metadata
4 1 (0.21%) Mixpanel
4 1 (0.21%) MySQL
Development Applications
1 2 (0.41%) Git
1 2 (0.41%) JIRA
2 1 (0.21%) Dreamweaver
General
1 271 (55.76%) Inclusion and Diversity
2 244 (50.21%) Analytical Skills
3 152 (31.28%) Marketing
4 118 (24.28%) Social Skills
5 65 (13.37%) Finance
6 21 (4.32%) Advertising
7 19 (3.91%) Organisational Skills
8 12 (2.47%) Retail
8 12 (2.47%) Spanish Language
9 11 (2.26%) General Ledger
9 11 (2.26%) Local Government
9 11 (2.26%) Publishing
10 10 (2.06%) French Language
10 10 (2.06%) Law
11 8 (1.65%) Legal
11 8 (1.65%) Telecoms
12 6 (1.23%) German Language
12 6 (1.23%) Multimedia
12 6 (1.23%) Presentation Skills
12 6 (1.23%) Public Speaking
Job Titles
1 210 (43.21%) Linux Specialist
1 210 (43.21%) Technical Specialist
2 161 (33.13%) Senior
3 127 (26.13%) Senior Data Warehouse Specialist
3 127 (26.13%) Senior Linux Specialist
3 127 (26.13%) Senior Technical Specialist
3 127 (26.13%) Senior Unix Technical Specialist
4 25 (5.14%) Analyst
5 19 (3.91%) Communications Manager
5 19 (3.91%) Financial Analyst
6 18 (3.70%) Lead
7 17 (3.50%) Developer
8 15 (3.09%) Coordinator
9 14 (2.88%) Designer
10 12 (2.47%) Communications Officer
10 12 (2.47%) Development Manager
11 11 (2.26%) IT Engineer
11 11 (2.26%) IT Support
11 11 (2.26%) Senior Manager
11 11 (2.26%) Support Engineer
Libraries, Frameworks & Software Standards
1 13 (2.67%) HTML
2 11 (2.26%) CSS
3 8 (1.65%) .NET
3 8 (1.65%) ASP.NET
3 8 (1.65%) ASP.NET MVC
4 7 (1.44%) .NET Core
4 7 (1.44%) .NET Framework
4 7 (1.44%) AngularJS
4 7 (1.44%) ASP.NET Web API
4 7 (1.44%) Entity Framework
4 7 (1.44%) Twitter Bootstrap
5 2 (0.41%) Django
5 2 (0.41%) htmx
5 2 (0.41%) React
6 1 (0.21%) ARM Templates
6 1 (0.21%) Blazor
6 1 (0.21%) DHTML
6 1 (0.21%) Flash
6 1 (0.21%) HTML5
6 1 (0.21%) Tailwind CSS
Miscellaneous
1 42 (8.64%) Blog
2 32 (6.58%) Self-Motivation
3 23 (4.73%) Graphic Design
4 11 (2.26%) Management Information System
5 9 (1.85%) Video Editing
6 8 (1.65%) Digital Media
6 8 (1.65%) Driving Licence
6 8 (1.65%) e-Learning
7 7 (1.44%) BBC
7 7 (1.44%) Taxonomies
8 6 (1.23%) NHS
9 4 (0.82%) Algorithms
9 4 (0.82%) Podcast
9 4 (0.82%) Product Ownership
10 3 (0.62%) Analytical Mindset
10 3 (0.62%) Animation
10 3 (0.62%) Legacy Systems
10 3 (0.62%) Motion Graphics
10 3 (0.62%) Onboarding
10 3 (0.62%) Photography
Operating Systems
1 210 (43.21%) Linux
1 210 (43.21%) Ubuntu
2 25 (5.14%) Windows
3 11 (2.26%) Android
3 11 (2.26%) Mac OS
3 11 (2.26%) Windows 10
4 10 (2.06%) Apple iOS
5 5 (1.03%) Windows Vista
6 1 (0.21%) Mac OS X
Processes & Methodologies
1 244 (50.21%) CRM
2 215 (44.24%) Artificial Intelligence
3 214 (44.03%) Cybersecurity
4 210 (43.21%) IT Strategy
4 210 (43.21%) Technology Strategy
5 52 (10.70%) Analytics
6 44 (9.05%) Line Management
7 42 (8.64%) Digital Marketing
8 41 (8.44%) Agile
9 32 (6.58%) Business Development
10 28 (5.76%) Customer Service
10 28 (5.76%) SEO
11 27 (5.56%) User Experience
12 23 (4.73%) Decision-Making
13 21 (4.32%) Content Management
13 21 (4.32%) Project Management
13 21 (4.32%) Storytelling
14 20 (4.12%) Continuous Improvement
14 20 (4.12%) Copywriting
15 19 (3.91%) Content Strategy
Programming Languages
1 210 (43.21%) Bash
2 13 (2.67%) JavaScript
3 9 (1.85%) SQL
4 8 (1.65%) C#
5 7 (1.44%) Python
6 2 (0.41%) C
6 2 (0.41%) C++
6 2 (0.41%) R
6 2 (0.41%) Rust
7 1 (0.21%) PHP
7 1 (0.21%) PowerShell
Qualifications
1 53 (10.91%) Degree
2 14 (2.88%) ACCA
2 14 (2.88%) CIMA
3 13 (2.67%) DBS Check
4 4 (0.82%) Computer Science Degree
4 4 (0.82%) Security Cleared
5 3 (0.62%) PMI Certification
6 2 (0.41%) PMP
6 2 (0.41%) SC Cleared
7 1 (0.21%) BPSS Clearance
7 1 (0.21%) CISA
7 1 (0.21%) CISM
7 1 (0.21%) CRISC
7 1 (0.21%) ISACA
7 1 (0.21%) PRINCE2 Practitioner
Quality Assurance & Compliance
1 10 (2.06%) Accessibility
2 2 (0.41%) Actionable Recommendations
2 2 (0.41%) Data Quality
2 2 (0.41%) Disclosure Scotland
2 2 (0.41%) QA
3 1 (0.21%) Cyber Essentials
3 1 (0.21%) NIST
System Software
1 211 (43.42%) Active Directory
2 3 (0.62%) Docker
3 2 (0.41%) Firmware
Systems Management
1 211 (43.42%) Microsoft Intune
2 210 (43.21%) Jamf Pro
3 1 (0.21%) SCCM
3 1 (0.21%) Single Sign-On
3 1 (0.21%) Terraform
Vendors
1 267 (54.94%) Microsoft
2 210 (43.21%) CyberArk
2 210 (43.21%) Tanium
3 52 (10.70%) Google
4 26 (5.35%) Facebook
5 24 (4.94%) Adobe
6 18 (3.70%) SAP
7 17 (3.50%) Instagram
8 12 (2.47%) TikTok
9 11 (2.26%) CA
10 9 (1.85%) Twitter
10 9 (1.85%) YouTube
11 8 (1.65%) Apple
11 8 (1.65%) Pinterest
12 7 (1.44%) Sony
12 7 (1.44%) Yahoo!
13 6 (1.23%) Salesforce
14 5 (1.03%) Snapchat
15 4 (0.82%) Hootsuite
15 4 (0.82%) Pardot