Developer Jobs with Hybrid/Remote/WFH Options

Developer
UK > Work from Home

The median Developer salary for remote or hybrid work is £60,000 per year, according to job vacancies posted during the 6 months leading to 24 June 2025.

The table below provides salary benchmarking and summary statistics, comparing them to the same period in the previous two years.

6 months to
24 Jun 2025
Same period 2024 Same period 2023
Rank 21 6 5
Rank change year-on-year -15 -1 -2
Permanent jobs requiring a Developer 2,067 6,795 6,952
As % of all permanent jobs with a WFH option 10.44% 19.21% 19.10%
As % of the Job Titles category 11.44% 19.95% 19.92%
Number of salaries quoted 1,612 5,921 6,036
10th Percentile £37,500 £37,000 £41,250
25th Percentile £46,250 £45,000 £48,750
Median annual salary (50th Percentile) £60,000 £55,000 £62,750
Median % change year-on-year +9.09% -12.35% +4.58%
75th Percentile £75,000 £70,000 £80,000
90th Percentile £110,000 £88,750 £105,000
UK median annual salary £60,000 £55,173 £65,000
% change year-on-year +8.75% -15.12% +8.33%

All Permanent IT Job Vacancies
Work from Home

For comparison with the information above, the following table provides summary statistics for all permanent IT job vacancies with WFH or hybrid options. Most job vacancies include a discernible job title that can be normalized. As such, the figures in the second row provide an indication of the number of permanent jobs in our overall sample.

Permanent vacancies in Work from Home with a recognized job title 18,070 34,053 34,895
% of permanent jobs with a recognized job title 91.31% 96.27% 95.87%
Number of salaries quoted 9,921 25,742 25,653
10th Percentile £25,625 £33,000 £37,000
25th Percentile £39,500 £42,500 £47,000
Median annual salary (50th Percentile) £56,000 £55,000 £62,500
Median % change year-on-year +1.82% -12.00% +4.17%
75th Percentile £75,000 £75,000 £81,250
90th Percentile £100,000 £93,750 £100,000
UK median annual salary £55,000 £52,500 £60,000
% change year-on-year +4.76% -12.50% -

Developer
Trend for Jobs with a WFH Option

Job vacancies with remote working options which featured Developer in the job title as a proportion of all IT jobs advertised.
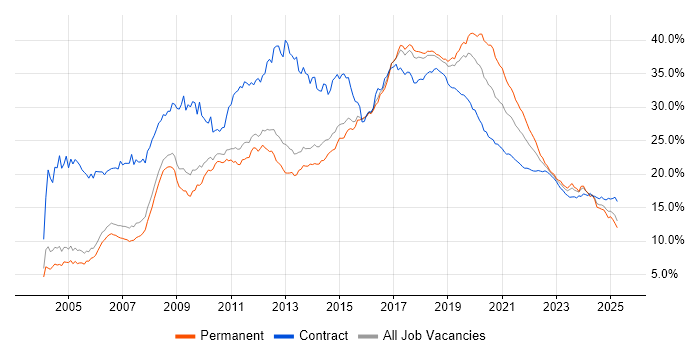
Developer trend for jobs with Hybrid/Remote/WFH options

Developer
Salary Trend for Jobs with a WFH Option

3-month moving average salary quoted in job vacancies with remote working options citing Developer.

Developer salary trend for jobs with a WFH option

Developer
Salary Histogram for Jobs with a WFH Option

Salary distribution for jobs with remote working options citing Developer over the 6 months to 24 June 2025.

Developer salary histogram for jobs with a WFH option

Developer Skill Set
Top 30 Co-occurring Skills and Capabilities in Job Vacancies with WFH Options

For the 6 months to 24 June 2025, Developer job roles required the following skills and capabilities in order of popularity. The figures indicate the absolute number co-occurrences and as a proportion of all permanent jobs with hybrid or remote work options featuring Developer in the job title.

1 871 (42.14%) JavaScript
2 858 (41.51%) Agile
3 648 (31.35%) C#
4 626 (30.29%) SQL
5 620 (30.00%) AWS
6 607 (29.37%) Azure
7 592 (28.64%) .NET
8 567 (27.43%) React
9 525 (25.40%) Python
10 509 (24.63%) Finance
11 448 (21.67%) TypeScript
12 427 (20.66%) Social Skills
13 420 (20.32%) Problem-Solving
14 389 (18.82%) HTML
15 385 (18.63%) Software Engineering
16 380 (18.38%) Java
17 370 (17.90%) CI/CD
18 345 (16.69%) CSS
19 334 (16.16%) Microsoft
20 326 (15.77%) Node.js
21 323 (15.63%) Full-Stack Development
22 289 (13.98%) SQL Server
23 282 (13.64%) AngularJS
24 272 (13.16%) Degree
25 263 (12.72%) Git
26 259 (12.53%) Power Platform
27 257 (12.43%) DevOps
28 245 (11.85%) Microservices
29 232 (11.22%) C++
30 226 (10.93%) Docker

Developer Skill Set
Co-occurring Skills and Capabilities with WFH Options by Category

The follow tables expand on the table above by listing co-occurrences grouped by category. The same employment type, locality and period is covered with up to 20 co-occurrences shown in each of the following categories:

Application Platforms
1 102 (4.93%) Apache Airflow
2 54 (2.61%) SharePoint
3 49 (2.37%) CMS
4 41 (1.98%) WordPress
5 37 (1.79%) OpenEdge
6 32 (1.55%) Confluence
7 26 (1.26%) Apache
8 16 (0.77%) Drupal
9 14 (0.68%) Appian
9 14 (0.68%) IIS
10 13 (0.63%) Microsoft Exchange
11 10 (0.48%) nginx
12 9 (0.44%) Umbraco
13 5 (0.24%) Headless CMS
14 4 (0.19%) JBoss
15 3 (0.15%) ColdFusion
15 3 (0.15%) NServiceBus
16 2 (0.097%) Apache Spark
16 2 (0.097%) OpenStack
16 2 (0.097%) Solana
Applications
1 62 (3.00%) Chatbot
2 36 (1.74%) Microsoft Excel
3 18 (0.87%) Microsoft PowerPoint
4 8 (0.39%) Photoshop
5 6 (0.29%) Adobe Illustrator
5 6 (0.29%) Adobe XD
5 6 (0.29%) Revit
6 5 (0.24%) Microsoft Office
7 4 (0.19%) Spreadsheet
8 3 (0.15%) Adobe Creative Suite
8 3 (0.15%) Sketch
9 2 (0.097%) Elementor
9 2 (0.097%) Trello
10 1 (0.048%) Moqups
10 1 (0.048%) MS Visio
10 1 (0.048%) S-PLUS
Business Applications
1 71 (3.43%) Dynamics CRM
2 22 (1.06%) NetSuite
3 16 (0.77%) Magento
4 13 (0.63%) Shopify
5 12 (0.58%) Oracle EBS
6 11 (0.53%) JDE OneWorld
7 10 (0.48%) Payment Gateway
7 10 (0.48%) Sage 200
7 10 (0.48%) Sage 50
8 9 (0.44%) Infor CloudSuite
8 9 (0.44%) Infor CloudSuite Industrial (formerly SyteLine)
9 8 (0.39%) SAP S/4HANA
10 5 (0.24%) Dynamics NAV
11 4 (0.19%) Orchestrade
11 4 (0.19%) Sage 1000
12 3 (0.15%) Visualfiles
13 2 (0.097%) Elite 3E
13 2 (0.097%) Salesforce CRM
13 2 (0.097%) SAP HCM
13 2 (0.097%) SAP HR
Cloud Services
1 620 (30.00%) AWS
2 607 (29.37%) Azure
3 259 (12.53%) Power Platform
4 174 (8.42%) GCP
4 174 (8.42%) Serverless
5 142 (6.87%) PowerApps
6 138 (6.68%) AWS Lambda
7 125 (6.05%) Power Automate
8 115 (5.56%) Dynamics 365
9 105 (5.08%) SaaS
10 100 (4.84%) dbt
11 98 (4.74%) GitHub
12 97 (4.69%) Azure DevOps
13 96 (4.64%) Amazon S3
14 75 (3.63%) AWS Step Functions
15 65 (3.14%) Amazon EKS
16 53 (2.56%) AWS CloudFormation
17 35 (1.69%) Azure Logic Apps
17 35 (1.69%) Microsoft 365
18 33 (1.60%) Snowflake
Communications & Networking
1 78 (3.77%) Broadband
2 26 (1.26%) TCP/IP
3 12 (0.58%) HTTP
4 7 (0.34%) Internet
5 6 (0.29%) 5G
6 5 (0.24%) BGP
6 5 (0.24%) IPsec
6 5 (0.24%) MPLS
6 5 (0.24%) OSPF
7 4 (0.19%) HTTPS
7 4 (0.19%) Intranet
8 3 (0.15%) FTP
8 3 (0.15%) Multicast
9 2 (0.097%) 3GPP
10 1 (0.048%) DNS
10 1 (0.048%) RFID
10 1 (0.048%) RS-232
10 1 (0.048%) RS-422
10 1 (0.048%) RS-485
10 1 (0.048%) SMTP
Database & Business Intelligence
1 289 (13.98%) SQL Server
2 187 (9.05%) Power BI
3 175 (8.47%) Elasticsearch
4 174 (8.42%) PostgreSQL
5 173 (8.37%) MySQL
6 115 (5.56%) DynamoDB
7 99 (4.79%) Amazon Athena
8 98 (4.74%) MongoDB
9 97 (4.69%) Apache Arrow
9 97 (4.69%) Apache Iceberg
9 97 (4.69%) Dremio
10 65 (3.14%) SQL Server Reporting Services
11 61 (2.95%) Data Warehouse
11 61 (2.95%) NoSQL
12 57 (2.76%) Relational Database
13 53 (2.56%) SQL Server Integration Services
14 49 (2.37%) Azure SQL Database
15 30 (1.45%) Redis
16 26 (1.26%) BusinessObjects
17 18 (0.87%) Data Mining
Development Applications
1 263 (12.72%) Git
2 69 (3.34%) JIRA
3 62 (3.00%) Visual Studio
4 47 (2.27%) Jenkins
5 40 (1.94%) JUnit
6 27 (1.31%) Jasmine
6 27 (1.31%) Mockito
7 26 (1.26%) GitLab
8 24 (1.16%) NUnit
9 23 (1.11%) IntelliJ
10 19 (0.92%) Maven
11 17 (0.82%) TeamCity
12 15 (0.73%) Karma Test Runner
13 13 (0.63%) Cypress.io
13 13 (0.63%) Protractor
13 13 (0.63%) webpack
14 12 (0.58%) Gradle
14 12 (0.58%) SQL Server Management Studio (SSMS)
15 11 (0.53%) Cucumber
15 11 (0.53%) SonarQube
General
1 509 (24.63%) Finance
2 427 (20.66%) Social Skills
3 195 (9.43%) Front Office
4 180 (8.71%) Analytical Skills
5 140 (6.77%) Banking
6 138 (6.68%) Inclusion and Diversity
7 93 (4.50%) Retail
8 81 (3.92%) Law
9 65 (3.14%) Games
10 62 (3.00%) Marketing
11 49 (2.37%) Investment Banking
12 45 (2.18%) Public Sector
13 32 (1.55%) Tech for Good
14 31 (1.50%) Manufacturing
15 28 (1.35%) Back Office
16 21 (1.02%) Health Technology
16 21 (1.02%) Organisational Skills
17 19 (0.92%) Legal
17 19 (0.92%) Publishing
18 18 (0.87%) Advertising
Libraries, Frameworks & Software Standards
1 592 (28.64%) .NET
2 567 (27.43%) React
3 389 (18.82%) HTML
4 345 (16.69%) CSS
5 326 (15.77%) Node.js
6 282 (13.64%) AngularJS
7 219 (10.60%) Vue
8 185 (8.95%) RESTful
9 178 (8.61%) ASP.NET
10 168 (8.13%) .NET Core
11 159 (7.69%) REST
12 138 (6.68%) .NET Framework
12 138 (6.68%) Pandas
13 126 (6.10%) GraphQL
14 108 (5.22%) jQuery
15 105 (5.08%) Web Services
16 104 (5.03%) HTML5
17 84 (4.06%) NumPy
18 82 (3.97%) Entity Framework
19 81 (3.92%) SciPy
Miscellaneous
1 152 (7.35%) Fixed Income
2 117 (5.66%) Foreign Exchange (FX)
3 108 (5.22%) Equities
4 75 (3.63%) Mobile App
5 56 (2.71%) Greenfield Project
6 49 (2.37%) Cyberattack
7 47 (2.27%) Product Ownership
8 46 (2.23%) Hedge funds
9 42 (2.03%) Management Information System
10 41 (1.98%) Algorithms
11 40 (1.94%) Data Structures
12 38 (1.84%) Cloud Native
12 38 (1.84%) Enterprise Software
13 34 (1.64%) Self-Motivation
14 33 (1.60%) Legacy Systems
15 31 (1.50%) Virtual Team
16 26 (1.26%) Mobile Games
17 25 (1.21%) Derivative
18 20 (0.97%) Onboarding
19 17 (0.82%) FPGA
Operating Systems
1 165 (7.98%) Linux
2 89 (4.31%) Android
3 47 (2.27%) Windows
4 39 (1.89%) Apple iOS
5 10 (0.48%) Unix
6 6 (0.29%) Mac OS
7 5 (0.24%) Rocky
7 5 (0.24%) Windows Server
8 4 (0.19%) Embedded Linux
8 4 (0.19%) Windows 10
9 3 (0.15%) Ubuntu
Processes & Methodologies
1 858 (41.51%) Agile
2 420 (20.32%) Problem-Solving
3 385 (18.63%) Software Engineering
4 370 (17.90%) CI/CD
5 323 (15.63%) Full-Stack Development
6 257 (12.43%) DevOps
7 245 (11.85%) Microservices
8 219 (10.60%) Mentoring
9 217 (10.50%) Clean Code
10 215 (10.40%) User Experience
11 213 (10.30%) OO
12 206 (9.97%) OOP
13 191 (9.24%) Artificial Intelligence
14 186 (9.00%) Fintech
15 182 (8.81%) Business Intelligence
16 171 (8.27%) Front End Development
17 167 (8.08%) MVC
18 166 (8.03%) Design Patterns
19 162 (7.84%) Computer Science
20 160 (7.74%) TDD
Programming Languages
1 871 (42.14%) JavaScript
2 648 (31.35%) C#
3 626 (30.29%) SQL
4 525 (25.40%) Python
5 448 (21.67%) TypeScript
6 380 (18.38%) Java
7 232 (11.22%) C++
8 175 (8.47%) PHP
9 69 (3.34%) Go
10 63 (3.05%) T-SQL
11 57 (2.76%) Rust
12 49 (2.37%) C
13 47 (2.27%) PowerShell
14 31 (1.50%) VBA
15 30 (1.45%) VB.NET
16 29 (1.40%) Kotlin
17 26 (1.26%) PL/SQL
18 23 (1.11%) Swift
19 20 (0.97%) Objective-C
20 19 (0.92%) Apex Code
Qualifications
1 272 (13.16%) Degree
2 132 (6.39%) Computer Science Degree
3 130 (6.29%) Security Cleared
4 76 (3.68%) AWS Certification
5 61 (2.95%) SC Cleared
6 58 (2.81%) DV Cleared
7 23 (1.11%) Master's Degree
8 22 (1.06%) DBS Check
8 22 (1.06%) Microsoft Certification
9 19 (0.92%) PhD
10 9 (0.44%) BPSS Clearance
11 8 (0.39%) Numerate Degree
12 5 (0.24%) Azure Certification
13 3 (0.15%) AWS Certified Solutions Architect
14 2 (0.097%) ACCA
15 1 (0.048%) BC Cleared
15 1 (0.048%) OCP
15 1 (0.048%) Oracle Certification
15 1 (0.048%) Tableau Certification
Quality Assurance & Compliance
1 134 (6.48%) QA
2 63 (3.05%) Accessibility
3 18 (0.87%) Data Quality
4 8 (0.39%) GDPR
5 7 (0.34%) ISO/IEC 27001
6 6 (0.29%) ISO 9001
7 4 (0.19%) WCAG
8 3 (0.15%) GRC
9 2 (0.097%) NCSC
10 1 (0.048%) CDISC
10 1 (0.048%) Disclosure Scotland
10 1 (0.048%) MiFID
10 1 (0.048%) PMO
System Software
1 226 (10.93%) Docker
2 13 (0.63%) VMware Infrastructure
3 5 (0.24%) Active Directory
4 1 (0.048%) Firmware
4 1 (0.048%) HDFS
4 1 (0.048%) Virtual Machines
Systems Management
1 141 (6.82%) Kubernetes
2 103 (4.98%) Terraform
3 62 (3.00%) Ansible
4 13 (0.63%) Failover Clustering
5 9 (0.44%) Prometheus
5 9 (0.44%) Single Sign-On
6 7 (0.34%) Grafana
7 4 (0.19%) Argo
7 4 (0.19%) Microsoft Intune
8 2 (0.097%) HAProxy
9 1 (0.048%) Systems Management Server (SMS)
Vendors
1 334 (16.16%) Microsoft
2 61 (2.95%) PayPal
3 59 (2.85%) Oracle
4 41 (1.98%) Salesforce
5 34 (1.64%) Google
6 33 (1.60%) IBM
6 33 (1.60%) Progress
7 26 (1.26%) Databricks
8 24 (1.16%) Facebook
9 17 (0.82%) SAP
10 16 (0.77%) Adobe
11 14 (0.68%) Sage
12 13 (0.63%) MuleSoft
12 13 (0.63%) ServiceNow
12 13 (0.63%) VMware
13 11 (0.53%) Dell
13 11 (0.53%) Guidewire
14 10 (0.48%) Rollbar
15 9 (0.44%) Infor
15 9 (0.44%) Splunk