Senior Jobs with Work from Home Options

Senior
UK > Work from Home

The median Senior salary in Work from Home is £67,500 per year according to job vacancies posted during the 6 months to 1 December 2023.

The first table below provides salary benchmarking and summary statistics including a comparison to same period in the previous 2 years.

6 months to
1 Dec 2023
Same period 2022 Same period 2021
Rank 9 8 9
Rank change year-on-year -1 +1 -1
Permanent jobs requiring a Senior 3,736 9,787 8,774
As % of all permanent jobs with a WFH option 16.41% 17.78% 17.34%
As % of the Job Titles category 17.08% 18.39% 17.86%
Number of salaries quoted 2,863 6,971 6,205
10th Percentile £47,500 £47,500 £45,000
25th Percentile £54,149 £55,000 £52,500
Median annual salary (50th Percentile) £67,500 £70,000 £65,000
Median % change year-on-year -3.57% +7.69% +8.33%
75th Percentile £84,056 £85,000 £82,500
90th Percentile £100,000 £97,290 £95,000
UK median annual salary £67,500 £70,000 £67,500
% change year-on-year -3.57% +3.70% +12.50%

All Permanent IT Job Vacancies
Work from Home

The following table is for comparison with the above and includes summary statistics for all permanent IT job vacancies with a WFH option. Most job vacancies include a discernible job title that can be normalized. As such, the figures in the second row provide an indication of the number of permanent jobs in our overall sample.

Permanent vacancies in Work from Home with a recognized job title 21,879 53,229 49,133
% of permanent jobs with a recognized job title 96.09% 96.70% 97.11%
Number of salaries quoted 16,236 37,648 36,879
10th Percentile £36,250 £36,500 £35,000
25th Percentile £46,250 £46,479 £43,750
Median annual salary (50th Percentile) £60,394 £62,500 £59,000
Median % change year-on-year -3.37% +5.93% +7.27%
75th Percentile £80,000 £81,250 £76,250
90th Percentile £97,500 £96,250 £92,500
UK median annual salary £60,000 £60,000 £57,500
% change year-on-year - +4.35% +4.55%

Senior
Trend for Jobs with a WFH Option

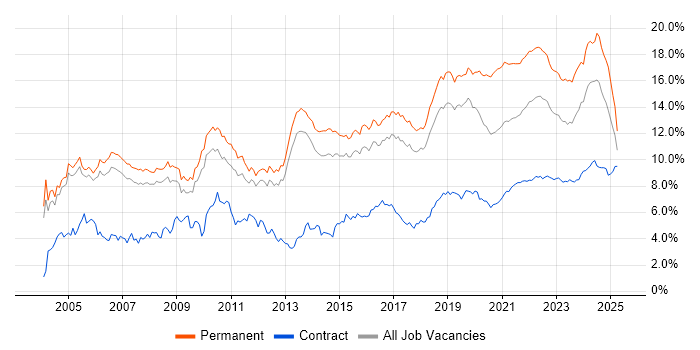
Job vacancies with a work from home option which featured Senior in the job title as a proportion of all IT jobs advertised.

Senior trend for jobs with a WFH option

Senior
Salary Trend for Jobs with a WFH Option

3-month moving average salary quoted in job vacancies with a work from home option citing Senior.

Senior salary trend for jobs with a WFH option

Senior
Salary Histogram for Jobs with a WFH Option

Salary distribution for jobs with a work from home option citing Senior over the 6 months to 1 December 2023.

Senior salary histogram for jobs with a WFH option

Senior Skill Set
Top 30 Co-occurring Skills and Capabilities in Job Vacancies with WFH Options

For the 6 months to 1 December 2023, Senior job roles required the following skills and capabilities in order of popularity. The figures indicate the absolute number co-occurrences and as a proportion of all permanent jobs with remote work options featuring Senior in the job title.

1 1,131 (30.27%) Agile
2 982 (26.28%) AWS
3 952 (25.48%) Azure
4 842 (22.54%) Social Skills
5 813 (21.76%) Finance
6 794 (21.25%) SQL
7 700 (18.74%) Python
8 691 (18.50%) Software Engineering
9 646 (17.29%) DevOps
10 605 (16.19%) JavaScript
11 590 (15.79%) Java
12 562 (15.04%) Problem-Solving
13 558 (14.94%) CI/CD
14 534 (14.29%) Degree
15 488 (13.06%) Microsoft
16 485 (12.98%) C#
17 441 (11.80%) Security Cleared
18 431 (11.54%) Docker
19 430 (11.51%) Mentoring
20 427 (11.43%) .NET
21 420 (11.24%) React
22 398 (10.65%) Kubernetes
23 396 (10.60%) Linux
24 392 (10.49%) Windows
25 387 (10.36%) Microservices
26 353 (9.45%) GCP
27 338 (9.05%) HTML
28 310 (8.30%) Scrum
29 301 (8.06%) Inclusion and Diversity
30 296 (7.92%) SaaS

Senior Skill Set
Co-occurring Skills and Capabilities with WFH Options by Category

The follow tables expand on the table above by listing co-occurrences grouped by category. The same employment type, locality and period is covered with up to 20 co-occurrences shown in each of the following categories:

Application Platforms
1 89 (2.38%) Confluence
2 63 (1.69%) SAS
3 44 (1.18%) SharePoint
4 43 (1.15%) Apache
4 43 (1.15%) MS Exchange
5 40 (1.07%) Apache Spark
6 33 (0.88%) Apache Airflow
7 25 (0.67%) nginx
8 19 (0.51%) CMS
8 19 (0.51%) WordPress
9 18 (0.48%) IIS
10 15 (0.40%) Umbraco
11 10 (0.27%) Drupal
11 10 (0.27%) Tomcat
12 8 (0.21%) JBoss
12 8 (0.21%) Red Hat Fuse
13 7 (0.19%) Jupyter
14 6 (0.16%) NServiceBus
15 5 (0.13%) OpenStack
15 5 (0.13%) Skype for Business
Applications
1 60 (1.61%) Microsoft Excel
2 57 (1.53%) Microsoft Office
3 23 (0.62%) Microsoft PowerPoint
4 16 (0.43%) Simulink
5 15 (0.40%) AutoCAD
6 13 (0.35%) Microsoft Project
7 11 (0.29%) MS Visio
8 9 (0.24%) Sketch
9 8 (0.21%) OrCAD
10 6 (0.16%) Adobe Premiere
11 5 (0.13%) Adobe Creative Suite
12 4 (0.11%) CATIA
13 3 (0.080%) Abaqus
13 3 (0.080%) Oracle Smart View
13 3 (0.080%) Photoshop
14 2 (0.054%) Adobe After Effects
14 2 (0.054%) Marvel
14 2 (0.054%) Siemens NX
14 2 (0.054%) Spreadsheet
14 2 (0.054%) Zeplin
Business Applications
1 35 (0.94%) Unit4 Business World
2 26 (0.70%) Endur
3 24 (0.64%) Remedy ITSM
4 17 (0.46%) SAP S/4HANA
5 15 (0.40%) Dynamics CRM
6 4 (0.11%) ENOVIA
6 4 (0.11%) Oracle EBS
6 4 (0.11%) Oracle ERP
6 4 (0.11%) Oracle Financials
6 4 (0.11%) SAP SD
6 4 (0.11%) Teamcenter
7 3 (0.080%) Cerner Millennium
7 3 (0.080%) NetSuite
7 3 (0.080%) Salesforce CRM
7 3 (0.080%) SAP CO
7 3 (0.080%) SAP ERP
7 3 (0.080%) SAP FI
7 3 (0.080%) SAP FI/CO
7 3 (0.080%) SAP GRC
7 3 (0.080%) SAP MDG
Cloud Services
1 982 (26.28%) AWS
2 952 (25.48%) Azure
3 353 (9.45%) GCP
4 296 (7.92%) SaaS
5 212 (5.67%) Microsoft 365
6 205 (5.49%) Serverless
7 166 (4.44%) Power Platform
8 153 (4.10%) Azure DevOps
9 107 (2.86%) OpenShift
10 104 (2.78%) GitHub
11 99 (2.65%) Entra ID
12 59 (1.58%) PaaS
13 55 (1.47%) AWS Lambda
14 52 (1.39%) AWS CloudFormation
15 51 (1.37%) Azure Service Bus
16 46 (1.23%) Amazon EC2
17 43 (1.15%) Azure Data Factory
18 41 (1.10%) Azure Cosmos DB
19 38 (1.02%) Cloud Computing
19 38 (1.02%) Snowflake
Communications & Networking
1 186 (4.98%) WAN
2 175 (4.68%) Firewall
3 152 (4.07%) LAN
4 129 (3.45%) DNS
5 102 (2.73%) DHCP
6 99 (2.65%) TCP/IP
7 91 (2.44%) VPN
8 80 (2.14%) Intrusion Detection
9 69 (1.85%) Network Security
10 64 (1.71%) Internet
11 52 (1.39%) SSL
12 51 (1.37%) Wireless
13 45 (1.20%) HTTP
13 45 (1.20%) SD-WAN
14 43 (1.15%) Wi-Fi
15 34 (0.91%) BGP
16 33 (0.88%) F5 BIG-IP LTM
17 29 (0.78%) F5 BIG-IP GTM
18 27 (0.72%) Cisco Nexus
18 27 (0.72%) SNMP
Database & Business Intelligence
1 278 (7.44%) SQL Server
2 195 (5.22%) PostgreSQL
3 154 (4.12%) Data Warehouse
4 145 (3.88%) NoSQL
5 137 (3.67%) Power BI
6 129 (3.45%) MySQL
7 98 (2.62%) MongoDB
8 97 (2.60%) Oracle Database
9 92 (2.46%) Relational Database
10 73 (1.95%) Elasticsearch
11 70 (1.87%) Oracle Database 11g
12 53 (1.42%) Redis
13 51 (1.37%) Metadata
14 49 (1.31%) Tableau
15 47 (1.26%) Big Data
16 45 (1.20%) Amazon RDS
16 45 (1.20%) Azure SQL Database
17 41 (1.10%) Data Lake
18 35 (0.94%) Base SAS
19 33 (0.88%) RDBMS
Development Applications
1 270 (7.23%) Git
2 227 (6.08%) Jenkins
3 149 (3.99%) JIRA
4 82 (2.19%) Postman
5 81 (2.17%) Cucumber
6 76 (2.03%) Selenium
7 57 (1.53%) Maven
8 53 (1.42%) Cypress.io
9 38 (1.02%) GitLab
10 29 (0.78%) IntelliJ
11 28 (0.75%) Team Foundation Server
11 28 (0.75%) Visual Studio
12 27 (0.72%) SonarQube
13 26 (0.70%) IBM UrbanCode
14 20 (0.54%) SpecFlow
14 20 (0.54%) webpack
15 19 (0.51%) Oracle APEX
15 19 (0.51%) Subversion
16 17 (0.46%) TeamCity
17 14 (0.37%) Mocha
General
1 842 (22.54%) Social Skills
2 813 (21.76%) Finance
3 301 (8.06%) Inclusion and Diversity
4 262 (7.01%) Analytical Skills
5 253 (6.77%) Retail
6 217 (5.81%) Banking
7 153 (4.10%) Public Sector
8 145 (3.88%) Marketing
9 142 (3.80%) Games
10 83 (2.22%) Automotive
11 81 (2.17%) Electronics
12 70 (1.87%) Telecoms
13 66 (1.77%) Presentation Skills
14 63 (1.69%) Legal
15 60 (1.61%) Organisational Skills
16 55 (1.47%) Military
17 54 (1.45%) Manufacturing
18 52 (1.39%) Law
19 50 (1.34%) Pharmaceutical
19 50 (1.34%) Tech for Good
Libraries, Frameworks & Software Standards
1 427 (11.43%) .NET
2 420 (11.24%) React
3 338 (9.05%) HTML
4 287 (7.68%) CSS
5 259 (6.93%) AngularJS
6 229 (6.13%) REST
7 212 (5.67%) Node.js
8 153 (4.10%) .NET Core
9 152 (4.07%) Web Services
10 149 (3.99%) RESTful
11 133 (3.56%) ASP.NET
12 127 (3.40%) XML
13 114 (3.05%) .NET Framework
14 111 (2.97%) Kafka
15 108 (2.89%) Spring
16 91 (2.44%) SOAP
17 83 (2.22%) HTML5
18 80 (2.14%) Spring Boot
18 80 (2.14%) Vue
19 68 (1.82%) Redux
Miscellaneous
1 159 (4.26%) Cloud Native
2 143 (3.83%) Product Ownership
3 120 (3.21%) Self-Motivation
4 118 (3.16%) Greenfield Project
5 111 (2.97%) Data Centre
6 100 (2.68%) Management Information System
7 95 (2.54%) Data Structures
8 81 (2.17%) Public Cloud
9 79 (2.11%) Onboarding
9 79 (2.11%) Security Operations Centre
10 75 (2.01%) Algorithms
11 58 (1.55%) Mobile App
12 57 (1.53%) Virtual Team
13 49 (1.31%) Foreign Exchange (FX)
13 49 (1.31%) Life Science
14 47 (1.26%) Hybrid Cloud
15 44 (1.18%) Distributed Systems
16 32 (0.86%) Equities
17 31 (0.83%) Embedded Systems
17 31 (0.83%) Enterprise Software
Operating Systems
1 396 (10.60%) Linux
2 392 (10.49%) Windows
3 181 (4.84%) Windows Server
4 124 (3.32%) Unix
5 67 (1.79%) Windows 10
6 60 (1.61%) Android
7 57 (1.53%) Windows Server 2019
8 56 (1.50%) Windows Server 2016
9 39 (1.04%) Mac OS
10 31 (0.83%) Apple iOS
11 30 (0.80%) Windows Server 2012
12 21 (0.56%) Windows Server 2003
13 17 (0.46%) Mac OS X
14 13 (0.35%) CentOS
15 12 (0.32%) Ubuntu
16 11 (0.29%) Red Hat Enterprise Linux
17 9 (0.24%) Embedded Linux
18 8 (0.21%) Debian
18 8 (0.21%) Windows Server 2008
19 4 (0.11%) VMS
Processes & Methodologies
1 1,131 (30.27%) Agile
2 691 (18.50%) Software Engineering
3 646 (17.29%) DevOps
4 562 (15.04%) Problem-Solving
5 558 (14.94%) CI/CD
6 430 (11.51%) Mentoring
7 387 (10.36%) Microservices
8 310 (8.30%) Scrum
9 272 (7.28%) Design Patterns
10 264 (7.07%) Computer Science
11 263 (7.04%) Actionable Insight
12 262 (7.01%) Analytics
13 252 (6.75%) Full Stack Development
14 242 (6.48%) Cybersecurity
15 224 (6.00%) Infrastructure as Code
15 224 (6.00%) Test Automation
16 209 (5.59%) Roadmaps
17 203 (5.43%) Artificial Intelligence
18 186 (4.98%) TDD
19 182 (4.87%) Project Management
Programming Languages
1 794 (21.25%) SQL
2 700 (18.74%) Python
3 605 (16.19%) JavaScript
4 590 (15.79%) Java
5 485 (12.98%) C#
6 241 (6.45%) TypeScript
7 194 (5.19%) PowerShell
8 146 (3.91%) C++
9 128 (3.43%) Bash
10 107 (2.86%) PL/SQL
11 92 (2.46%) PHP
12 78 (2.09%) C
13 77 (2.06%) Ruby
14 62 (1.66%) T-SQL
15 61 (1.63%) Go
16 55 (1.47%) R
17 47 (1.26%) Kotlin
18 35 (0.94%) SAS Macro
19 29 (0.78%) Shell Script
20 28 (0.75%) Perl
Qualifications
1 534 (14.29%) Degree
2 441 (11.80%) Security Cleared
3 256 (6.85%) SC Cleared
4 156 (4.18%) Computer Science Degree
5 141 (3.77%) DV Cleared
6 97 (2.60%) CISSP
7 86 (2.30%) Cisco Certification
8 82 (2.19%) CISM
9 76 (2.03%) TOGAF Certification
10 63 (1.69%) Master's Degree
11 60 (1.61%) SSCP
12 52 (1.39%) CCNP
13 49 (1.31%) Microsoft Certification
14 40 (1.07%) CCNA
15 35 (0.94%) BPSS Clearance
16 33 (0.88%) AWS Certification
17 29 (0.78%) Azure Certification
18 15 (0.40%) MCSA
19 14 (0.37%) CCIE
19 14 (0.37%) CREST Certified
Quality Assurance & Compliance
1 245 (6.56%) QA
2 105 (2.81%) ISO/IEC 27001
3 89 (2.38%) GDPR
4 62 (1.66%) Accessibility
5 46 (1.23%) Data Quality
6 37 (0.99%) PMO
7 35 (0.94%) CDISC
8 33 (0.88%) Cyber Essentials
9 29 (0.78%) NIST
10 21 (0.56%) WCAG
11 17 (0.46%) GRC
11 17 (0.46%) ISO 26262
12 15 (0.40%) PCI DSS
13 14 (0.37%) Automotive SPICE
14 11 (0.29%) IFRS
14 11 (0.29%) SLA
15 9 (0.24%) CRD IV
15 9 (0.24%) Cyber Essentials PLUS
16 8 (0.21%) ISO/IEC 15288
17 7 (0.19%) AUTOSAR
System Software
1 431 (11.54%) Docker
2 226 (6.05%) Active Directory
3 96 (2.57%) VMware Infrastructure
4 62 (1.66%) Hyper-V
5 40 (1.07%) Firmware
6 33 (0.88%) Virtual Machines
7 29 (0.78%) VMware ESXi
8 27 (0.72%) vSphere
9 18 (0.48%) VMware NSX
10 17 (0.46%) Virtual Desktop
11 13 (0.35%) Embedded Firmware
12 9 (0.24%) OpenSIPS
13 3 (0.080%) Ceph
13 3 (0.080%) Virtual Servers
14 2 (0.054%) Apache Flume
14 2 (0.054%) KVM
14 2 (0.054%) Varnish
15 1 (0.027%) BitLocker
15 1 (0.027%) GPFS
15 1 (0.027%) Kamailio
Systems Management
1 398 (10.65%) Kubernetes
2 265 (7.09%) Terraform
3 136 (3.64%) Ansible
4 56 (1.50%) Puppet
5 55 (1.47%) SCCM
6 48 (1.28%) Microsoft Intune
7 45 (1.20%) Prometheus
8 41 (1.10%) Grafana
9 30 (0.80%) Progress Chef
10 24 (0.64%) HP UCMDB
11 20 (0.54%) vCenter Server
12 16 (0.43%) FortiGate
13 13 (0.35%) Failover Clustering
14 12 (0.32%) Nagios
15 10 (0.27%) Microsoft Clustering
16 9 (0.24%) Microsoft Data Protection Manager
16 9 (0.24%) WSUS
17 8 (0.21%) Cisco CUCM
18 6 (0.16%) SCOM
18 6 (0.16%) vRealize
Vendors
1 488 (13.06%) Microsoft
2 187 (5.01%) Oracle
3 155 (4.15%) VMware
4 153 (4.10%) Google
5 135 (3.61%) Cisco
6 98 (2.62%) ServiceNow
7 66 (1.77%) SAP
8 63 (1.69%) CheckPoint
9 59 (1.58%) Salesforce
10 47 (1.26%) Databricks
11 39 (1.04%) Fortinet
11 39 (1.04%) Splunk
12 38 (1.02%) F5
13 37 (0.99%) HP
14 36 (0.96%) Citrix
15 35 (0.94%) Palo Alto
16 32 (0.86%) Dell
17 29 (0.78%) IBM
18 26 (0.70%) Remedy
19 25 (0.67%) Meraki