Mentoring Jobs with Work from Home Options

Mentorship
UK > Work from Home

The table below provides summary statistics for permanent job vacancies with an option to work from home (WFH) and a requirement for Mentoring skills. Included is a benchmarking guide to the salaries offered in vacancies that have cited Mentoring over the 6 months to 7 December 2023 with a comparison to the same period in the previous 2 years.

6 months to
7 Dec 2023
Same period 2022 Same period 2021
Rank 24 34 32
Rank change year-on-year +10 -2 +8
Permanent jobs citing Mentoring 2,054 4,318 4,112
As % of all permanent jobs with a WFH option 9.17% 8.00% 8.16%
As % of the Processes & Methodologies category 9.61% 8.33% 8.49%
Number of salaries quoted 1,266 2,789 2,423
10th Percentile £45,000 £44,950 £38,750
25th Percentile £53,000 £55,000 £49,500
Median annual salary (50th Percentile) £70,000 £69,447 £62,500
Median % change year-on-year +0.80% +11.12% +4.17%
75th Percentile £85,000 £85,000 £78,750
90th Percentile £97,290 £102,500 £95,000
UK median annual salary £67,500 £67,500 £62,500
% change year-on-year - +8.00% +4.17%

All Process and Methodology Skills
Work from Home

Mentoring is in the Processes and Methodologies category. The following table is for comparison with the above and provides summary statistics for all permanent job vacancies with a WFH option and a requirement for process or methodology skills.

Permanent vacancies with a requirement for process or methodology skills 21,371 51,865 48,409
As % of all permanent jobs with a WFH option 95.44% 96.12% 96.01%
Number of salaries quoted 15,602 36,195 36,353
10th Percentile £36,270 £37,500 £35,745
25th Percentile £46,306 £47,500 £43,750
Median annual salary (50th Percentile) £62,500 £62,500 £60,000
Median % change year-on-year - +4.17% +9.09%
75th Percentile £80,000 £81,250 £77,500
90th Percentile £97,500 £97,500 £93,750
UK median annual salary £60,000 £61,000 £60,000
% change year-on-year -1.64% +1.67% +9.09%

Mentoring
Trend for Jobs with a WFH Option

Job vacancies with a work from home option citing Mentoring as a proportion of all IT jobs advertised.
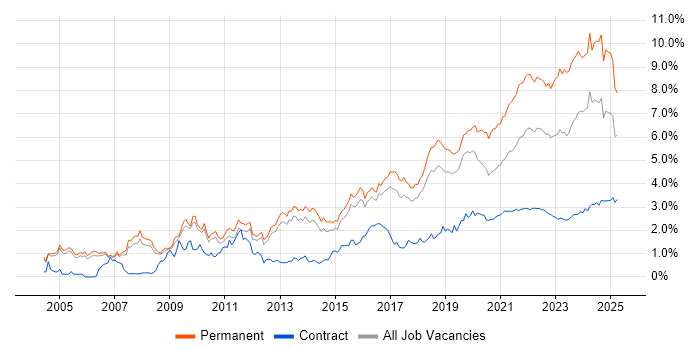
Mentoring trend for jobs with a WFH option

Mentoring
Salary Trend for Jobs with a WFH Option

3-month moving average salary quoted in job vacancies with a work from home option citing Mentoring.

Mentoring salary trend for jobs with a WFH option

Mentoring
Salary Histogram for Jobs with a WFH Option

Salary distribution for jobs with a work from home option citing Mentoring over the 6 months to 7 December 2023.

Mentoring salary histogram for jobs with a WFH option

Mentoring
Co-occurring Skills and Capabilities with WFH Options by Category

The follow tables expand on the table above by listing co-occurrences grouped by category. The same employment type, locality and period is covered with up to 20 co-occurrences shown in each of the following categories:

Application Platforms
1 81 (3.94%) Confluence
2 38 (1.85%) SharePoint
3 20 (0.97%) WebSphere
4 17 (0.83%) Apache Spark
4 17 (0.83%) IIS
4 17 (0.83%) WebSphere Application Server
5 14 (0.68%) Jupyter
5 14 (0.68%) Tomcat
6 12 (0.58%) MS Exchange
6 12 (0.58%) SAS
7 10 (0.49%) Apache
7 10 (0.49%) CMS
7 10 (0.49%) WordPress
8 6 (0.29%) IBM HTTP Server
9 5 (0.24%) Oracle Workflow
10 4 (0.19%) Oracle HTTP Server
11 3 (0.15%) nginx
11 3 (0.15%) Oracle SOA Suite
11 3 (0.15%) SharePoint 2010
11 3 (0.15%) SharePoint 2013
Applications
1 21 (1.02%) Microsoft Excel
1 21 (1.02%) Microsoft Office
2 9 (0.44%) MS Visio
3 7 (0.34%) Simulink
4 6 (0.29%) Microsoft PowerPoint
4 6 (0.29%) SOLIDWORKS
5 5 (0.24%) Autodesk Inventor
5 5 (0.24%) Microsoft Project
6 4 (0.19%) Adobe Illustrator
7 3 (0.15%) Abaqus
7 3 (0.15%) Adobe XD
7 3 (0.15%) Chatbot
7 3 (0.15%) Sketch
7 3 (0.15%) Trello
8 2 (0.097%) EViews
9 1 (0.049%) AutoCAD
9 1 (0.049%) Mathcad
9 1 (0.049%) Photoshop
9 1 (0.049%) PTC Creo
Business Applications
1 11 (0.54%) Dynamics CRM
2 9 (0.44%) Unit4 Business World
3 7 (0.34%) SAP Business One
4 6 (0.29%) Oracle Cash Management
5 5 (0.24%) ProductWriter
5 5 (0.24%) Remedy ITSM
5 5 (0.24%) SAP S/4HANA
6 3 (0.15%) Magento
6 3 (0.15%) Maximo
6 3 (0.15%) SAP CO
6 3 (0.15%) SAP FI
6 3 (0.15%) SAP FI/CO
6 3 (0.15%) SAP MM
7 2 (0.097%) Salesforce CRM
7 2 (0.097%) SAP CRM
7 2 (0.097%) SAP CX
7 2 (0.097%) SAP GTS
7 2 (0.097%) SAP SD
7 2 (0.097%) SAP WM
8 1 (0.049%) Distributed Ledger
Cloud Services
1 741 (36.08%) Azure
2 420 (20.45%) AWS
3 298 (14.51%) Azure DevOps
4 280 (13.63%) Power Platform
5 279 (13.58%) GCP
6 212 (10.32%) Serverless
7 199 (9.69%) Dynamics 365
8 98 (4.77%) SaaS
9 83 (4.04%) Microsoft 365
10 63 (3.07%) GitHub
11 62 (3.02%) PaaS
12 50 (2.43%) IaaS
13 34 (1.66%) OpenShift
14 32 (1.56%) Entra ID
15 28 (1.36%) Amazon EC2
15 28 (1.36%) AWS Lambda
16 27 (1.31%) Amazon S3
17 26 (1.27%) dbt
18 20 (0.97%) Azure Data Factory
19 18 (0.88%) PowerApps
Communications & Networking
1 49 (2.39%) SAN
2 43 (2.09%) Firewall
3 39 (1.90%) WAN
4 34 (1.66%) TCP/IP
5 33 (1.61%) LAN
6 32 (1.56%) DNS
7 24 (1.17%) VPN
8 19 (0.93%) Network Security
9 15 (0.73%) SSL
9 15 (0.73%) Wireless
10 14 (0.68%) Internet
10 14 (0.68%) iSCSI
11 13 (0.63%) HTTP
11 13 (0.63%) VLAN
12 12 (0.58%) Wi-Fi
12 12 (0.58%) WLAN
13 11 (0.54%) DHCP
13 11 (0.54%) NAS
14 9 (0.44%) Fibre Channel
14 9 (0.44%) SD-WAN
Database & Business Intelligence
1 158 (7.69%) SQL Server
2 91 (4.43%) Power BI
3 82 (3.99%) Big Data
4 72 (3.51%) MySQL
5 60 (2.92%) MongoDB
5 60 (2.92%) NoSQL
6 56 (2.73%) Data Warehouse
7 52 (2.53%) PostgreSQL
8 49 (2.39%) Hadoop
9 41 (2.00%) Elasticsearch
10 39 (1.90%) Relational Database
11 35 (1.70%) Data Lake
11 35 (1.70%) Metadata
12 26 (1.27%) Amazon RDS
13 25 (1.22%) BigQuery
14 23 (1.12%) Oracle Database
15 22 (1.07%) Tableau
16 20 (0.97%) SQL Server Integration Services
17 14 (0.68%) BusinessObjects
18 13 (0.63%) Redis
Development Applications
1 306 (14.90%) Git
2 124 (6.04%) JIRA
3 101 (4.92%) Jenkins
4 36 (1.75%) Maven
5 34 (1.66%) Selenium
6 25 (1.22%) Jasmine
7 24 (1.17%) Cucumber
7 24 (1.17%) Spinnaker
8 20 (0.97%) Cypress.io
8 20 (0.97%) IntelliJ
9 19 (0.93%) Sonatype Nexus
10 18 (0.88%) Eclipse
10 18 (0.88%) Mockito
11 17 (0.83%) GitLab
11 17 (0.83%) IBM UrbanCode
12 16 (0.78%) Oracle Forms
13 14 (0.68%) Postman
14 13 (0.63%) Bitbucket
14 13 (0.63%) Gradle
14 13 (0.63%) Oracle APEX
General
1 759 (36.95%) Finance
2 540 (26.29%) Social Skills
3 294 (14.31%) Inclusion and Diversity
4 247 (12.03%) Banking
5 186 (9.06%) Analytical Skills
6 118 (5.74%) Retail
7 108 (5.26%) Police
8 105 (5.11%) Public Sector
9 72 (3.51%) Presentation Skills
10 67 (3.26%) Organisational Skills
11 50 (2.43%) Marketing
12 48 (2.34%) Influencing Skills
13 41 (2.00%) Legal
14 39 (1.90%) Manufacturing
15 34 (1.66%) Games
15 34 (1.66%) Law
16 28 (1.36%) Pharmaceutical
17 23 (1.12%) Back Office
18 21 (1.02%) Aerospace
19 20 (0.97%) Telecoms
Job Titles
1 424 (20.64%) Senior
2 422 (20.55%) Lead
3 347 (16.89%) Software Engineer
4 337 (16.41%) Architect
5 272 (13.24%) Developer
6 195 (9.49%) Solutions Architect
7 184 (8.96%) Dynamics 365 Architect
8 179 (8.71%) Java Engineer
9 164 (7.98%) Java Software Engineer
10 144 (7.01%) Dynamics 365 Solution Architect
11 120 (5.84%) DevOps Engineer
12 91 (4.43%) Senior Developer
13 83 (4.04%) Analyst
14 77 (3.75%) Senior Software Engineer
15 72 (3.51%) Consultant
16 69 (3.36%) Lead Developer
17 68 (3.31%) Data Engineer
18 54 (2.63%) Software Developer
19 47 (2.29%) Java Developer
19 47 (2.29%) Lead Software Engineer
Libraries, Frameworks & Software Standards
1 321 (15.63%) React
2 235 (11.44%) .NET
3 193 (9.40%) Spring
4 154 (7.50%) J2EE
5 147 (7.16%) Ruby on Rails
6 145 (7.06%) HTML
7 108 (5.26%) AngularJS
8 91 (4.43%) CSS
9 72 (3.51%) RESTful
10 69 (3.36%) Node.js
11 63 (3.07%) .NET Framework
11 63 (3.07%) Web Services
12 55 (2.68%) .NET Core
13 53 (2.58%) Spring Boot
14 46 (2.24%) ASP.NET
15 43 (2.09%) REST
16 41 (2.00%) Kafka
17 31 (1.51%) XML
18 30 (1.46%) HTML5
19 29 (1.41%) RabbitMQ
Miscellaneous
1 155 (7.55%) Product Ownership
2 121 (5.89%) Public Cloud
3 90 (4.38%) Self-Motivation
4 84 (4.09%) Cyberattack
5 65 (3.16%) Cloud Native
6 56 (2.73%) Algorithms
6 56 (2.73%) Virtual Team
7 51 (2.48%) Private Cloud
8 45 (2.19%) Management Information System
9 38 (1.85%) Data Centre
10 31 (1.51%) Greenfield Project
10 31 (1.51%) Linux Command Line
11 23 (1.12%) Distributed Systems
12 22 (1.07%) Legacy Systems
12 22 (1.07%) Onboarding
13 20 (0.97%) Mobile App
13 20 (0.97%) Social Media
14 18 (0.88%) Blog
14 18 (0.88%) Driving Licence
14 18 (0.88%) Hybrid Cloud
Operating Systems
1 197 (9.59%) Linux
2 168 (8.18%) Windows
3 65 (3.16%) Windows Server
4 53 (2.58%) Unix
5 28 (1.36%) Android
6 18 (0.88%) Windows 10
7 12 (0.58%) Apple iOS
8 11 (0.54%) Windows Server 2012
9 8 (0.39%) Windows Server 2019
10 5 (0.24%) Red Hat Enterprise Linux
10 5 (0.24%) Solaris
11 3 (0.15%) Debian
11 3 (0.15%) Mac OS
11 3 (0.15%) Ubuntu
11 3 (0.15%) zOS
12 2 (0.097%) Windows 7
12 2 (0.097%) Windows 8
13 1 (0.049%) CentOS
13 1 (0.049%) VMS
Processes & Methodologies
1 997 (48.54%) Agile
2 630 (30.67%) DevOps
3 547 (26.63%) Software Engineering
4 538 (26.19%) Coaching
5 483 (23.52%) Problem-Solving
6 437 (21.28%) Actionable Insight
7 386 (18.79%) Microservices
8 301 (14.65%) Containerisation
9 286 (13.92%) Continuous Integration
10 249 (12.12%) Design Patterns
11 244 (11.88%) CI/CD
12 232 (11.30%) Unit Testing
13 206 (10.03%) Customer Engagement
14 205 (9.98%) Requirements Gathering
15 197 (9.59%) Scrum
16 193 (9.40%) Project Management
17 192 (9.35%) Test Automation
18 191 (9.30%) Code Quality
19 190 (9.25%) User Acceptance Testing
20 185 (9.01%) Supply Chain Management
Programming Languages
1 461 (22.44%) Java
2 448 (21.81%) Python
3 412 (20.06%) C#
4 315 (15.34%) SQL
5 292 (14.22%) JavaScript
6 164 (7.98%) Ruby
7 131 (6.38%) PowerShell
8 88 (4.28%) Bash
9 87 (4.24%) TypeScript
10 63 (3.07%) C++
11 57 (2.78%) Go
12 44 (2.14%) R
13 41 (2.00%) C
14 39 (1.90%) T-SQL
15 30 (1.46%) PHP
16 23 (1.12%) Rust
17 21 (1.02%) Bicep
17 21 (1.02%) Scala
18 19 (0.93%) Groovy
19 16 (0.78%) Delphi
Qualifications
1 420 (20.45%) Security Cleared
2 289 (14.07%) SC Cleared
3 288 (14.02%) Degree
4 91 (4.43%) DV Cleared
5 84 (4.09%) Computer Science Degree
6 46 (2.24%) AWS Certification
7 44 (2.14%) ITIL Certification
8 31 (1.51%) Master's Degree
9 27 (1.31%) CISSP
9 27 (1.31%) Microsoft Certification
10 26 (1.27%) AWS Certified Solutions Architect
11 25 (1.22%) AWS Certified Developer
12 23 (1.12%) AWS Certified Cloud Practitioner
13 19 (0.93%) BPSS Clearance
14 15 (0.73%) Cisco Certification
15 14 (0.68%) CISM
16 13 (0.63%) Azure Certification
16 13 (0.63%) DBS Check
16 13 (0.63%) PMI Certification
16 13 (0.63%) PMP
Quality Assurance & Compliance
1 151 (7.35%) QA
2 39 (1.90%) Data Quality
3 34 (1.66%) ISO/IEC 27001
4 23 (1.12%) Accessibility
5 20 (0.97%) PMO
6 19 (0.93%) NIST
7 18 (0.88%) Cyber Essentials
8 14 (0.68%) GDPR
9 10 (0.49%) SLA
10 9 (0.44%) Good Clinical Practice
10 9 (0.44%) PCI DSS
11 7 (0.34%) GRC
12 6 (0.29%) Cyber Essentials PLUS
12 6 (0.29%) DO-178B
12 6 (0.29%) GAAP
13 5 (0.24%) IEC 61508
14 4 (0.19%) Actionable Recommendations
14 4 (0.19%) COBIT
14 4 (0.19%) IFRS
14 4 (0.19%) IFRS 9
System Software
1 206 (10.03%) Docker
2 71 (3.46%) Active Directory
3 33 (1.61%) VMware Infrastructure
4 27 (1.31%) Firmware
5 13 (0.63%) Virtual Machines
5 13 (0.63%) vSphere
6 10 (0.49%) Hyper-V
6 10 (0.49%) Virtual Servers
7 9 (0.44%) Embedded Firmware
7 9 (0.44%) Terminal Server
8 4 (0.19%) Oracle RAC
9 3 (0.15%) Time Sharing Option
9 3 (0.15%) VMware NSX
10 1 (0.049%) Slurm Workload Manager
10 1 (0.049%) Snort
10 1 (0.049%) Virtual Desktop
10 1 (0.049%) VMware ESXi
Systems Management
1 196 (9.54%) Kubernetes
2 151 (7.35%) Terraform
3 100 (4.87%) Ansible
4 20 (0.97%) Puppet
5 15 (0.73%) SCCM
6 14 (0.68%) Microsoft Intune
7 13 (0.63%) Prometheus
8 12 (0.58%) Progress Chef
9 11 (0.54%) Nagios
10 10 (0.49%) SCOM
11 9 (0.44%) Kibana
12 8 (0.39%) HP Quality Center
12 8 (0.39%) Nessus
13 7 (0.34%) Grafana
14 6 (0.29%) CSIRT
14 6 (0.29%) Microsoft Clustering
14 6 (0.29%) Single Sign-On
15 4 (0.19%) Data Guard
15 4 (0.19%) HP Fortify
15 4 (0.19%) Oracle RMAN
Vendors
1 434 (21.13%) Microsoft
2 174 (8.47%) Oracle
3 162 (7.89%) Google
4 65 (3.16%) IBM
5 63 (3.07%) SAP
6 53 (2.58%) Salesforce
7 41 (2.00%) VMware
8 39 (1.90%) ServiceNow
9 25 (1.22%) Atlassian
10 24 (1.17%) Cisco
11 19 (0.93%) Databricks
12 18 (0.88%) Dell
13 17 (0.83%) Splunk
14 15 (0.73%) HP
14 15 (0.73%) Talend
15 13 (0.63%) Informatica
16 10 (0.49%) Dynatrace
17 8 (0.39%) New Relic
17 8 (0.39%) Sophos
17 8 (0.39%) Veracode