Microsoft Office Jobs with Hybrid/Remote/WFH Options

Microsoft Office
UK > Work from Home

The table below provides summary statistics for permanent remote or hybrid work requiring Microsoft Office skills. It includes a benchmarking guide to the annual salaries offered in vacancies that cited Microsoft Office over the 6 months leading up to 9 May 2025, comparing them to the same period in the previous two years.

6 months to
9 May 2025
Same period 2024 Same period 2023
Rank 121 97 108
Rank change year-on-year -24 +11 +57
Permanent jobs citing Microsoft Office 461 1,041 1,268
As % of all permanent jobs with a WFH option 2.77% 3.08% 3.06%
As % of the Applications category 28.32% 35.58% 42.08%
Number of salaries quoted 317 799 889
10th Percentile £25,020 £23,500 £26,250
25th Percentile £30,000 £26,750 £32,500
Median annual salary (50th Percentile) £45,000 £36,539 £45,000
Median % change year-on-year +23.16% -18.80% +12.50%
75th Percentile £55,000 £52,875 £58,750
90th Percentile £67,500 £65,000 £82,500
UK median annual salary £45,000 £32,500 £38,000
% change year-on-year +38.46% -14.47% +1.33%

All Software Application Skills
Work from Home

Microsoft Office falls under the Software Applications category. For comparison with the information above, the following table provides summary statistics for all permanent job vacancies with remote or hybrid options requiring software application skills.

Permanent vacancies with a requirement for software application skills 1,628 2,926 3,013
As % of all permanent jobs with a WFH option 9.80% 8.67% 7.27%
Number of salaries quoted 852 1,799 2,005
10th Percentile £27,250 £25,000 £30,000
25th Percentile £35,000 £30,000 £33,540
Median annual salary (50th Percentile) £50,445 £43,000 £47,500
Median % change year-on-year +17.31% -9.47% +5.56%
75th Percentile £66,230 £57,500 £62,500
90th Percentile £75,000 £67,500 £80,000
UK median annual salary £50,000 £37,500 £44,345
% change year-on-year +33.33% -15.44% -1.46%

Microsoft Office
Trend for Jobs with a WFH Option

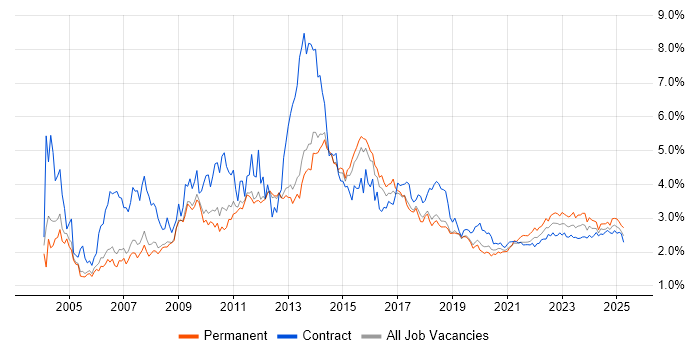
Job vacancies with remote working options citing Microsoft Office as a proportion of all IT jobs advertised.

Microsoft Office trend for jobs with Hybrid/Remote/WFH options

Microsoft Office
Salary Trend for Jobs with a WFH Option

3-month moving average salary quoted in job vacancies with remote working options citing Microsoft Office.

Microsoft Office salary trend for jobs with a WFH option

Microsoft Office
Salary Histogram for Jobs with a WFH Option

Salary distribution for jobs with remote working options citing Microsoft Office over the 6 months to 9 May 2025.

Microsoft Office salary histogram for jobs with a WFH option

Microsoft Office
Co-occurring Skills and Capabilities with WFH Options by Category

The follow tables expand on the table above by listing co-occurrences grouped by category. The same employment type, locality and period is covered with up to 20 co-occurrences shown in each of the following categories:

Application Platforms
1 52 (11.28%) SharePoint
2 36 (7.81%) Microsoft Exchange
3 20 (4.34%) IIS
4 11 (2.39%) CMS
5 10 (2.17%) WordPress
6 9 (1.95%) Confluence
7 7 (1.52%) Tomcat
8 4 (0.87%) IBM Domino
9 2 (0.43%) IBM Notes
9 2 (0.43%) Skype for Business
10 1 (0.22%) Umbraco
Applications
1 99 (21.48%) Microsoft Excel
2 55 (11.93%) Microsoft PowerPoint
3 40 (8.68%) Simulink
4 11 (2.39%) Acrobat
5 6 (1.30%) MS Visio
5 6 (1.30%) Photoshop
6 5 (1.08%) Microsoft Project
7 4 (0.87%) Adobe Premiere
8 3 (0.65%) Spreadsheet
9 2 (0.43%) Adobe Creative Suite
9 2 (0.43%) Adobe Illustrator
9 2 (0.43%) InDesign
10 1 (0.22%) Sketch
Business Applications
1 10 (2.17%) Salesforce CRM
2 7 (1.52%) Dynamics CRM
2 7 (1.52%) NetSuite
3 3 (0.65%) Magento
3 3 (0.65%) Remedy ITSM
3 3 (0.65%) Shopify
4 2 (0.43%) Dynamics AX
5 1 (0.22%) Elite 3E
Cloud Services
1 184 (39.91%) Microsoft 365
2 67 (14.53%) Azure
3 41 (8.89%) Entra ID
4 36 (7.81%) Power Platform
5 21 (4.56%) Google Workspace
5 21 (4.56%) SaaS
6 20 (4.34%) Power Automate
7 19 (4.12%) AWS
8 16 (3.47%) Dynamics 365
8 16 (3.47%) OneDrive
9 12 (2.60%) Microsoft Copilot
10 11 (2.39%) Smartsheet
11 9 (1.95%) Google Docs
12 8 (1.74%) Mimecast
13 7 (1.52%) Google Analytics
13 7 (1.52%) PowerApps
14 4 (0.87%) Fivetran
14 4 (0.87%) Snowflake
14 4 (0.87%) Zapier
15 3 (0.65%) BigCommerce
Communications & Networking
1 29 (6.29%) Firewall
2 25 (5.42%) DHCP
3 22 (4.77%) WAN
4 21 (4.56%) LAN
4 21 (4.56%) TCP/IP
5 20 (4.34%) Wi-Fi
6 19 (4.12%) VPN
7 17 (3.69%) DNS
8 15 (3.25%) Remote Desktop
9 11 (2.39%) Intranet
10 9 (1.95%) SSL
11 7 (1.52%) DMARC
12 6 (1.30%) Internet
12 6 (1.30%) SAN
12 6 (1.30%) Wireless
13 4 (0.87%) Network Security
13 4 (0.87%) VLAN
14 3 (0.65%) Ethernet
14 3 (0.65%) SD-WAN
14 3 (0.65%) VoIP
Database & Business Intelligence
1 33 (7.16%) Power BI
1 33 (7.16%) SQL Server
2 13 (2.82%) Data Warehouse
3 9 (1.95%) Relational Database
4 8 (1.74%) Big Data
4 8 (1.74%) Data Lake
4 8 (1.74%) NoSQL
5 7 (1.52%) PostgreSQL
6 5 (1.08%) Oracle Reports
7 3 (0.65%) BusinessObjects
8 2 (0.43%) Amazon RDS
8 2 (0.43%) Crystal Reports
8 2 (0.43%) MS Access
8 2 (0.43%) MySQL
8 2 (0.43%) Power Query
8 2 (0.43%) SQL Server Reporting Services
8 2 (0.43%) Tableau
9 1 (0.22%) Azure SQL Data Warehouse
9 1 (0.22%) Electronic Patient Records
9 1 (0.22%) FileMaker
Development Applications
1 10 (2.17%) JIRA
2 2 (0.43%) Git
3 1 (0.22%) Katalon Studio
3 1 (0.22%) Selenium
3 1 (0.22%) Visual Studio
3 1 (0.22%) Visual Studio Tools for Office
General
1 272 (59.00%) Social Skills
2 106 (22.99%) Finance
3 73 (15.84%) Organisational Skills
4 62 (13.45%) Analytical Skills
5 42 (9.11%) Legal
6 40 (8.68%) Aerospace
7 31 (6.72%) Retail
8 27 (5.86%) Presentation Skills
9 26 (5.64%) Law
10 25 (5.42%) Banking
11 23 (4.99%) Marketing
12 22 (4.77%) Public Sector
13 20 (4.34%) Inclusion and Diversity
14 13 (2.82%) Manufacturing
15 9 (1.95%) Back Office
15 9 (1.95%) Telecoms
16 7 (1.52%) Czech Language
17 6 (1.30%) Fire and Rescue
17 6 (1.30%) Local Government
18 5 (1.08%) Investment Banking
Job Titles
1 89 (19.31%) Analyst
2 74 (16.05%) Lead
3 60 (13.02%) Senior
4 56 (12.15%) IT Support
5 43 (9.33%) Team Leader
6 40 (8.68%) Lead Systems Engineer
6 40 (8.68%) Senior Systems Engineer
6 40 (8.68%) Systems Engineer
7 30 (6.51%) Support Analyst
8 26 (5.64%) Administrator
9 24 (5.21%) Development Manager
9 24 (5.21%) Support Engineer
10 23 (4.99%) 1st Line Support
11 21 (4.56%) IT Administrator
12 20 (4.34%) Project Manager
13 19 (4.12%) IT Analyst
14 17 (3.69%) Service Analyst
15 16 (3.47%) Business Analyst
15 16 (3.47%) Business Manager
16 15 (3.25%) Desktop Support
Libraries, Frameworks & Software Standards
1 23 (4.99%) .NET
2 12 (2.60%) XML
3 11 (2.39%) SOAP
4 10 (2.17%) JSON
4 10 (2.17%) REST
5 8 (1.74%) HTML
6 4 (0.87%) HTML5
7 2 (0.43%) CSS
7 2 (0.43%) FIX Protocol
8 1 (0.22%) .NET Core
8 1 (0.22%) AngularJS
8 1 (0.22%) Bootstrap
8 1 (0.22%) Laravel
8 1 (0.22%) Microsoft Graph
8 1 (0.22%) Node.js
8 1 (0.22%) React
8 1 (0.22%) Web Services
8 1 (0.22%) WPF
8 1 (0.22%) WSH
8 1 (0.22%) YANG
Miscellaneous
1 51 (11.06%) Management Information System
2 32 (6.94%) Onboarding
3 26 (5.64%) Self-Motivation
3 26 (5.64%) Social Media
4 17 (3.69%) Driving Licence
5 13 (2.82%) Client/Server
5 13 (2.82%) Private Cloud
6 10 (2.17%) Data Protection Act
6 10 (2.17%) e-Learning
7 9 (1.95%) EPoS
7 9 (1.95%) Graphic Design
7 9 (1.95%) Product Ownership
7 9 (1.95%) Video Conferencing
8 8 (1.74%) Life Science
9 7 (1.52%) Enterprise Software
10 6 (1.30%) Animation
11 5 (1.08%) iPhone
11 5 (1.08%) Photography
11 5 (1.08%) Renewable Energy
11 5 (1.08%) SCADA
Operating Systems
1 125 (27.11%) Windows
2 55 (11.93%) Windows 10
3 18 (3.90%) Windows Server
4 17 (3.69%) Apple iOS
5 16 (3.47%) Linux
5 16 (3.47%) Unix
6 13 (2.82%) Windows Server 2019
7 12 (2.60%) Android
8 10 (2.17%) Windows 7
8 10 (2.17%) Windows Vista
9 9 (1.95%) Windows Server 2016
10 4 (0.87%) Windows Server 2008
11 1 (0.22%) Mac OS
11 1 (0.22%) Mac OS X
11 1 (0.22%) Windows Server 2012
Processes & Methodologies
1 133 (28.85%) Project Management
2 91 (19.74%) Problem-Solving
3 85 (18.44%) Customer Service
4 84 (18.22%) Agile
5 57 (12.36%) Coaching
6 52 (11.28%) Continuous Improvement
6 52 (11.28%) CRM
7 50 (10.85%) Technical Leadership
8 49 (10.63%) Change Management
9 47 (10.20%) ITIL
10 44 (9.54%) Analytics
11 43 (9.33%) Software Delivery
12 41 (8.89%) Line Management
13 40 (8.68%) Model-Based Systems Engineering
13 40 (8.68%) Project Delivery
13 40 (8.68%) Safety Engineering
13 40 (8.68%) SysML
13 40 (8.68%) System Testing
13 40 (8.68%) Systems Engineering
14 34 (7.38%) Time Management
Programming Languages
1 36 (7.81%) SQL
2 26 (5.64%) PowerShell
3 20 (4.34%) Java
4 10 (2.17%) T-SQL
5 9 (1.95%) JavaScript
5 9 (1.95%) Python
5 9 (1.95%) VBA
6 6 (1.30%) C#
7 5 (1.08%) C++
8 4 (0.87%) C
9 2 (0.43%) Bash
9 2 (0.43%) Data Analysis Expressions
9 2 (0.43%) PHP
9 2 (0.43%) VB.NET
10 1 (0.22%) MATLAB
10 1 (0.22%) Ruby
10 1 (0.22%) VB
10 1 (0.22%) VBScript
Qualifications
1 73 (15.84%) Degree
2 40 (8.68%) BPSS Clearance
3 26 (5.64%) DBS Check
4 16 (3.47%) ITIL Certification
4 16 (3.47%) Security Cleared
5 14 (3.04%) Microsoft Certification
6 10 (2.17%) A+ Certification
7 9 (1.95%) MOS
7 9 (1.95%) SC Cleared
8 8 (1.74%) CTC Cleared
9 6 (1.30%) Azure Certification
9 6 (1.30%) CCNA
9 6 (1.30%) Cisco Certification
9 6 (1.30%) HNC
9 6 (1.30%) HND
10 4 (0.87%) PMI Certification
10 4 (0.87%) PMP
11 3 (0.65%) CCNP
11 3 (0.65%) CISSP
12 2 (0.43%) CCA
Quality Assurance & Compliance
1 31 (6.72%) SLA
2 26 (5.64%) ISO/IEC 27001
3 22 (4.77%) GDPR
4 17 (3.69%) PMO
5 16 (3.47%) Data Quality
6 15 (3.25%) QA
7 13 (2.82%) Cyber Essentials
8 9 (1.95%) PCI DSS
8 9 (1.95%) PERC
9 3 (0.65%) Accessibility
9 3 (0.65%) ISO 9001
10 1 (0.22%) COBIT
10 1 (0.22%) ISO 14001
10 1 (0.22%) ITGC
10 1 (0.22%) NIST
10 1 (0.22%) Sarbanes-Oxley
10 1 (0.22%) Software Quality Assurance
System Software
1 104 (22.56%) Active Directory
2 22 (4.77%) Hyper-V
3 19 (4.12%) VMware Infrastructure
4 11 (2.39%) Firmware
5 7 (1.52%) BitLocker
6 3 (0.65%) Virtual Desktop
7 2 (0.43%) XenApp
7 2 (0.43%) XenDesktop
8 1 (0.22%) Virtual Servers
8 1 (0.22%) VMware ESXi
8 1 (0.22%) VMware Server
8 1 (0.22%) vSphere
Systems Management
1 37 (8.03%) Microsoft Intune
2 17 (3.69%) SCCM
3 10 (2.17%) Single Sign-On
4 5 (1.08%) Active Directory Federation Services
5 4 (0.87%) EMC NetWorker
6 2 (0.43%) Backup Exec
6 2 (0.43%) Forefront Identity Manager
6 2 (0.43%) Symantec Endpoint Protection
7 1 (0.22%) DameWare
Vendors
1 374 (81.13%) Microsoft
2 40 (8.68%) MathWorks
3 33 (7.16%) Google
4 30 (6.51%) Oracle
4 30 (6.51%) Salesforce
5 22 (4.77%) Cisco
6 21 (4.56%) Apple
7 20 (4.34%) VMware
8 19 (4.12%) Adobe
9 12 (2.60%) Citrix
10 9 (1.95%) OneTrust
10 9 (1.95%) Progress
11 8 (1.74%) Fortinet
12 7 (1.52%) HP
12 7 (1.52%) Meraki
12 7 (1.52%) Twitter
12 7 (1.52%) Xero
12 7 (1.52%) YouTube
13 6 (1.30%) MobileIron
13 6 (1.30%) ServiceNow