Hybrid/Remote Time Management Job Trends

Time Management
UK > Work from Home

The table below provides summary statistics and salary benchmarking for remote or hybrid work requiring Time Management skills. It covers permanent job vacancies from the 6 months leading up to 15 November 2025, with comparisons to the same periods in the previous two years.

6 months to
15 Nov 2025
Same period 2024 Same period 2023
Rank 147 158 189
Rank change year-on-year +11 +31 -20
Permanent jobs citing Time Management 295 413 389
As % of all permanent jobs with remote/hybrid work options 1.88% 2.08% 1.78%
As % of the Processes & Methodologies category 2.05% 2.34% 1.87%
Number of salaries quoted 188 149 242
10th Percentile £20,000 £25,000 £30,431
25th Percentile £26,250 £36,250 £36,250
Median annual salary (50th Percentile) £32,000 £50,000 £47,500
Median % change year-on-year -36.00% +5.26% -13.64%
75th Percentile £55,000 £70,000 £63,750
90th Percentile £76,000 £76,000 £84,056
UK median annual salary £37,500 £47,074 £50,000
% change year-on-year -20.34% -5.85% -

All Process and Methodology Skills
Work from Home

Time Management falls under the Processes and Methodologies category. For comparison with the information above, the following table provides summary statistics for all permanent job vacancies with remote or hybrid options requiring process or methodology skills.

Permanent vacancies with a requirement for process or methodology skills 14,377 17,627 20,780
As % of all permanent jobs with a WFH option 91.87% 88.62% 94.99%
Number of salaries quoted 8,785 10,527 16,788
10th Percentile £29,500 £36,250 £36,750
25th Percentile £40,000 £46,250 £46,521
Median annual salary (50th Percentile) £57,500 £62,500 £62,500
Median % change year-on-year -8.00% - -
75th Percentile £77,500 £81,250 £80,406
90th Percentile £98,750 £100,000 £97,500
UK median annual salary £55,000 £60,000 £60,000
% change year-on-year -8.33% - -

Time Management
Job Vacancy Trend for Remote/Hybrid Jobs

Historical trend showing the proportion of permanent IT job postings citing Time Management and offering remote or hybrid work options relative to all permanent IT jobs advertised.
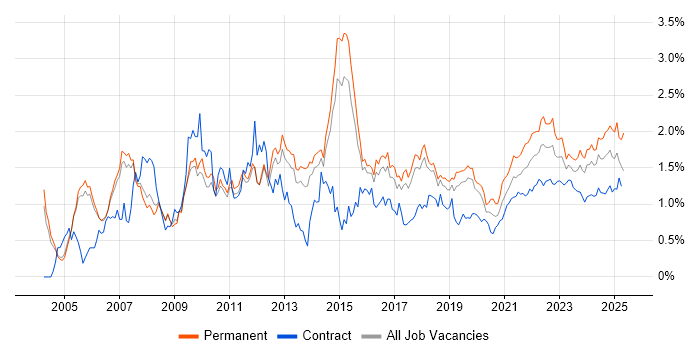
Time Management job vacancy trend for remote/hybrid jobs

Time Management
Salary Trend for Remote/Hybrid Jobs

Salary distribution trend for jobs with remote/hybrid work options citing Time Management.

Salary distribution trend for jobs with remote/hybrid work options citing Time Management

Time Management
Salary Histogram for Remote/Hybrid Jobs

Salary distribution for jobs with remote/hybrid work options citing Time Management over the 6 months to 15 November 2025.

Time Management salary histogram for jobs with remote/hybrid work options

Time Management
Co-Occurring Skills & Capabilities in Remote/Hybrid Jobs by Category

The following tables expand on the one above by listing co-occurrences grouped by category. They cover the same employment type, locality and period, with up to 20 co-occurrences shown in each category:

Application Platforms
1 25 (8.47%) SharePoint
2 12 (4.07%) WordPress
3 10 (3.39%) Microsoft Exchange
4 6 (2.03%) CMS
5 1 (0.34%) Apache Airflow
5 1 (0.34%) Moodle
5 1 (0.34%) Umbraco
Applications
1 53 (17.97%) Microsoft Excel
2 30 (10.17%) Microsoft Office
3 11 (3.73%) Microsoft PowerPoint
4 10 (3.39%) Photoshop
5 6 (2.03%) Adobe Premiere
6 5 (1.69%) Adobe Creative Suite
7 4 (1.36%) Adobe Illustrator
8 3 (1.02%) Elementor
9 2 (0.68%) AutoCAD
9 2 (0.68%) Civil 3D
9 2 (0.68%) Navisworks
9 2 (0.68%) Revit
10 1 (0.34%) Acrobat
10 1 (0.34%) Adobe XD
10 1 (0.34%) Camtasia
10 1 (0.34%) InDesign
10 1 (0.34%) Spreadsheet
Business Applications
1 12 (4.07%) SAP S/4HANA
2 9 (3.05%) SAP Payroll
3 8 (2.71%) SAP HCM
3 8 (2.71%) SAP HR
4 4 (1.36%) NetSuite
4 4 (1.36%) SAP PP
4 4 (1.36%) Shopify
5 2 (0.68%) Dynamics CRM
6 1 (0.34%) Elite 3E
6 1 (0.34%) NEC Housing
6 1 (0.34%) Raiser’s Edge
6 1 (0.34%) Salesforce CRM
6 1 (0.34%) SAP CO
6 1 (0.34%) SAP FI
6 1 (0.34%) SAP FI/CO
Cloud Services
1 44 (14.92%) Microsoft 365
2 30 (10.17%) Power Platform
3 23 (7.80%) Azure
4 15 (5.08%) Azure Synapse Analytics
5 14 (4.75%) PowerApps
6 13 (4.41%) Azure Data Factory
7 12 (4.07%) Google Analytics
8 11 (3.73%) AWS
8 11 (3.73%) SaaS
8 11 (3.73%) SuccessFactors
9 10 (3.39%) AWS Lambda
9 10 (3.39%) Entra ID
9 10 (3.39%) Serverless
10 9 (3.05%) Amazon S3
10 9 (3.05%) Amazon SQS
10 9 (3.05%) OneDrive
11 8 (2.71%) Power Automate
12 7 (2.37%) MailChimp
12 7 (2.37%) Microsoft Copilot
12 7 (2.37%) Microsoft Purview
Communications & Networking
1 7 (2.37%) Intranet
2 4 (1.36%) Firewall
3 3 (1.02%) Internet
4 2 (0.68%) DHCP
4 2 (0.68%) DNS
4 2 (0.68%) SAN
4 2 (0.68%) TETRA
4 2 (0.68%) VPN
5 1 (0.34%) NAS
5 1 (0.34%) Network Security
5 1 (0.34%) SD-WAN
5 1 (0.34%) WAN
5 1 (0.34%) Wireless
Database & Business Intelligence
1 30 (10.17%) Power BI
2 18 (6.10%) SQL Server
3 12 (4.07%) Azure SQL Database
3 12 (4.07%) SQL Server Reporting Services
4 3 (1.02%) Data Warehouse
5 2 (0.68%) GIS
5 2 (0.68%) Looker
5 2 (0.68%) Tableau
6 1 (0.34%) Data Lake
6 1 (0.34%) MongoDB
6 1 (0.34%) Power Query
6 1 (0.34%) Relational Database
Development Applications
1 5 (1.69%) SQL Server Management Studio (SSMS)
2 2 (0.68%) JIRA
3 1 (0.34%) Git
3 1 (0.34%) Jasmine
3 1 (0.34%) Karma Test Runner
General
1 161 (54.58%) Social Skills
2 68 (23.05%) Inclusion and Diversity
3 61 (20.68%) Organisational Skills
4 60 (20.34%) Finance
5 44 (14.92%) Analytical Skills
6 31 (10.51%) Marketing
7 23 (7.80%) Legal
8 17 (5.76%) Presentation Skills
9 16 (5.42%) Billing
10 15 (5.08%) Pharmaceutical
11 14 (4.75%) Retail
12 13 (4.41%) Spanish Language
13 10 (3.39%) Advertising
14 9 (3.05%) Health Technology
14 9 (3.05%) Influencing Skills
14 9 (3.05%) Publishing
14 9 (3.05%) Tech for Good
15 8 (2.71%) French Language
15 8 (2.71%) Mandarin Language
15 8 (2.71%) Portuguese Language
Job Titles
1 55 (18.64%) Analyst
2 20 (6.78%) Senior
3 18 (6.10%) Architect
3 18 (6.10%) Lead
3 18 (6.10%) Microsoft Specialist
4 16 (5.42%) Support Analyst
5 15 (5.08%) Technical Support
6 14 (4.75%) Developer
7 12 (4.07%) Commercial Analyst
7 12 (4.07%) Consultant
7 12 (4.07%) Insight Analyst
7 12 (4.07%) Operations Manager
8 11 (3.73%) IT Support
8 11 (3.73%) Junior
9 10 (3.39%) SAP Analyst
10 9 (3.05%) AWS Developer
10 9 (3.05%) Lead Developer
10 9 (3.05%) Lead Python Developer
10 9 (3.05%) Marketing Manager
10 9 (3.05%) Python Developer
Libraries, Frameworks & Software Standards
1 9 (3.05%) RESTful
1 9 (3.05%) SAP Fiori
2 8 (2.71%) HTML
3 7 (2.37%) CSS
4 2 (0.68%) .NET
5 1 (0.34%) .NET Framework
5 1 (0.34%) AngularJS
5 1 (0.34%) Bootstrap
5 1 (0.34%) EDI
5 1 (0.34%) HTML5
5 1 (0.34%) JPA
5 1 (0.34%) jQuery
5 1 (0.34%) JSON
5 1 (0.34%) Node.js
5 1 (0.34%) React
5 1 (0.34%) Ruby on Rails
5 1 (0.34%) Sass
5 1 (0.34%) Spring
5 1 (0.34%) Spring Boot
5 1 (0.34%) XML
Miscellaneous
1 54 (18.31%) Self-Motivation
2 27 (9.15%) Social Media
3 25 (8.47%) Blog
4 18 (6.10%) Data Centre
4 18 (6.10%) Microsoft Licensing
5 15 (5.08%) Analytical Mindset
5 15 (5.08%) EPoS
6 12 (4.07%) Onboarding
7 9 (3.05%) Digital Media
7 9 (3.05%) Video Editing
8 7 (2.37%) Driving Licence
8 7 (2.37%) Enterprise Software
9 6 (2.03%) Educational Technology
9 6 (2.03%) e-Learning
9 6 (2.03%) Photography
10 5 (1.69%) Learning Management System
10 5 (1.69%) Management Information System
11 3 (1.02%) Algorithms
11 3 (1.02%) Web Conferencing
12 2 (0.68%) Virtual Reality
Operating Systems
1 34 (11.53%) Windows
2 13 (4.41%) Windows 7
3 5 (1.69%) Mac OS
4 4 (1.36%) Windows Server
5 2 (0.68%) Windows 10
6 1 (0.34%) Android
6 1 (0.34%) Apple iOS
6 1 (0.34%) Linux
Processes & Methodologies
1 88 (29.83%) Problem-Solving
2 75 (25.42%) AI
3 74 (25.08%) Customer Service
4 36 (12.20%) Agile
4 36 (12.20%) Cybersecurity
4 36 (12.20%) Process Improvement
4 36 (12.20%) Software Licensing
5 35 (11.86%) CRM
6 34 (11.53%) Customer Engagement
7 32 (10.85%) Analytics
8 30 (10.17%) Continuous Improvement
9 26 (8.81%) Decision-Making
10 25 (8.47%) Project Management
11 24 (8.14%) Service Delivery
12 21 (7.12%) Data Analysis
13 19 (6.44%) Business Strategy
13 19 (6.44%) Coaching
13 19 (6.44%) Sales Enablement
14 18 (6.10%) Product Roadmap
14 18 (6.10%) Roadmaps
Programming Languages
1 47 (15.93%) SQL
2 23 (7.80%) Python
3 13 (4.41%) ABAP
3 13 (4.41%) Data Analysis Expressions
4 7 (2.37%) VBA
5 5 (1.69%) JavaScript
6 3 (1.02%) C#
7 2 (0.68%) PowerShell
7 2 (0.68%) TypeScript
8 1 (0.34%) Bicep
8 1 (0.34%) Java
8 1 (0.34%) PHP
8 1 (0.34%) Ruby
Qualifications
1 111 (37.63%) Degree
2 15 (5.08%) PMP
3 14 (4.75%) Security Cleared
4 10 (3.39%) AAT
4 10 (3.39%) ACCA
4 10 (3.39%) CIMA
5 9 (3.05%) Master's Degree
6 8 (2.71%) MRICS
7 7 (2.37%) SC Cleared
8 6 (2.03%) DBS Check
9 5 (1.69%) CIPD
9 5 (1.69%) SAP Certification
10 3 (1.02%) DV Cleared
11 2 (0.68%) MCP
11 2 (0.68%) Microsoft Certification
11 2 (0.68%) RIBA
12 1 (0.34%) Azure Certification
12 1 (0.34%) CCNA
12 1 (0.34%) Cisco Certification
12 1 (0.34%) PhD
Quality Assurance & Compliance
1 25 (8.47%) QA
2 19 (6.44%) GDPR
3 15 (5.08%) Data Quality
4 10 (3.39%) SLA
5 7 (2.37%) Accessibility
6 3 (1.02%) IFRS
7 2 (0.68%) Cyber Essentials
7 2 (0.68%) Cyber Essentials PLUS
7 2 (0.68%) ISO 19650
7 2 (0.68%) NIST
7 2 (0.68%) WCAG
8 1 (0.34%) Actionable Recommendations
8 1 (0.34%) ISO/IEC 27001
System Software
1 6 (2.03%) Active Directory
2 2 (0.68%) Docker
3 1 (0.34%) VMware Infrastructure
3 1 (0.34%) vSphere
Systems Management
1 10 (3.39%) Microsoft Intune
2 2 (0.68%) Kubernetes
3 1 (0.34%) Failover Clustering
3 1 (0.34%) Systems Management Server (SMS)
Vendors
1 106 (35.93%) Microsoft
2 35 (11.86%) Adobe
3 27 (9.15%) Google
4 22 (7.46%) Palo Alto
5 19 (6.44%) Apple
6 18 (6.10%) SAP
7 13 (4.41%) Salesforce
8 10 (3.39%) Instagram
8 10 (3.39%) TikTok
9 7 (2.37%) Facebook
10 6 (2.03%) Pardot
11 5 (1.69%) N-able
12 4 (1.36%) Mercator
13 3 (1.02%) Ahrefs
13 3 (1.02%) Databricks
13 3 (1.02%) Hootsuite
13 3 (1.02%) HubSpot
13 3 (1.02%) Talend
13 3 (1.02%) Xero
13 3 (1.02%) YouTube