Clean Code Jobs with Hybrid/Remote/WFH Options

Clean Code
UK > Work from Home

The table below provides summary statistics for permanent remote or hybrid work requiring Clean Code skills. It includes a benchmarking guide to the annual salaries offered in vacancies that cited Clean Code over the 6 months leading up to 1 May 2025, comparing them to the same period in the previous two years.

6 months to
1 May 2025
Same period 2024 Same period 2023
Rank 193 225 210
Rank change year-on-year +32 -15 -44
Permanent jobs citing Clean Code 237 479 679
As % of all permanent jobs with a WFH option 1.58% 1.42% 1.59%
As % of the Processes & Methodologies category 1.70% 1.54% 1.65%
Number of salaries quoted 198 370 494
10th Percentile £42,500 £36,250 £43,975
25th Percentile £52,500 £45,000 £53,750
Median annual salary (50th Percentile) £57,500 £62,500 £70,000
Median % change year-on-year -8.00% -10.71% +12.00%
75th Percentile £71,500 £86,875 £89,852
90th Percentile £87,875 £112,500 £102,500
UK median annual salary £60,000 £60,000 £70,000
% change year-on-year - -14.29% +12.00%

All Process and Methodology Skills
Work from Home

Clean Code falls under the Processes and Methodologies category. For comparison with the information above, the following table provides summary statistics for all permanent job vacancies with remote or hybrid options requiring process or methodology skills.

Permanent vacancies with a requirement for process or methodology skills 13,930 31,014 41,082
As % of all permanent jobs with a WFH option 93.15% 91.65% 96.09%
Number of salaries quoted 9,709 23,583 28,561
10th Percentile £30,000 £33,930 £37,500
25th Percentile £45,000 £42,500 £47,500
Median annual salary (50th Percentile) £60,000 £57,500 £62,500
Median % change year-on-year +4.35% -8.00% +4.17%
75th Percentile £77,500 £75,000 £82,500
90th Percentile £102,500 £95,000 £100,000
UK median annual salary £57,500 £55,000 £61,500
% change year-on-year +4.55% -10.57% +2.50%

Clean Code
Trend for Jobs with a WFH Option

Job vacancies with remote working options citing Clean Code as a proportion of all IT jobs advertised.
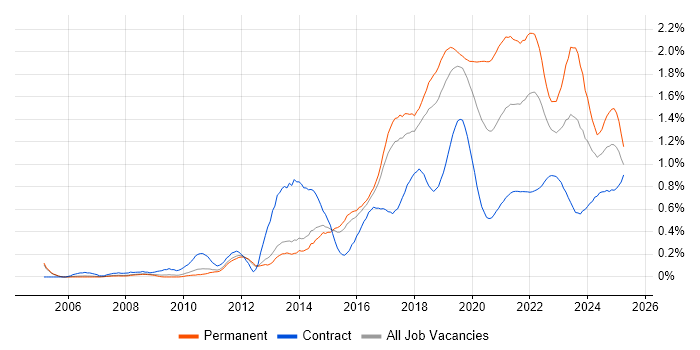
Clean Code trend for jobs with Hybrid/Remote/WFH options

Clean Code
Salary Trend for Jobs with a WFH Option

3-month moving average salary quoted in job vacancies with remote working options citing Clean Code.

Clean Code salary trend for jobs with a WFH option

Clean Code
Salary Histogram for Jobs with a WFH Option

Salary distribution for jobs with remote working options citing Clean Code over the 6 months to 1 May 2025.

Clean Code salary histogram for jobs with a WFH option

Clean Code
Co-occurring Skills and Capabilities with WFH Options by Category

The follow tables expand on the table above by listing co-occurrences grouped by category. The same employment type, locality and period is covered with up to 20 co-occurrences shown in each of the following categories:

Application Platforms
1 4 (1.69%) IIS
1 4 (1.69%) Microsoft Exchange
2 2 (0.84%) OpenStack
3 1 (0.42%) ColdFusion
3 1 (0.42%) Confluence
3 1 (0.42%) NServiceBus
Applications
1 6 (2.53%) Revit
2 2 (0.84%) Trello
Business Applications
1 8 (3.38%) Oracle EBS
2 1 (0.42%) SAP Business One
2 1 (0.42%) Shopify
Cloud Services
1 98 (41.35%) AWS
2 74 (31.22%) Azure
3 39 (16.46%) Serverless
4 36 (15.19%) AWS Lambda
5 33 (13.92%) GCP
6 26 (10.97%) GitHub
7 21 (8.86%) Azure DevOps
8 13 (5.49%) SaaS
9 12 (5.06%) Amazon ECS
10 11 (4.64%) Amazon ECR
10 11 (4.64%) Amazon ElastiCache
10 11 (4.64%) Amazon OpenSearch
10 11 (4.64%) AWS CloudFormation
10 11 (4.64%) AWS CodeBuild
10 11 (4.64%) Cloud Computing
10 11 (4.64%) dbt
10 11 (4.64%) Pulumi
11 9 (3.80%) Sentry
12 7 (2.95%) GitHub Actions
13 5 (2.11%) Entra ID
Communications & Networking
1 15 (6.33%) TCP/IP
2 8 (3.38%) HTTP
3 4 (1.69%) 3GPP
3 4 (1.69%) 5G
3 4 (1.69%) HTTPS
3 4 (1.69%) Internet
4 2 (0.84%) Wireless
4 2 (0.84%) ZigBee
5 1 (0.42%) Ethernet
5 1 (0.42%) LoRaWAN
Database & Business Intelligence
1 45 (18.99%) SQL Server
2 39 (16.46%) PostgreSQL
3 34 (14.35%) DynamoDB
4 30 (12.66%) MySQL
5 24 (10.13%) MongoDB
6 18 (7.59%) NoSQL
7 13 (5.49%) Amazon RDS
7 13 (5.49%) Elasticsearch
7 13 (5.49%) Redis
8 10 (4.22%) Relational Database
9 5 (2.11%) SQL Server Integration Services
9 5 (2.11%) SQL Server Reporting Services
10 4 (1.69%) Biml
10 4 (1.69%) Data Hub
10 4 (1.69%) Data Warehouse
10 4 (1.69%) Power BI
10 4 (1.69%) SQL CLR
10 4 (1.69%) SQL Server Analysis Services
11 3 (1.27%) Big Data
12 2 (0.84%) CouchDB
Development Applications
1 53 (22.36%) Git
2 13 (5.49%) Visual Studio
3 10 (4.22%) JIRA
4 9 (3.80%) Gradle
4 9 (3.80%) NUnit
5 8 (3.38%) JUnit
5 8 (3.38%) Maven
5 8 (3.38%) webpack
6 7 (2.95%) Moq
7 6 (2.53%) Babel
7 6 (2.53%) SpecFlow
8 5 (2.11%) GitLab
8 5 (2.11%) WiX
9 4 (1.69%) Jenkins
10 2 (0.84%) Ant
10 2 (0.84%) Mocha
10 2 (0.84%) TeamCity
10 2 (0.84%) Vite
11 1 (0.42%) Subversion
11 1 (0.42%) Team Foundation Server
General
1 75 (31.65%) Social Skills
2 41 (17.30%) Finance
3 38 (16.03%) Inclusion and Diversity
4 21 (8.86%) Games
5 20 (8.44%) Banking
6 13 (5.49%) Public Sector
7 12 (5.06%) Analytical Skills
8 10 (4.22%) Telecoms
9 6 (2.53%) Law
9 6 (2.53%) Retail
10 5 (2.11%) Back Office
10 5 (2.11%) Local Government
10 5 (2.11%) Tech for Good
11 4 (1.69%) Front Office
11 4 (1.69%) Legal
11 4 (1.69%) Pharmaceutical
12 3 (1.27%) Agriculture
12 3 (1.27%) iGaming
13 2 (0.84%) Marketing
13 2 (0.84%) Wearables
Job Titles
1 157 (66.24%) Developer
2 121 (51.05%) Senior
3 70 (29.54%) Senior Developer
4 49 (20.68%) Software Engineer
5 48 (20.25%) Software Developer
6 34 (14.35%) C# Developer
6 34 (14.35%) Senior Software Engineer
7 27 (11.39%) Senior Software Developer
8 22 (9.28%) .NET Developer
9 21 (8.86%) Full-Stack Developer
10 16 (6.75%) Senior Full-Stack Developer
11 11 (4.64%) Senior C# Developer
12 10 (4.22%) C# .NET Developer
12 10 (4.22%) C# Software Developer
12 10 (4.22%) Front-End Developer (Client-Side Developer)
12 10 (4.22%) Graduate
12 10 (4.22%) Graduate Developer
12 10 (4.22%) PHP Software Engineer
13 9 (3.80%) Site Engineer
13 9 (3.80%) Site Reliability Engineer
Libraries, Frameworks & Software Standards
1 89 (37.55%) React
2 67 (28.27%) .NET
3 61 (25.74%) Node.js
4 43 (18.14%) RESTful
5 38 (16.03%) .NET Framework
5 38 (16.03%) GraphQL
6 33 (13.92%) HTML
7 32 (13.50%) CSS
8 29 (12.24%) .NET Core
9 27 (11.39%) AngularJS
10 24 (10.13%) Entity Framework
11 19 (8.02%) REST
11 19 (8.02%) Spring
12 16 (6.75%) OAuth
13 14 (5.91%) ASP.NET
13 14 (5.91%) Kafka
13 14 (5.91%) OAuth2
14 13 (5.49%) Django
15 12 (5.06%) Spring Boot
16 11 (4.64%) JWT
Miscellaneous
1 16 (6.75%) Mobile App
2 13 (5.49%) Distributed Systems
3 11 (4.64%) IoT
3 11 (4.64%) Virtual Team
4 10 (4.22%) Self-Motivation
5 9 (3.80%) Greenfield Project
5 9 (3.80%) Mobile Games
6 7 (2.95%) Cloud Native
6 7 (2.95%) Legacy Systems
7 5 (2.11%) Team-Oriented Environment
8 4 (1.69%) Data Structures
8 4 (1.69%) Legacy Applications
8 4 (1.69%) Private Cloud
8 4 (1.69%) Wiki
9 3 (1.27%) Algorithms
9 3 (1.27%) Product Ownership
10 2 (0.84%) Hackathon
10 2 (0.84%) Low-Code
10 2 (0.84%) Online Banking
10 2 (0.84%) Smart Energy
Operating Systems
1 15 (6.33%) Linux
2 11 (4.64%) Unix
3 9 (3.80%) Android
3 9 (3.80%) Apple iOS
3 9 (3.80%) Windows
4 4 (1.69%) Mac OS
4 4 (1.69%) Windows 10
4 4 (1.69%) Windows Server
Processes & Methodologies
1 104 (43.88%) Agile
2 85 (35.86%) Microservices
3 84 (35.44%) Problem-Solving
4 83 (35.02%) Software Engineering
5 78 (32.91%) CI/CD
6 74 (31.22%) Unit Testing
7 58 (24.47%) Test Automation
8 57 (24.05%) DevOps
9 50 (21.10%) Full-Stack Development
10 39 (16.46%) Event-Driven
10 39 (16.46%) Event-Driven Architecture
10 39 (16.46%) Mentoring
11 37 (15.61%) Scrum
12 36 (15.19%) SOLID
13 35 (14.77%) Secure Coding
13 35 (14.77%) TDD
14 34 (14.35%) Computer Science
14 34 (14.35%) Functional Programming
14 34 (14.35%) Kanban
15 32 (13.50%) Technology Strategy
Programming Languages
1 84 (35.44%) C#
2 75 (31.65%) TypeScript
3 64 (27.00%) JavaScript
4 42 (17.72%) Java
5 36 (15.19%) SQL
6 33 (13.92%) Python
7 21 (8.86%) PHP
8 10 (4.22%) C++
9 9 (3.80%) Ruby
10 8 (3.38%) T-SQL
10 8 (3.38%) VB.NET
11 7 (2.95%) C
11 7 (2.95%) Go
12 5 (2.11%) Bash
12 5 (2.11%) Kotlin
13 4 (1.69%) Dart
13 4 (1.69%) Objective-C
13 4 (1.69%) PowerShell
13 4 (1.69%) Swift
14 3 (1.27%) Rust
Qualifications
1 49 (20.68%) Degree
2 30 (12.66%) Computer Science Degree
3 26 (10.97%) SC Cleared
3 26 (10.97%) Security Cleared
4 12 (5.06%) Master's Degree
5 6 (2.53%) AWS Certification
5 6 (2.53%) AWS Certified Solutions Architect
6 4 (1.69%) Azure Certification
Quality Assurance & Compliance
1 26 (10.97%) QA
2 5 (2.11%) Accessibility
3 4 (1.69%) NCSC
4 2 (0.84%) CDISC
System Software
1 49 (20.68%) Docker
2 4 (1.69%) Active Directory
2 4 (1.69%) VMware Infrastructure
3 2 (0.84%) Firmware
Systems Management
1 23 (9.70%) Kubernetes
2 12 (5.06%) Terraform
3 11 (4.64%) AWS Copilot
4 6 (2.53%) Argo
4 6 (2.53%) Prometheus
5 4 (1.69%) Microsoft Intune
Vendors
1 23 (9.70%) Google
2 11 (4.64%) Microsoft
3 9 (3.80%) Oracle
4 8 (3.38%) Okta
5 6 (2.53%) New Relic
6 4 (1.69%) VMware
7 2 (0.84%) SAP
8 1 (0.42%) Telerik